Predicting the need for aged care services at the small area level: The CAREMOD spatial microsimulation model
- University of Canberra, Australia
Cite this article
as: S. Lymer, L. Brown, A. Harding, M. Yap; 2009; Predicting the need for aged care services at the small area level: The CAREMOD spatial microsimulation model; International Journal of Microsimulation; 2(2); 27-42.
doi: 10.34196/ijm.00015
- Article
- Figures and data
- Jump to
Figures
Figure 1
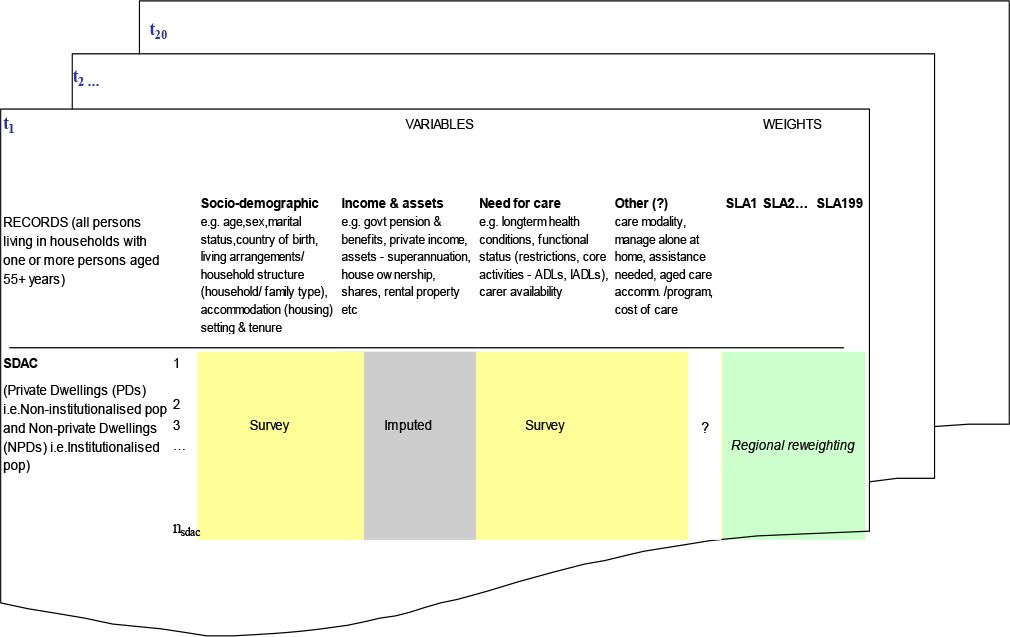

Structure of CAREMOD database.
Figure 2
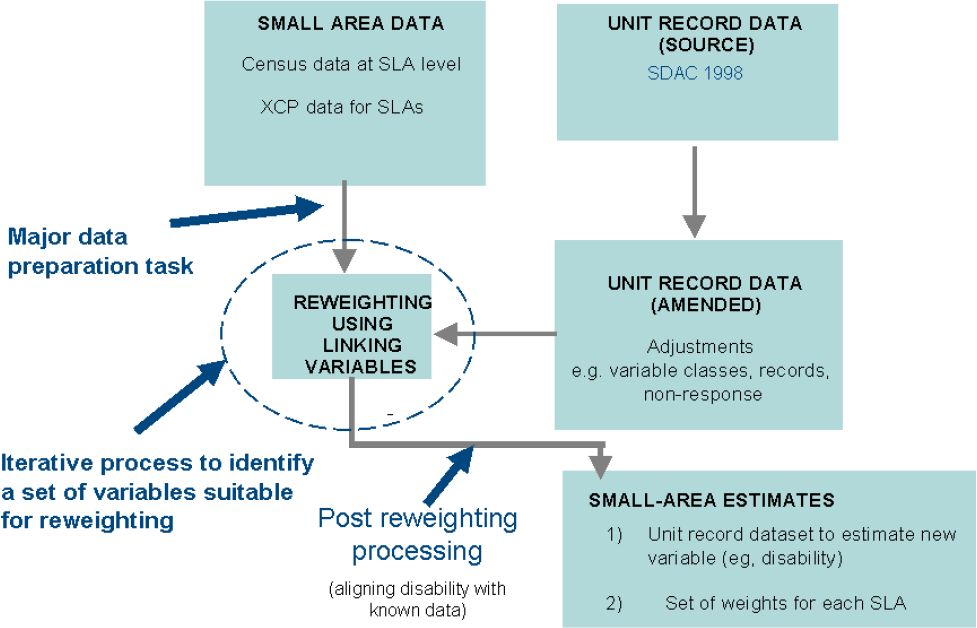

Construction of the CAREMOD database.
Figure 3
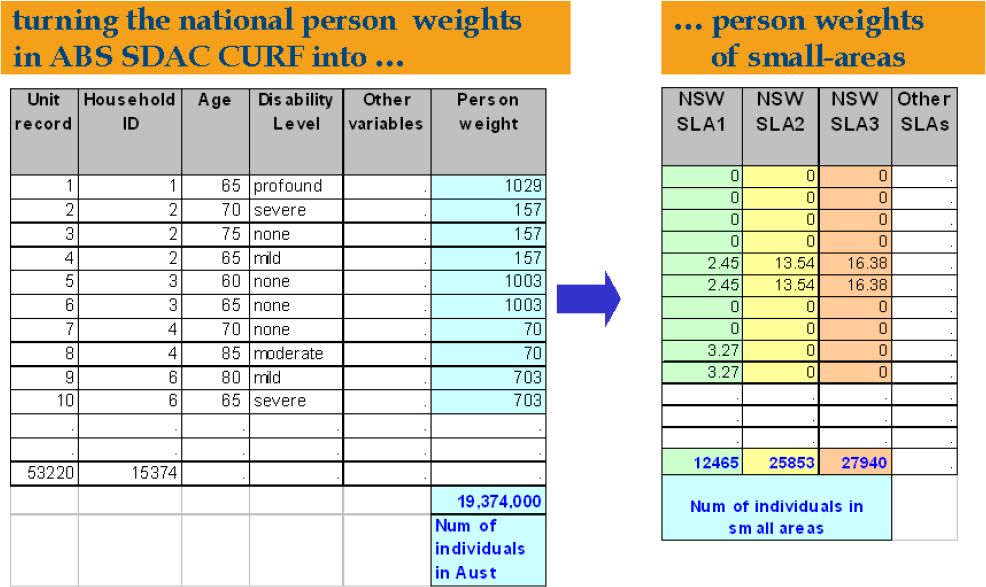

Reweighting process for the CAREMOD database.
Figure 4
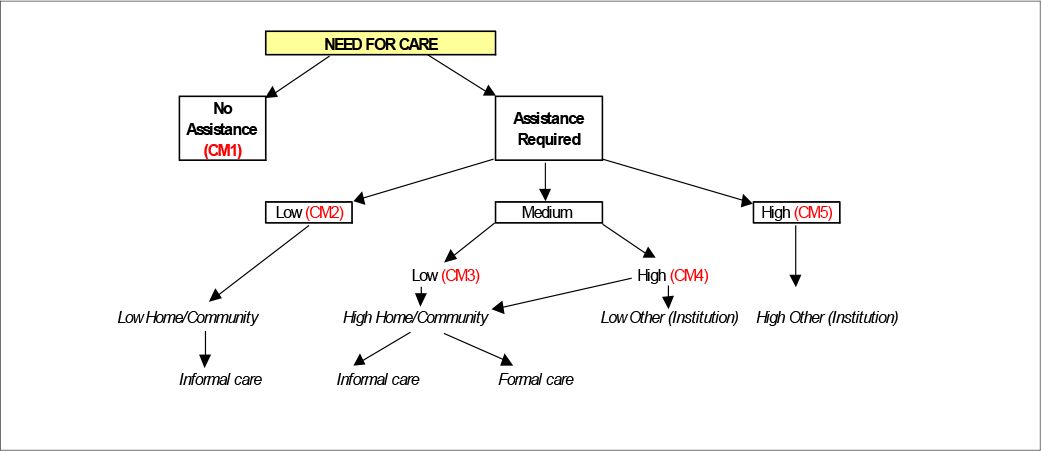

Modalities of care.
Figure 5

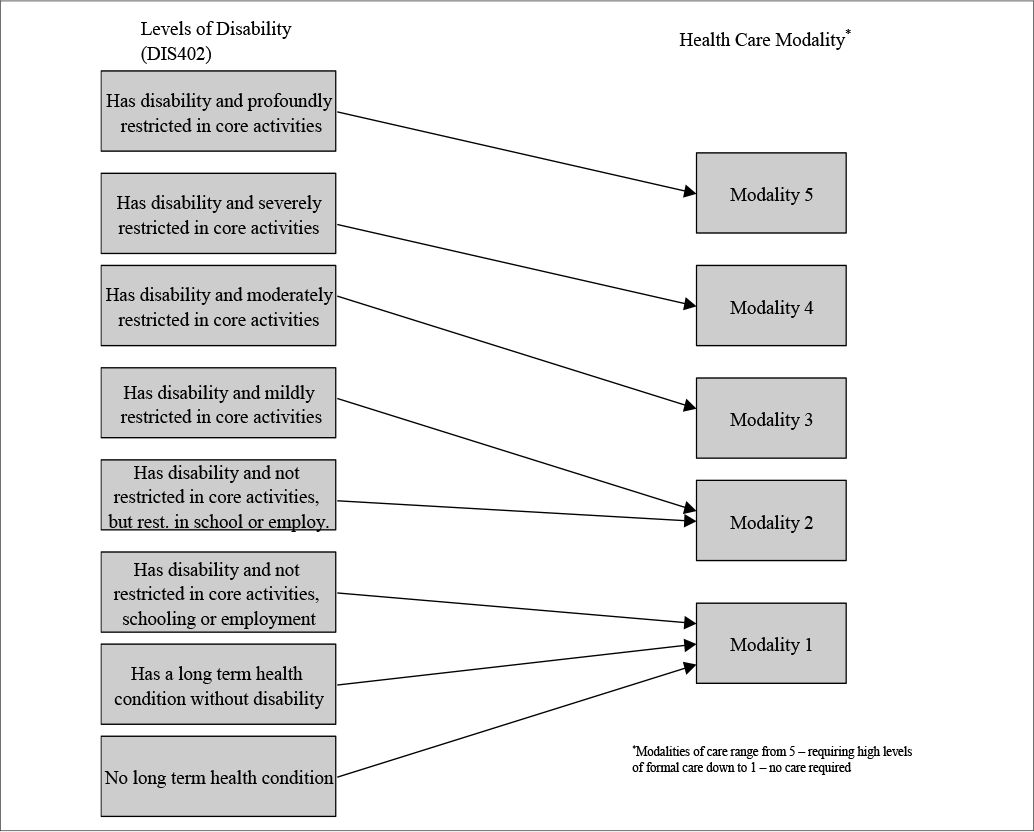
Mapping of level of disability to health care modality.
Figure 6

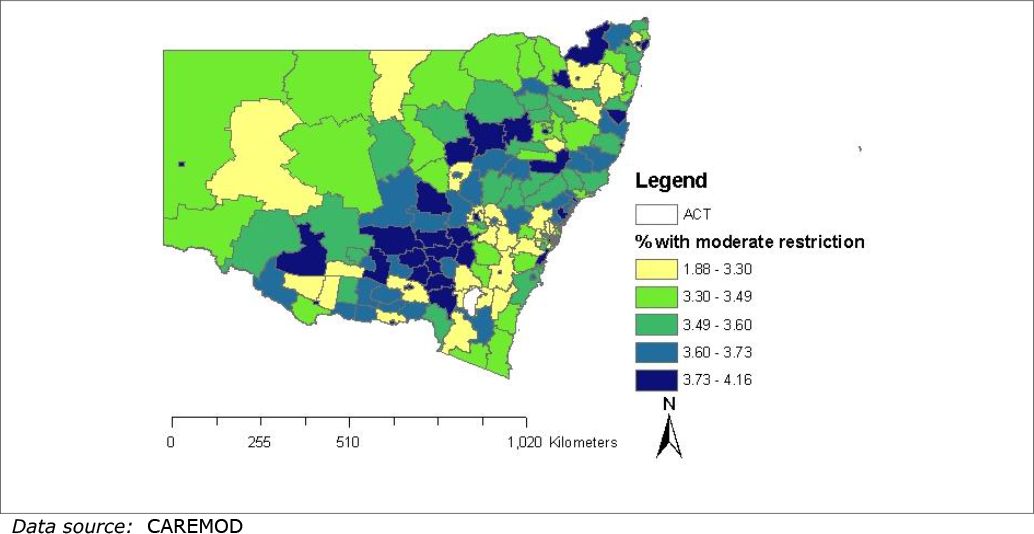
Mapping of per cent with a moderate restriction in at least one core area amongst those aged 55 years or over, by SLA.
Figure 7

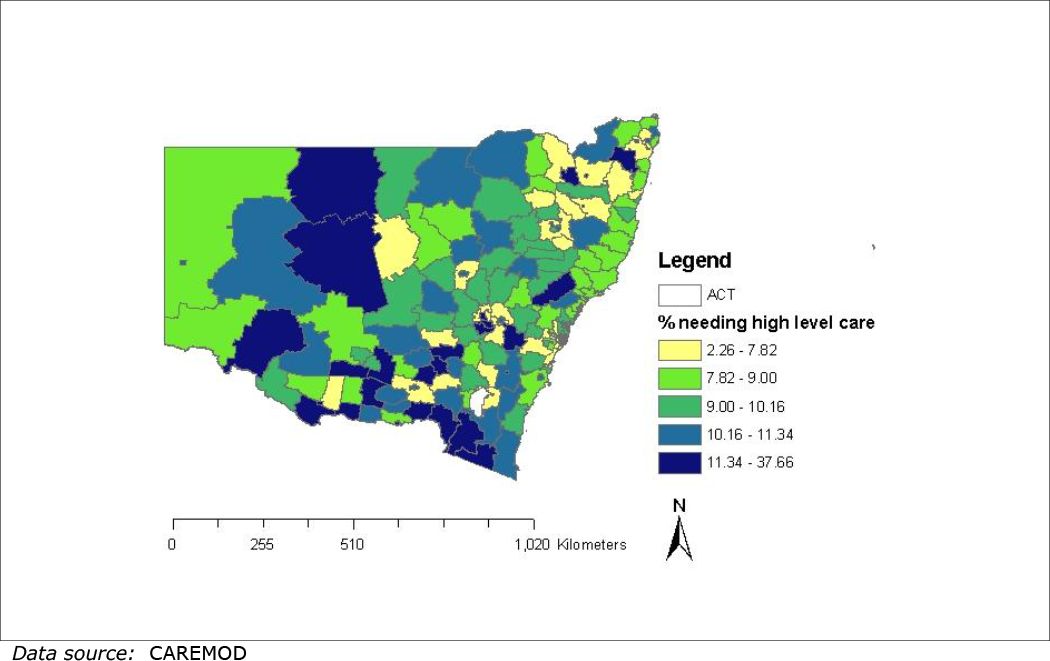
Mapping of per cent needing high level care amongst those aged 55 years or over, by SLA.
Figure 8
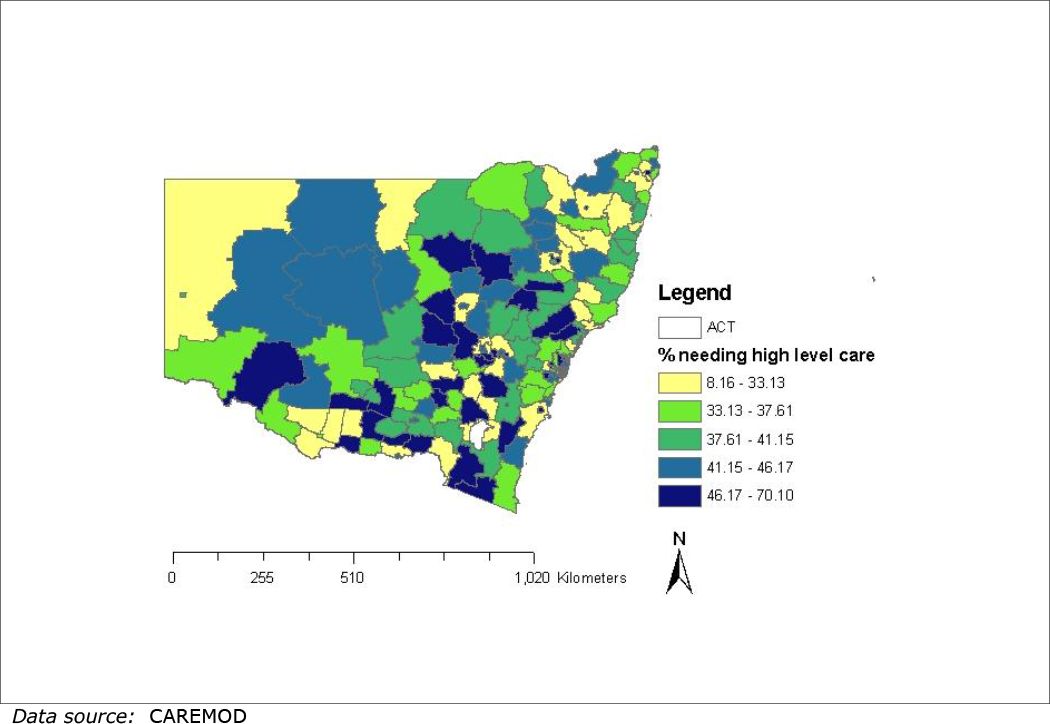
Mapping of per cent needing high level care amongst those aged 85 years or over, by SLA.
Tables
Table 1
Variable concordance between SDAC98 and 2001 census.
| Benchmark variable | Classes of SDAC98 variables (bold nos. in brackets are the Census classes that SDAC classes map to) | Classes of Census variables (classes in bold map onto SDAC classes) |
|---|---|---|
| Relationship in household | 00 Not applicable (excluded) 01 Husband, wife or de facto (1) 02 Group household (5) 03 Lone parent (2) 04 Child under 15 (7) 05 Dependent student (7) 06 Non-dependent child (3) 07 Brother/sister (4) 08 Father/mother (4) 09 Other related individual (4) 10 Unrelated individual living in a family household (4) 11 One person (6) 99 non-residents visitor (excluded) |
1. Husband, wife, or partner in de facto marriage 2. Lone parent 3. Non-dependent child 4. Other related or unrelated individual 5. Group household member 6. Lone person 7. Children <15 and student 8. Not applicable (excluded) |
| Individual income | 00 No income/no source of income (1) 01 Less than $80 (1) 02 $ 80–$119 (1) 03 $120–$159 (1) 04 $160–$199 (1) 05 $200–$239 (2) 06 $240–$279 (2) 07 $280–$319 (2/3) 08 $320–$359 (3) 09 $360–$399 (3) 10 $400–$439 (4) 11 $440–$479 (4) 12 $480–$519 (4) 13 $520–$559 (4) 14 $560–$599 (4) 15 $600–$639 (5) 16 $640–$679 (5) 17 $680–$719 (5) 18 $720–$759(5) 19 $760–$799 (5) 20 $800–$839 (5) 21 $840–$879 (5) 22 $880–$919 (5) 23 $920–$959 (5) 24 $960–$999 (5) 25 $1000–$1039 (6) 26 $1040–$1079 (6) 27 $1080–$1119 (6) 28 $1120–$1159 (6) 29 $1160 and over (6) 30 Refusal (distributed to 00–29) 31 Don’t know (distributed to 00–29) 32 Not applicable (excluded) Individuals in classes 01–29 were randomly assigned an actual dollar income which was up-rated to 2001 dollar value and then coded to one of the 6 Census classes. |
1. $0–$199 2. $200–$299 3. $300–$399 4. $400–$599 5. $600–$999 6. $1,000 or more 7. Not applicable (excluded) 8. Negative income (distributed to 1) 9. Not stated (distributed to 1–6) |
| Housing tenure type | 0 Not applicable (5) 1 Owner without a mortgage (1) 2 Owner with mortgage (2) 3 Rented – public (4) 4 Rented – private (3) 5 Rented – other (distributed to 3 and 4) 6 Boarder (excluded) 7 Living rent-free (excluded) 8 Other (excluded) |
1. Fully Owned 2. Being Purchased 3. Rented – private 4. Rented – public 5. Not applicable (excluded) 6. Rented – not stated (distributed to 3 and 4) 7. Being Occupied rent-free (excluded) 8. Other Tenure (excluded) 9. Not Stated (distributed to 1–5) |
| Level of education | Level of post-school educational qualification 1. Higher degree (1) 2. Post-graduate diploma (1) 3. Bachelor degree (1) 4. Undergraduate diploma (1) 5. Associate diploma (1) 6. Skilled vocational qualification (1) 7. Basic vocational qualification (1) 8. Uncodable/inadequately described out of scope/not applicable (2) |
1. Has a non-school qualification 2. Does not have a non-school qualification 3. Level of education not stated (distributed to 1 and 2) 4. Level of education inadequately described (distributed to 1 and 2) |
Table 2
Comparison of synthetic estimates and census counts of constrained variables.
| Average across SLAs | Standard deviation across SLAs | |||
|---|---|---|---|---|
| Constrained variable | Census | CAREMOD | Census | CAREMOD |
| Has non-school qualification | 9,942 | 9,941 | 13,983 | 13,983 |
| Wife/Husband/ spouse/in de facto relationship | 13,494 | 14,275 | 18,328 | 19,348 |
| Aged 65 years and over | 4,176 | 4,176 | 5,597 | 5,597 |
| Male | 15,741 | 15,741 | 21,074 | 21,074 |
| Female | 16,152 | 16,152 | 21,718 | 21,718 |
| Male aged 65 years or over | 1,825 | 1,825 | 2,419 | 2,422 |
| Home fully owned | 12,311 | 12,177 | 16,753 | 16,526 |
| Mortgage on home | 9,243 | 9,093 | 13,889 | 13,653 |
| Rental – Private | 7,026 | 6,936 | 9,450 | 9,344 |
| Rental – Public | 1,479 | 1,264 | 3,151 | 2,901 |
-
Notes: CAREMOD estimates based on reweighted SDAC population, averaged across all SLA including those four SLAs for which GREGWT failed to provide a convergent set of weights; Census and CAREMOD SLA coverage excludes the “Offshore and Migratory” SLA.
-
Source: ABS Census 2001, CAREMOD.
Table 3
Comparison of synthetic estimate and census counts of unconstrained variables.
| Average across SLAs | Standard deviation across SLAs | |||
|---|---|---|---|---|
| Unconstrained variables | Census | CAREMOD | Census | CAREMOD |
| Living in non private dwelling | 993 | 1,848 | 1,336 | 2,157 |
| Not in labour force | 9,066 | 7,734 | 12,379 | 10,521 |
| Employed | 13,819 | 14,543 | 18,959 | 20,182 |
| Australian Born | 24,327 | 25,334 | 31,108 | 34,205 |
| Unemployed | 1,065 | 1,102 | 1,542 | 1,566 |
| Married or de facto marital status | 13,494 | 13,799 | 18,328 | 18,664 |
| Males aged 65 years and over who were employed | 197 | 239 | 228 | 317 |
-
Notes: Based on all SDAC population excluding the Offshore and migratory SLA but including all other SLAs, even those that have been deemed not to converge.
-
Source: ABS Census 2001, CAREMOD.
Table 4
Imputation models for survey variables.
| Variable | Type of Model | Predictors |
|---|---|---|
| Presence of disability (disability defined as having at least a moderate restriction in 1 core area) | Logistic regression | sex, age group, relationship in household, tenure type, income group |
| Number of core areas has disability (0, 1, 2 or 3) | Ordinal logit | age group, sex, relationship in household, tenure type, and income group |
| Which areas out of mobility, self care or communication were restricted | Multinomial logit | Sex, education level age group relationship in household tenure type and income group |
| Disability Status (8 levels) | Ordinal logit | age group, income group, tenure type and relationship in the household |
-
Note: Models were built on main effects only i.e. no interaction terms were modelled.
Table 5
Disability status model development.
| Model Variables | Wald x2 | P-value |
|---|---|---|
| Age | 8,676.0 | < 0.001 |
| Age + relationship in household | 9,537.6 | < 0.001 |
| Age + relationship in household + tenure type | 9,771.8 | <0.001 |
| Age + relationship in household + tenure type + income | 100,073.0 | < 0.001 |
| Age + relationship in household + tenure type + income + sex | 10,131.1 | <0.001 |
| Age + relationship in household + tenure type + income + sex +education | 10,133.9 | 0.07 |
Table 6
Comparison of CAREMOD to SDAC estimates (%).
| Variable | CAREMOD 2001 | SDAC 1998 |
|---|---|---|
| Profound Disability | 3.3 | 2.9 |
| Severe Disability | 4.0 | 3.5 |
| Moderate Disability | 2.9 | 3.5 |
| At least Moderate disability | 10.2 | 9.6a |
-
a
95% Confidence interval for this estimate = 5.4–13.8%.
Table 7
Comparison of methods in the development of CAREMOD.
| Method | Estimate of at least moderate disability (%) |
|---|---|
| Reweighting | 13.4 |
| Reweighting + cloning | 15.0 |
| Reweighting + cloning + regression modelling | 13.8 |
| Reweighting + cloning + regression modelling + scaling | 10.2 |
Table 8
Correlation between disability and constrained variables.
| Variables | Pearson’s R |
|---|---|
| Education | −0.01 |
| Tenure Type | 0.00 |
| Income | 0.11 |
| Relationship in Household | −0.13 |
| Age | −0.45 |
| Sex | −0.01 |
Download links
A two-part list of links to download the article, or parts of the article, in various formats.