Scaling up infrastructure spending in the philippines: A cge top-down bottom-up microsimulation approach
- GREDI, Faculté d’administration, Université de Sherbrooke, Canada
Cite this article
as: L. Savard; 2010; Scaling up infrastructure spending in the philippines: A cge top-down bottom-up microsimulation approach; International Journal of Microsimulation; 3(1); 43-59.
doi: 10.34196/ijm.00024
- Article
- Figures and data
- Jump to
Figures
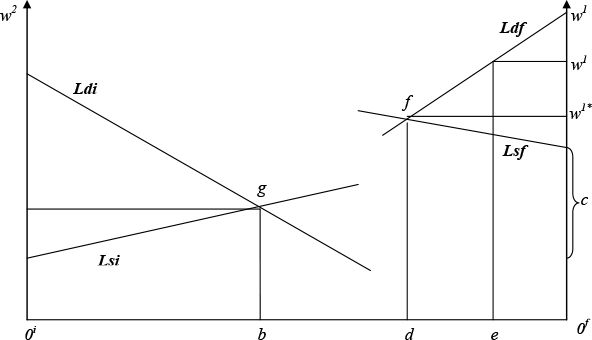
Figure 1

Labour market representation.
Figure 2
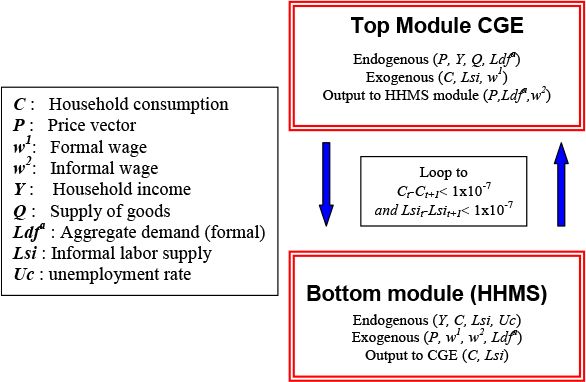
Resolution procedure of the TD/BU approach.
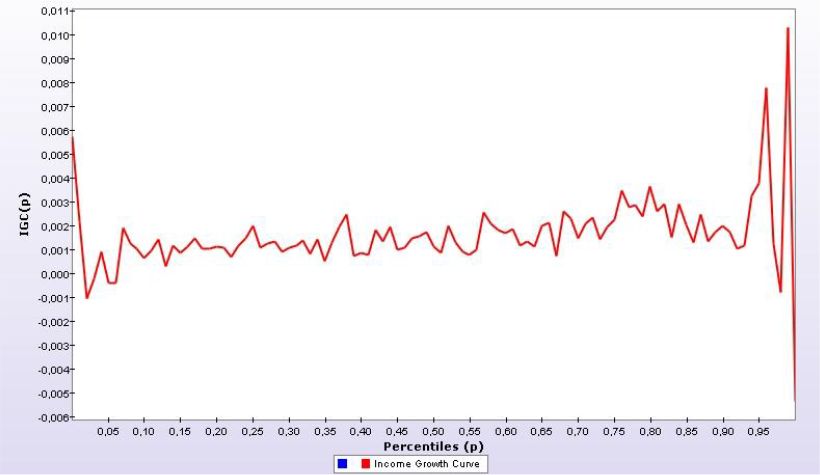
Figure 3

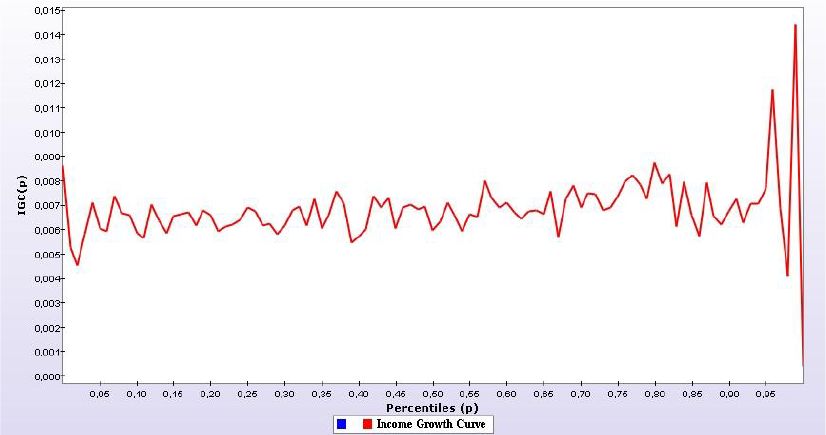
Income growth curve: VAT-funded productive infrastructure.
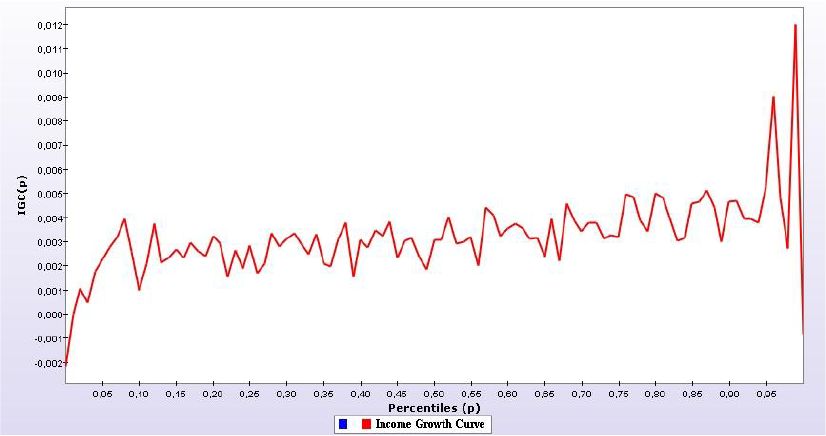
Figure 4

Income growth curve: income tax funded productive infrastructure.
Figure 5
Income growth curve: foreign-aid funded productive infrastructure.
Tables
Table 1
Macroeconomic results (% variations).
| Value added tax | Income tax | Foreign Aid | |||||
|---|---|---|---|---|---|---|---|
| Definition | Base | Non productive investment | Productive investment | Non productive investment | Productive investment | Non productive investment | Productive investment |
| Household income | 86,476.9 | 0.15 | 0.74 | 0.17 | 0.75 | 0.14 | 0.73 |
| Household savings | 9,651.8 | −2.20 | −3.24 | −1.98 | −2.99 | −3.41 | −4.21 |
| Informal Wage Government | 0.5 | 0.43 | 0.98 | 0.49 | 1.05 | 0.39 | 0.94 |
| income | 20,367 | 3.94 | 3.94 | 3.94 | 3.94 | 3.94 | 3.94 |
| Firms’ income Government | 26,172.9 | −0.14 | 0.52 | −0.17 | 0.49 | −0.17 | 0.51 |
| savings Government | 13,369 | 30.00 | 30.00 | 30.00 | 30.00 | 30.00 | 30.00 |
| expenditure Private | 16,818.8 | 2.38 | 2.38 | 2.38 | 2.38 | 2.38 | 2.38 |
| investment | 23,161.2 | −1.23 | −0.54 | −1.86 | −1.07 | −1.54 | −0.82 |
| Firms’ savings | 7,810.5 | 0,00 | 0.95 | −0.31 | 0.90 | −0.30 | 0.92 |
| Unemployment rate | 16.8 | −1.05 | −1.95 | −1.14 | −1.95 | −0.9 | −1.84 |
| Nominal exchange rate | 1 | 0.69 | 0.39 | 0.06 | −0.13 | −1.20 | −1.18 |
| Gross domestic product | 1,04,510.7 | 0.16 | 0.79 | 0.17 | 0.80 | 0.15 | 0.79 |
-
Source: Values computed by the author.
Table 2
Sectoral results: rental rate of capital (% variation).
| Value added tax | Income tax | Foreign Aid | ||||||
|---|---|---|---|---|---|---|---|---|
| Variables | branches | Reference | Non productive investment | Productive investment | Non productive investment | Productive investment | Non productive investment | Productive investment |
| r (rental rate of capital) | Palay & corn | 1 | −0.76 | 2.13 | −0.49 | 2.36 | −0.16 | 2.66 |
| Fruit & vegetable | 1 | −1.24 | 0.17 | −1.16 | 0.24 | −0.34 | 0.94 | |
| Coconut | 1 | −0.45 | 1.68 | −0.34 | 1.79 | −1.05 | 1.16 | |
| Livestock | 1 | −0.71 | 1.66 | −0.87 | 1.49 | 0.79 | 2.92 | |
| Fishing | 1 | −0.5 | 0.92 | −0.57 | 0.84 | −0.33 | 1.07 | |
| Other agriculture | 1 | −0.11 | 0.79 | −0.29 | 0.65 | −1.15 | −0.09 | |
| Logging & timber | 1 | 1.3 | 4.33 | 0.79 | 3.9 | 1.03 | 4.09 | |
| Mining | 1 | 0.33 | 1.14 | −0.06 | 0.81 | −2.49 | −1.25 | |
| Manufacturing | 1 | −0.1 | −0.26 | −0.04 | −0.2 | −1.46 | −1.4 | |
| Rice manufacturing | 1 | −0.26 | 0.86 | −0.05 | 1.03 | 0.09 | 1.15 | |
| Meat industry | 1 | −0.01 | −0.32 | −0.19 | −0.49 | 1.12 | 0.62 | |
| Food manufacturing | 1 | −1.41 | −1.82 | −1.2 | −1.64 | −0.87 | −1.38 | |
| Electricity, gas & water | 1 | 0.32 | −0.39 | 0.49 | −0.27 | 0.65 | −0.11 | |
| Construction | 1 | 2.03 | 2.62 | 1.96 | 2.56 | 2.9 | 3.34 | |
| Commerce | 1 | −0.18 | 0.67 | −0.14 | 0.7 | −1,00 | −0.02 | |
| Trans. & comm. | 1 | 0.55 | 0.98 | 0.16 | 0.67 | 0.82 | 1.22 | |
| Finance | 1 | 0.5 | 1.3 | 0.72 | 1.48 | 0.07 | 0.94 | |
| Real estate | 1 | −0.48 | −0.55 | −1.33 | −1.31 | 0.34 | 0.14 | |
| Services | 1 | 0.07 | 0.14 | 0.51 | 0.52 | 0.09 | 0.17 | |
-
Source: Values computed by the author.
Table 3
Sectoral results: market prices (% variation).
| Value added tax | Income tax | Foreign Aid | ||||||
|---|---|---|---|---|---|---|---|---|
| Variables | branches | Reference | Non productive investment | Productive investment | Non productive investment | Productive investment | Non productive investment | Productive investment |
| Pq (market price) | Palay & corn | 1.01 | −0.09 | 1.65 | −0.24 | 1.52 | −0.21 | 1.55 |
| Fruit & vegetable | 1.02 | 0.25 | 0.77 | −0.55 | 0.1 | −0.19 | 0.4 | |
| Coconut | 1.02 | 0.62 | 1.61 | 0.01 | 1.11 | −0.45 | 0.71 | |
| Livestock | 1.01 | 0.45 | 1.33 | −0.31 | 0.68 | 0.17 | 1.09 | |
| Fishing | 1.01 | 0.19 | 0.81 | −0.24 | 0.43 | −0.16 | 0.51 | |
| Other agriculture | 1.03 | 0.57 | 0.76 | 0.06 | 0.33 | −0.6 | −0.23 | |
| Logging & timber | 1.01 | 1.12 | 2.38 | 0.46 | 1.83 | 0.32 | 1.71 | |
| Mining | 1.01 | 0.69 | 0.42 | 0.08 | −0.09 | −1.07 | −1.06 | |
| Manufacturing | 1.08 | 0.83 | 0.4 | 0.07 | −0.23 | −0.61 | −0.8 | |
| Rice manufacturing | 1,000 | 0.16 | 1.27 | −0.11 | 1.04 | −0.2 | 0.97 | |
| Meat industry | 1.01 | 0.7 | 0.91 | −0.15 | 0.19 | 0.21 | 0.5 | |
| Food manufacturing | 1.03 | 0.47 | 0.47 | −0.24 | −0.12 | −0.37 | −0.24 | |
| Electricity, gas & w ater | 1.01 | 0.97 | −0.02 | 0.25 | −0.63 | 0.05 | −0.79 | |
| Construction | 1.01 | 1.13 | 0.82 | 0.52 | 0.31 | 0.33 | 0.15 | |
| Commerce | 1.05 | 1.02 | 0.8 | 0.06 | −0.01 | −0.39 | −0.38 | |
| Trans. & comm. | 1.01 | 1.08 | 0.68 | 0.18 | −0.07 | −0.03 | −0.25 | |
| Finance | 1.05 | 2.2 | 1.92 | 0.35 | 0.37 | −0.18 | −0.08 | |
| Real estate | 1,000 | 0.03 | −0.68 | −0.61 | −1.23 | 0.19 | −0.54 | |
| Services | 1.04 | 2.1 | 1.4 | 0.2 | −0.18 | 0.32 | −0.09 | |
| Public services | 1,000 | 0.51 | 0.5 | 0.17 | 0.23 | 0.05 | 0.12 | |
-
Source: Values computed by the author.
Table 4
Poverty index results (% variation).
| Value added tax | Income tax | Foreign Aid | ||||||
|---|---|---|---|---|---|---|---|---|
| Poverty index | Code-education | Base | Non productive investment | Productive investment | Non productive investment | Productive investment | Non productive investment | Productive investment |
| FGT-0 | National | 0.311 | −0.26 | −0.86 | 0.67 | −0.19 | 0.49 | −0.41 |
| FGT-1 | National | 0.096 | −0.27 | −1.29 | 1.05 | −0.20 | 0.68 | −0.52 |
| FGT-2 | National | 0.04 | −0.30 | −1.57 | 1.33 | −0.22 | 0.88 | −0.6 |
| FGT-0 | 0 | 0.564 | −0.36 | −1.08 | 0.51 | 0.07 | 0.71 | 0.2 |
| 1 | 0.501 | −0.37 | −0.89 | 0.31 | −0.26 | 0.27 | −0.61 | |
| 2 | 0.384 | −0.29 | −0.8 | 0.70 | −0.26 | 0.3 | −0.42 | |
| 3 | 0.317 | 0.35 | −0.71 | 1.52 | 0.27 | 1.38 | −0.30 | |
| 4 | 0.184 | −0.34 | −0.94 | 0.85 | −0.33 | 0.2 | −0.54 | |
| 5 | 0.092 | −0.47 | −0.83 | 1.58 | −0.35 | 1.35 | 0.40 | |
| 6 | 0.021 | −0.42 | −0.42 | −0.42 | −0.42 | 3.54 | −0.42 | |
| FGT-1 | 0 | 0.185 | −0.19 | −0.99 | 0.96 | −0.05 | 0.92 | −0.09 |
| 1 | 0.168 | −0.24 | −1.19 | 0.94 | −0.20 | 0.61 | −0.50 | |
| 2 | 0.116 | −0.30 | −1.36 | 1.05 | −0.23 | 0.62 | −0.61 | |
| 3 | 0.090 | −0.32 | −1.37 | 1.15 | −0.17 | 0.79 | −0.51 | |
| 4 | 0.048 | −0.31 | −1.56 | 1.29 | −0.22 | 0.71 | −0.71 | |
| 5 | 0.022 | −0.26 | −1.65 | 1.60 | −0.11 | 1.05 | −0.57 | |
| 6 | 0.005 | −0.49 | −1.87 | 1.43 | −0.24 | 1.51 | −0.20 | |
| FGT-2 | 0 | 0.08 | −0.25 | −1.32 | 1.25 | −0.09 | 1.14 | −0.18 |
| 1 | 0.075 | −0.27 | −1.48 | 1.23 | −0.23 | 0.82 | −0.58 | |
| 2 | 0.048 | −0.32 | −1.64 | 1.34 | −0.26 | 0.82 | −0.70 | |
| 3 | 0.035 | −0.36 | −1.66 | 1.41 | −0.20 | 0.95 | −0.64 | |
| 4 | 0.018 | −0.31 | −1.78 | 1.57 | −0.23 | 0.93 | −0.76 | |
| 5 | 0.007 | −0.28 | −2.01 | 1.92 | −0.19 | 1.22 | −0.78 | |
| 6 | 0.002 | −0.38 | −1.83 | 1.83 | 0.00 | 2.12 | 0.24 | |
-
Source: Values computed by the author.
-
Notes: See Table A.2 for educational codes.
Table A.1
Externality elasticities by sector.
| branches | ξ value |
|---|---|
| Palay & corn | 0.01 |
| Fruit & vegetable | 0.015 |
| Coconut | 0.019 |
| Livestock | 0.011 |
| Fishing | 0.012 |
| Other agriculture | 0.018 |
| Logging & timber | 0,003 |
| Mining | 0.027 |
| Manufacturing | 0.038 |
| Rice manufacturing | 0.01 |
| Meat industry | 0.025 |
| Food manufacturing | 0.025 |
| Electricity, gas & w ater | 0.039 |
| Construction | 0.021 |
| Commerce | 0.022 |
| Trans. & comm. | 0.018 |
| Finance | 0.013 |
| Real estate | 0.027 |
| Services | 0.01 |
Table A.2
Educational code definition.
| Education Code | Level of education |
|---|---|
| 1 | Elementary (not graduated) |
| 2 | Elementary graduate |
| 3 | 1st to 3rd Year High school |
| 4 | High School Graduate |
| 5 | College Undergraduate |
| 6 | At least College graduate |
| 0 | Not reported or no grade |
Table A.3
Funding mechanisms variations.
| Value added tax | Income tax | Foreign Aid | |||||
|---|---|---|---|---|---|---|---|
| Non productive investment | Productive investment | Non productive investment | Productive investment | Non productive investment | Productive investment | ||
| Level | Base | 2.45% | 2.45% | 2.19% | 2.19% | 2,272 | 2,272 |
| Level | After simulation | 3.28% | 3.16% | 3.17% | 3.00% | 11,142 | 9,909 |
| Variation | Variation | 33.80% | 28.80% | 43.80% | 37.17% | 390.40% | 336.14% |
Table A.4
Sectoral results: Value added (% variation)
| Value added tax | Income tax | Foreign Aid | ||||||
|---|---|---|---|---|---|---|---|---|
| Variables | branches | Reference | Non productive investment | Productive investment | Non productive investment | Productive investment | Non productive investment | Productive investment |
| Va (value added) | Palay & corn | 5,197.9 | −0.17 | 0.25 | −0.14 | 0.27 | −0.08 | 0.33 |
| Fruit & vegetable | 4,210.7 | −0.26 | 0.06 | −0.26 | 0.07 | −0.11 | 0.19 | |
| Coconut | 1,789.5 | −0.35 | 0.42 | −0.33 | 0.43 | −0.57 | 0.23 | |
| Livestock | 4,473.5 | −0.24 | 0.27 | −0.29 | 0.22 | 0.1 | 0.55 | |
| Fishing | 3,996.8 | −0.17 | 0.23 | −0.19 | 0.2 | −0.13 | 0.27 | |
| Other agriculture | 1,845.8 | −0.22 | 0.09 | −0.31 | 0.01 | −0.62 | −0.25 | |
| Logging & timber | 856.5 | 0.19 | 0.82 | 0.07 | 0.71 | 0.14 | 0.77 | |
| Mining | 1,604.3 | 0.01 | 0.91 | −0.18 | 0.74 | −1.23 | −0.14 | |
| Manufacturing | 13,112.5 | −0.16 | 0.9 | −0.14 | 0.91 | −0.82 | 0.34 | |
| Rice manufacturing | 2,022.9 | −0.17 | 0.27 | −0.13 | 0.3 | −0.07 | 0.36 | |
| Meat industry | 2,081.2 | −0.12 | 0.55 | −0.19 | 0.48 | 0.25 | 0.87 | |
| Food manufacturing | 3,696.2 | −0.54 | 0.06 | −0.49 | 0.1 | −0.36 | 0.21 | |
| Electricity, gas & water | 2,341.3 | 0.06 | 0.85 | 0.1 | 0.88 | 0.15 | 0.93 | |
| Construction | 6,848.2 | 1.01 | 1.81 | 0.93 | 1.74 | 1.56 | 2.27 | |
| Commerce | 15,149.5 | −0.18 | 0.66 | −0.17 | 0.67 | −0.54 | 0.36 | |
| Trans. & comm. | 5,206.4 | 0.07 | 0.79 | −0.12 | 0.62 | 0.22 | 0.91 | |
| Finance | 3,580.5 | 0.13 | 0.7 | 0.2 | 0.76 | −0.02 | 0.57 | |
| Real estate | 7,314.2 | −0.2 | 0.48 | −0.55 | 0.16 | 0.14 | 0.76 | |
| Services | 6,960 | −0.12 | 0.72 | 0.11 | 0.91 | −0.09 | 0.75 | |
| Public services | 12,222.8 | 1.86 | 1.87 | 2.2 | 2.15 | 2.33 | 2.26 | |
-
Source: Values computed by the author.
Download links
A two-part list of links to download the article, or parts of the article, in various formats.