Case study: A gender-focused macro-micro analysis of the poverty impacts of trade liberalization in south africa
- University of Pretoria, South Africa
- Université Laval, Canada
- Research and Policy Director, Financial and Fiscal Commission, South Africa
Cite this article
as: M. Chitiga, J. Cockburn, B. Decaluwé, I. Fofana, R. Mabugu; 2010; Case study: A gender-focused macro-micro analysis of the poverty impacts of trade liberalization in south africa; International Journal of Microsimulation; 3(1); 104-108.
doi: 10.34196/ijm.00028
- Article
- Figures and data
- Jump to
Figures
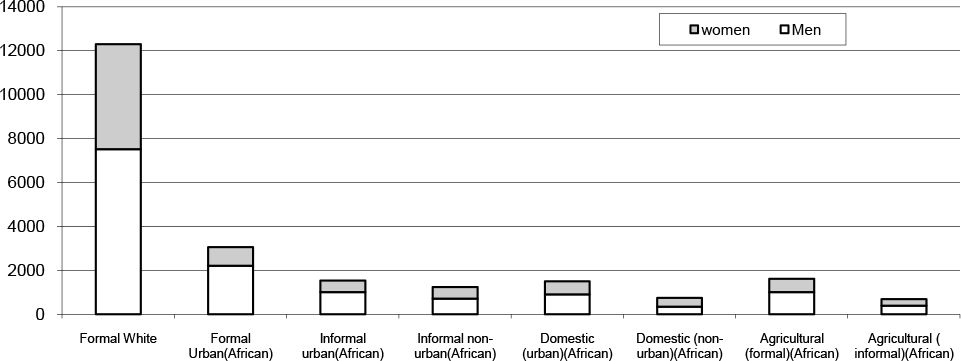
Figure 1

Mean monthly income by gender (1999).
Source: Statistics South Africa (1999).
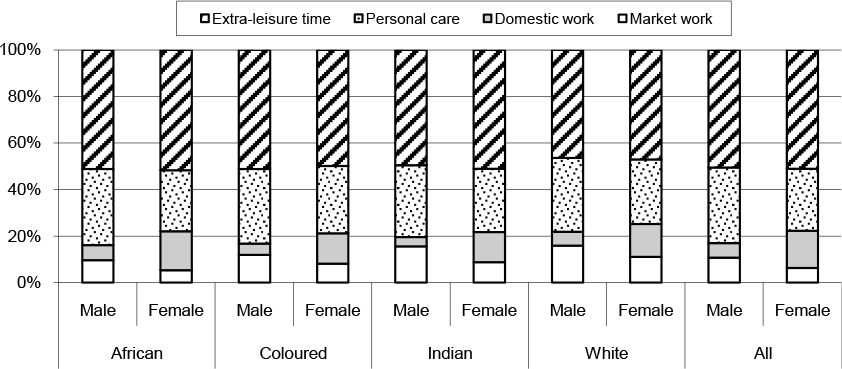
Figure 2

Household and gender time allocation.
Source: Statistics South Africa (2001a).
Tables
Table 1
Household income and expenditure effects (in percent).
| South Africa | Residential area | Head of household | Population group | |||||||
|---|---|---|---|---|---|---|---|---|---|---|
| Urban | Rural | Male head | Female head | Black | Colored | Asian | White | Unspecified | ||
| All incomes | 0.04 | 0.09 | −0.27 | 0.06 | −0.04 | 0.04 | 0.05 | 0.16 | 0.00 | 0.46 |
| Income taxes | −0.21 | −0.21 | −0.16 | −0.23 | 0.00 | 0.04 | 0.08 | 0.05 | −0.29 | 0.12 |
| Transfers out | 0.00 | 0.00 | 0.00 | 0.00 | 0.00 | 0.00 | 0.00 | 0.00 | 0.00 | 0.00 |
| Savings | 0.22 | 0.44 | −1.22 | 0.40 | −0.10 | 0.07 | 0.02 | 0.23 | 2.67 | 1.68 |
| Consumption | 0.05 | 0.09 | −0.13 | 0.07 | −0.02 | 0.04 | 0.07 | 0.12 | 0.05 | 0.05 |
| Consumer price index | 0.92 | 0.89 | 1.05 | 0.90 | 0.99 | 0.86 | 0.79 | 1.19 | 0.99 | 0.72 |
| EV/Initial income | −0.23 | −0.21 | −0.35 | −0.24 | −0.15 | −0.17 | −0.11 | −0.17 | −0.31 | −0.33 |
Table 2
Poverty and inequality indexes (in percent).
| Initial values | Variation | |||||||
|---|---|---|---|---|---|---|---|---|
| P0 | P1 | P2 | Theil index | P0 | P1 | P2 | Theil index | |
| South Africa | 53.0 | 25.3 | 15.0 | 1.6 | 0.29 | 0.26 | 0.20 | 0.06 |
| Residential area | ||||||||
| Urban | 42.4 | 18.4 | 10.2 | 1.6 | 0.23 | 0.21 | 0.14 | −0.01 |
| Rural | 68.3 | 35.4 | 22.1 | 1.0 | 0.37 | 0.34 | 0.27 | 0.07 |
| Head of household | ||||||||
| Male | 43.6 | 19.5 | 11.1 | 1.6 | 0.19 | 0.22 | 0.15 | 0.03 |
| Female | 65.8 | 33.4 | 20.5 | 0.8 | 0.43 | 0.32 | 0.26 | 0.03 |
| Population group | ||||||||
| Black household | 61.0 | 29.5 | 17.6 | 1.1 | 0.31 | 0.30 | 0.23 | 0.07 |
| Colored household | 36.2 | 14.7 | 7.8 | 0.8 | 0.45 | 0.19 | 0.12 | 0.01 |
| Asian household | 6.4 | 2.3 | 0.8 | 0.3 | 0.00 | 0.04 | 0.03 | 0.01 |
| White household | 0.1 | 0.0 | 0.0 | 1.0 | 0.00 | 0.00 | 0.00 | 0.06 |
| Unspecified household | 11.4 | 3.1 | 0.8 | 1.7 | 0.00 | 0.08 | 0.04 | −0.06 |
Table 3
Poverty indexes by gender and age.
| Category | Men | Women | Children | ||||||
|---|---|---|---|---|---|---|---|---|---|
| P0 | P1 | P2 | P0 | P1 | P2 | P0 | P1 | P2 | |
| Base Year Values (in percent) | |||||||||
| South Africa | 43.8 | 19.9 | 11.5 | 50.8 | 23.9 | 14.0 | 62.7 | 31.2 | 19.0 |
| Urban area | 35.1 | 14.9 | 8.1 | 41.6 | 18.1 | 10.0 | 51.7 | 22.8 | 12.8 |
| Rural area | 61.5 | 30.2 | 18.5 | 65.9 | 33.4 | 20.5 | 73.7 | 39.7 | 25.4 |
| Male-headed | 36.6 | 15.6 | 8.7 | 41.9 | 18.7 | 10.6 | 53.6 | 24.9 | 14.6 |
| Female-headed | 66.0 | 33.2 | 20.3 | 59.4 | 28.9 | 17.3 | 72.6 | 38.1 | 23.9 |
| Black | 51.8 | 23.8 | 13.9 | 60.1 | 28.5 | 16.8 | 68.9 | 34.7 | 21.3 |
| Colored | 30.8 | 11.9 | 6.1 | 34.6 | 14.3 | 7.7 | 43.0 | 17.6 | 9.3 |
| Asian | 5.5 | 2.0 | 0.8 | 2.9 | 1.0 | 0.3 | 12.3 | 4.3 | 1.6 |
| White | 0.0 | 0.0 | 0.0 | 0.2 | 0.1 | 0.1 | 0.0 | 0.0 | 0.0 |
| Unspecified | 0.0 | 0.0 | 0.0 | 7.9 | 2.1 | 0.6 | 21.8 | 5.8 | 1.6 |
| Variations after simulation (in percent) | |||||||||
| South Africa | 0.22 | 0.22 | 0.16 | 0.31 | 0.26 | 0.19 | 0.32 | 0.30 | 0.23 |
| Urban area | 0.26 | 0.17 | 0.11 | 0.26 | 0.21 | 0.15 | 0.15 | 0.25 | 0.17 |
| Rural area | 0.13 | 0.32 | 0.24 | 0.39 | 0.34 | 0.27 | 0.50 | 0.35 | 0.29 |
| Male-headed | 0.19 | 0.19 | 0.13 | 0.23 | 0.21 | 0.15 | 0.14 | 0.26 | 0.19 |
| Female-headed | 0.30 | 0.31 | 0.25 | 0.38 | 0.31 | 0.23 | 0.53 | 0.35 | 0.28 |
| Black | 0.23 | 0.26 | 0.19 | 0.35 | 0.31 | 0.23 | 0.33 | 0.33 | 0.26 |
| Colored | 0.42 | 0.17 | 0.10 | 0.37 | 0.18 | 0.12 | 0.55 | 0.22 | 0.15 |
| Asian | 0.00 | 0.03 | 0.02 | 0.00 | 0.02 | 0.01 | 0.00 | 0.07 | 0.05 |
| White | 0.00 | 0.00 | 0.00 | 0.00 | 0.00 | 0.00 | 0.00 | 0.00 | 0.00 |
| Unspecified | 0.00 | 0.00 | 0.00 | 0.00 | 0.05 | 0.03 | 0.00 | 0.15 | 0.08 |
Download links
A two-part list of links to download the article, or parts of the article, in various formats.