Taxation of closely held corporations – efficiency aspects
- Confederation of Swedish Enterprise, Sweden
Cite this article
as: P. Ericson, J. Fall; 2011; Taxation of closely held corporations – efficiency aspects; International Journal of Microsimulation; 4(2); 27-40.
doi: 10.34196/ijm.00051
- Article
- Figures and data
- Jump to
Figures
Figure 1
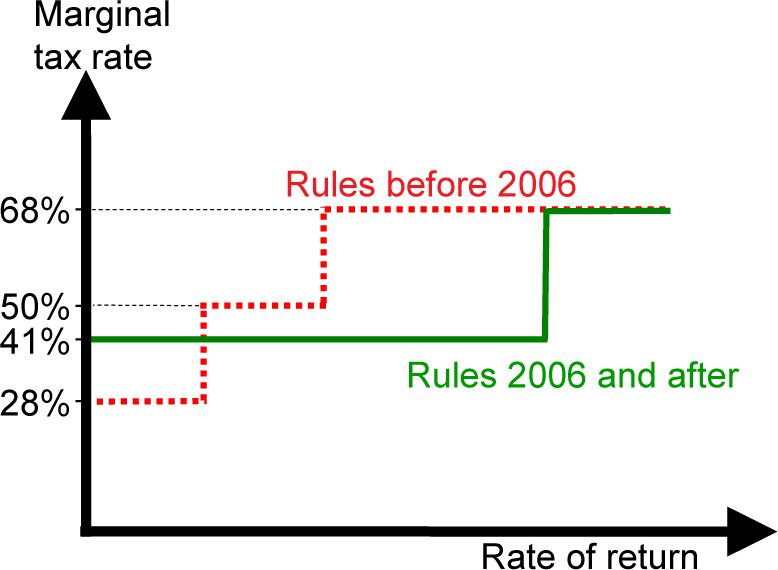
Schematic illustration of old and new rules in Sweden Marginal tax rate.
Figure 2
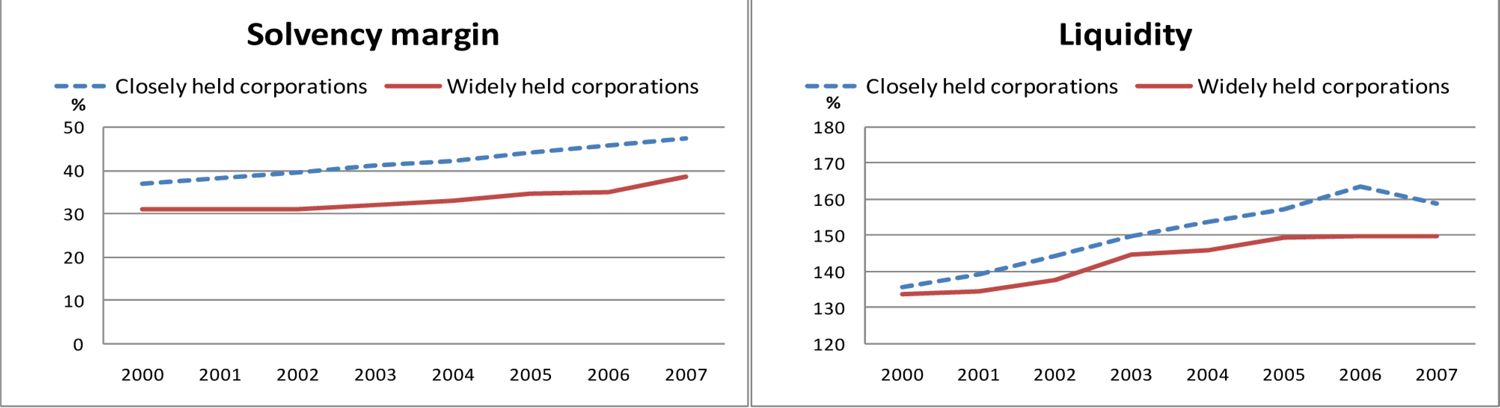
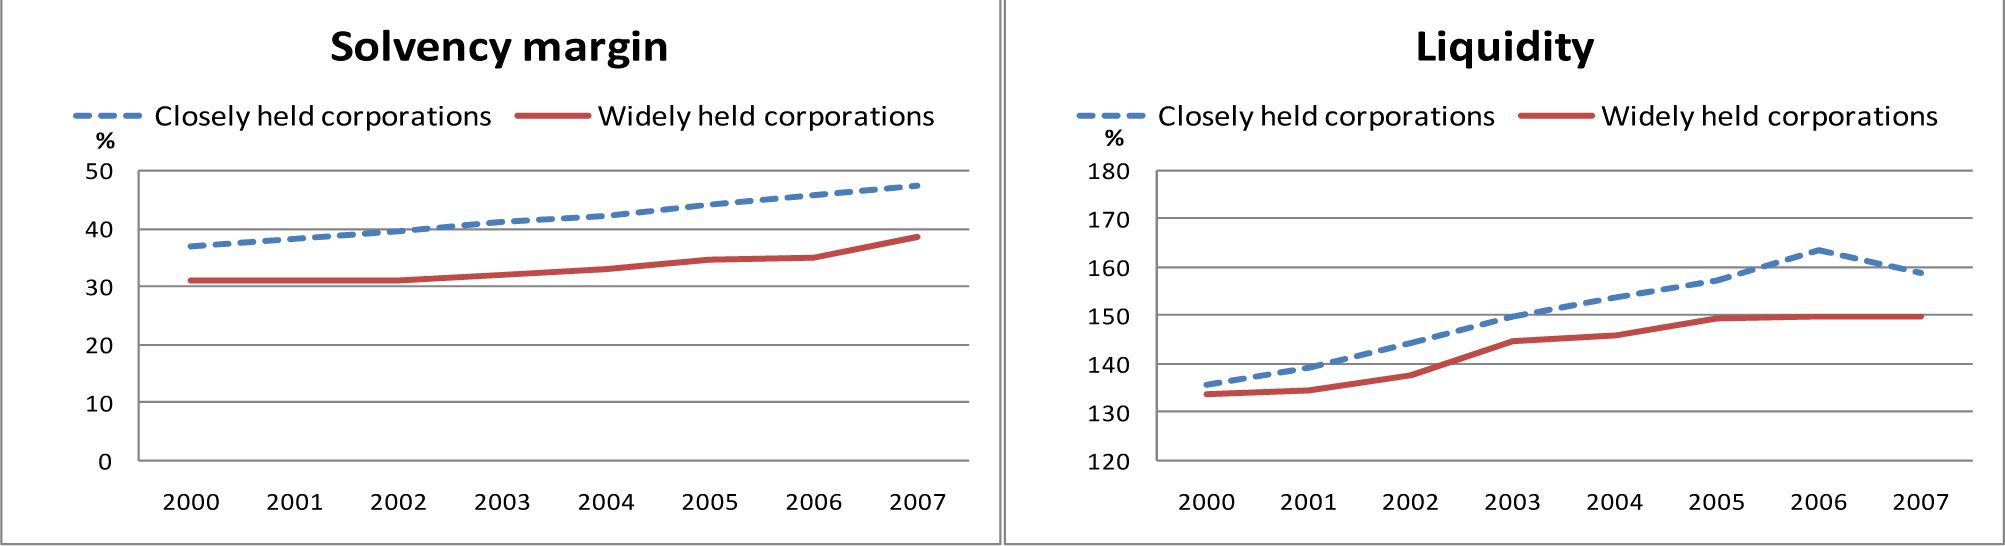
Solvency margin and liquidity in CHC’s and WHC’s.
Figure 3
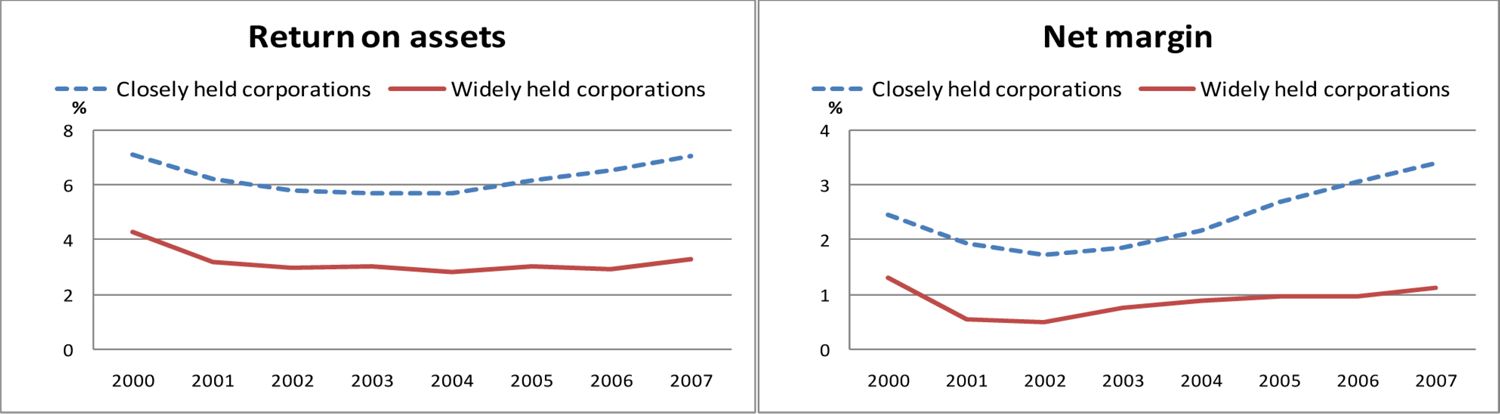
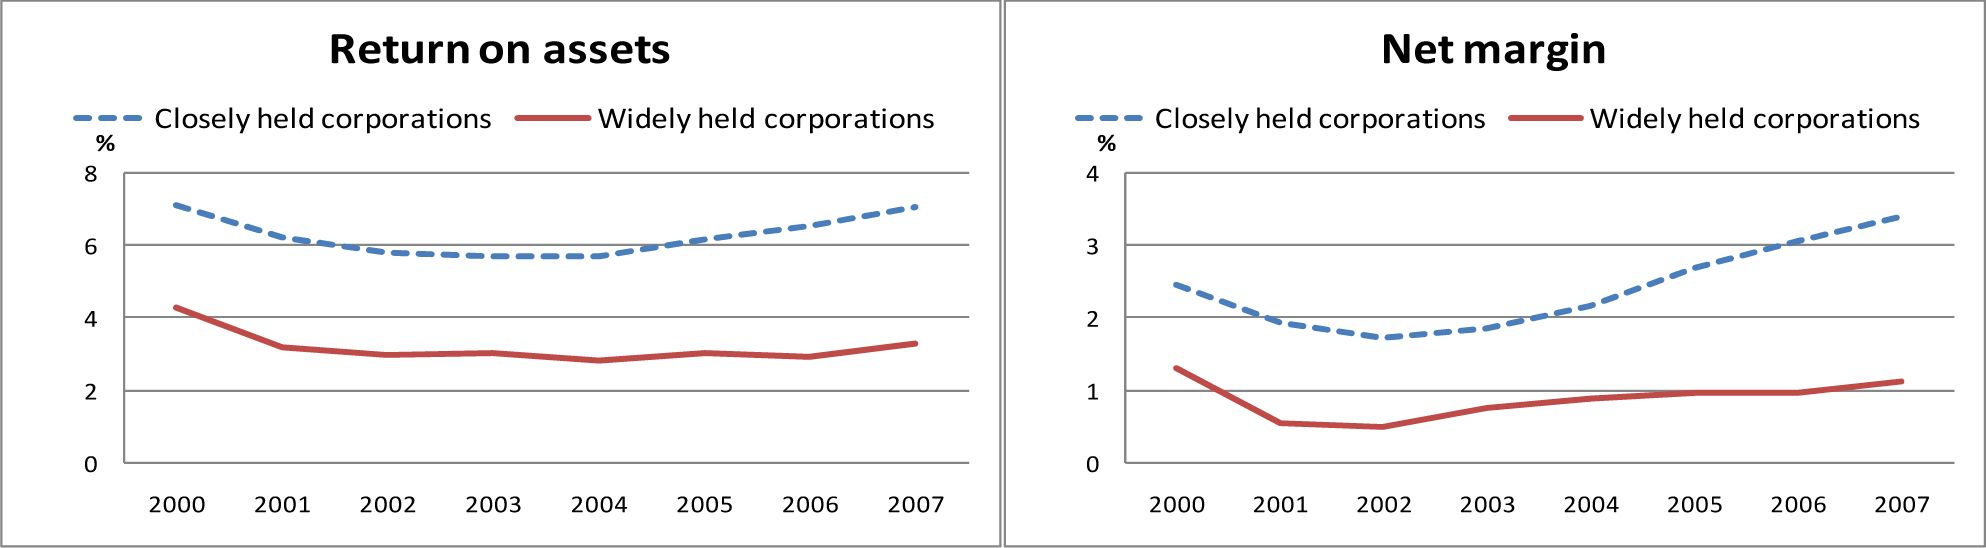
Profitability in CHC’s and WHC’s.
Figure 4

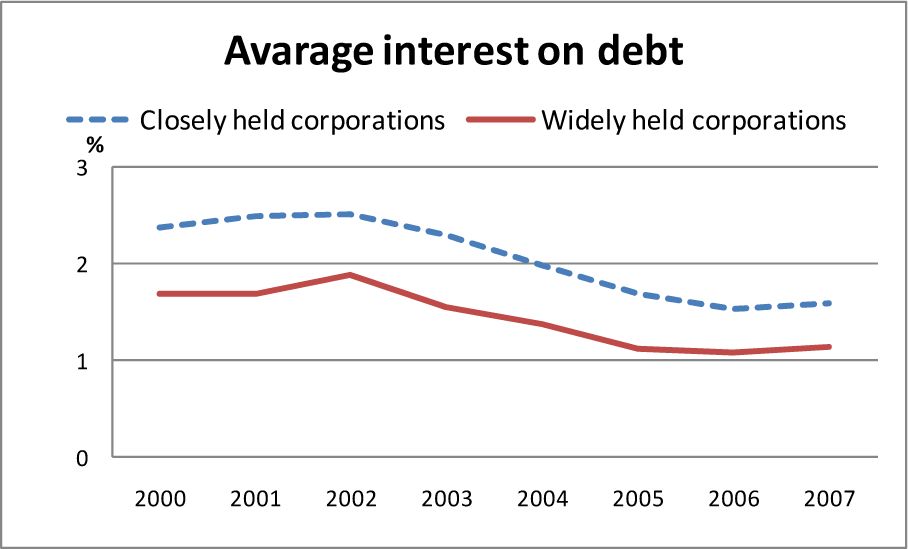
Average interest on debt.
Figure 5
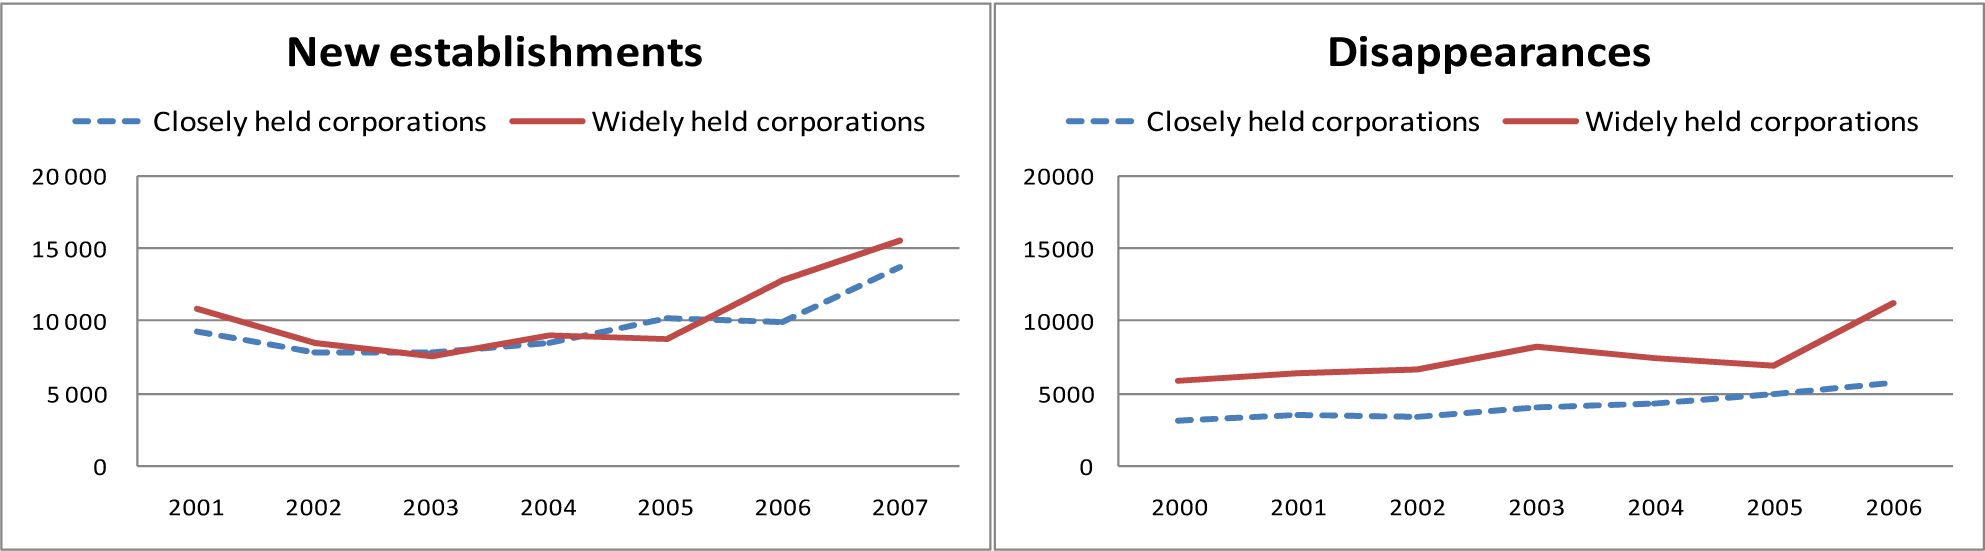
Establishments and disappearances.
Figure 6
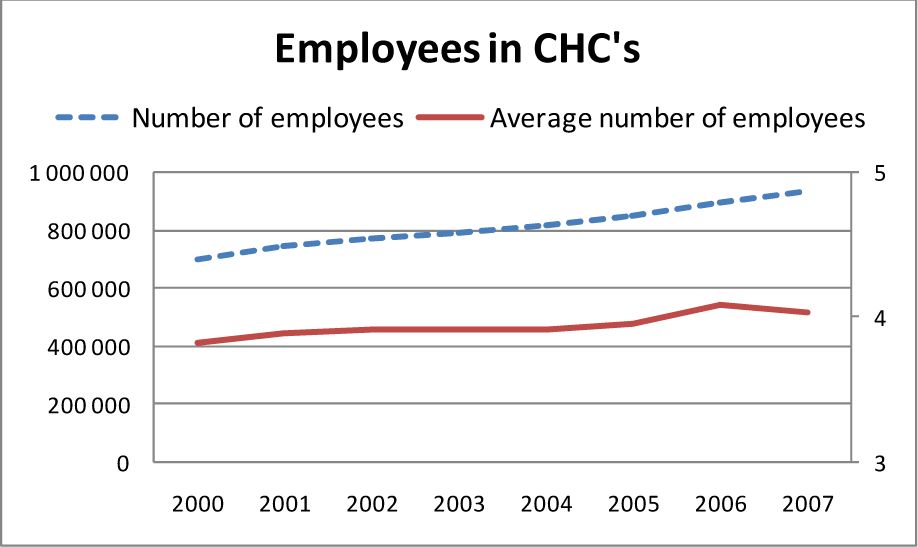
Employees.
Figure 7

Owners background.
Figure 8
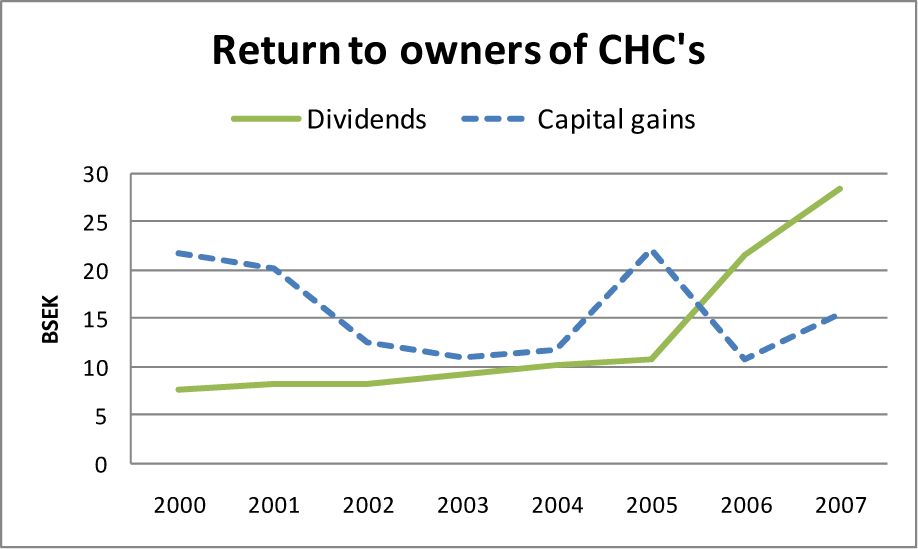
Dividends and capital gains.
Figure 9
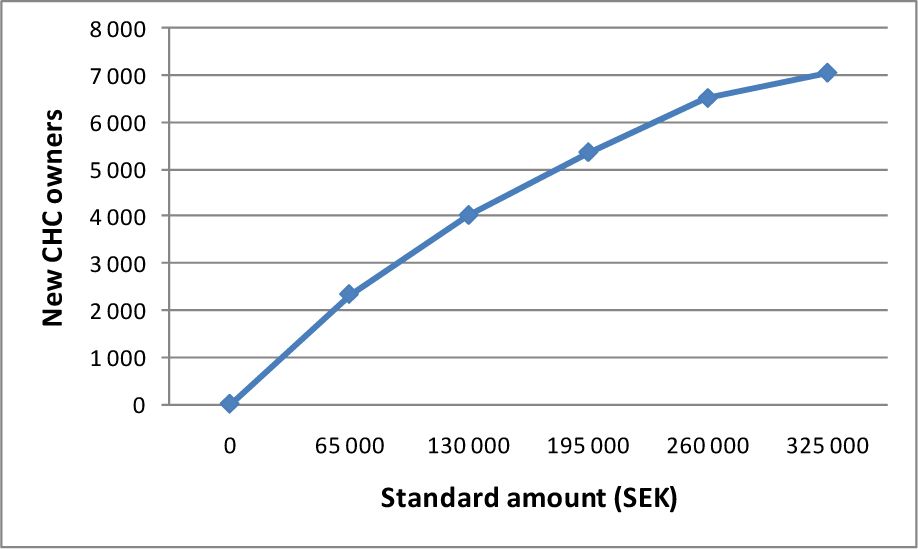
Increasing standard amount and number of new CHC owners.
Figure 10
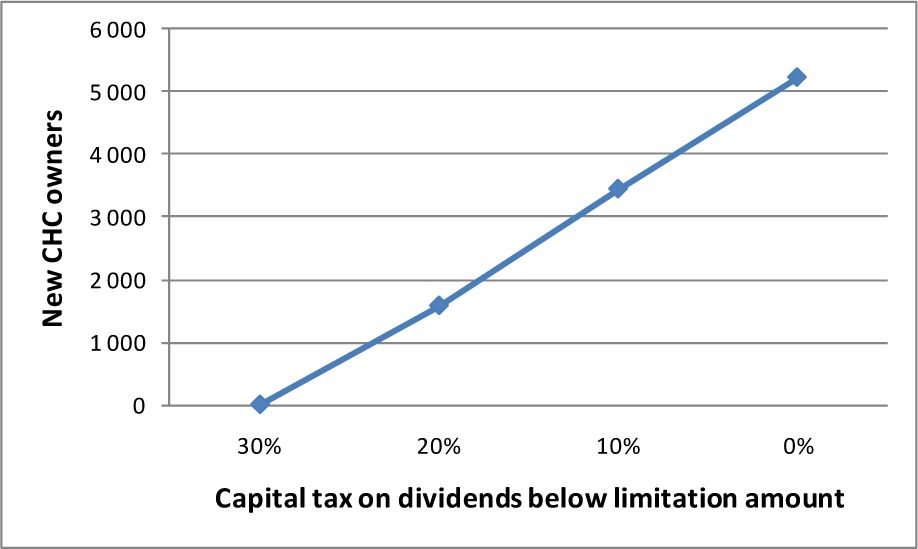
Decreasing capital tax and number of new CHC owners.
Figure 11
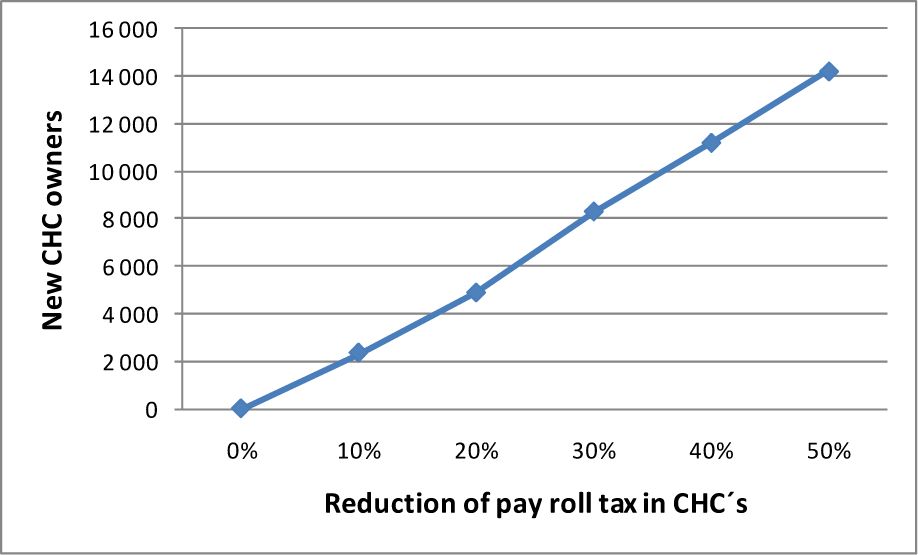
Reduction of pay roll tax and number of new CHC owners.
Tables
Table 1
Average tax _ rates and size of alternative forms of organisations in SWEDEN 2005.
| Sole propriatorship | CHC | WHC privat | WHC public | |||||
|---|---|---|---|---|---|---|---|---|
| Distribution of wages and dividens | Distribution of dividends | Distribution of wages and dividens | Distribution of dividends | |||||
| Number of firms | 735,917 | 190,981 | 96,638 | 339 | ||||
| AETR (%) | 55.4 | 31.8 | 24.3 | 27.3 | 27.6 | 32 | ||
| RAETR(%) | 60.1 | 34.5 | 26.3 | 29.6 | 30 | 34.7 | ||
| Turnover (MSEK) | 181,602 | 1,143,356 | 4,218,370 | 158,377 | ||||
| Wage bill (MSEK) | 8,381 | 180,418 | 448,064 | 16,663 | ||||
| Number of employees | 49,017 | 692,719 | 1,491,231 | 79,725 | ||||
-
Source: Sørensen (2008)
Table 2
Number of observations.
| Year | Closely held corporations | Widely held corporations |
|---|---|---|
| 2001 | 167,069 | 42,526 |
| 2002 | 171,550 | 38,718 |
| 2003 | 173,980 | 37,329 |
| 2004 | 179,884 | 35,976 |
| 2005 | 185,568 | 35,061 |
| 2006 | 189,178 | 37,395 |
| 2007 | 190,097 | 40,748 |
Table 3
Statistics on variables in a model aiming to explain the probability of becoming a CHC owner.
| Variable | |
|---|---|
| New CHC owner in 2006 (dependent variable) | 0.9% |
| Sole propriator/partnership last year | 7.9% |
| Avarage difference in disposable income (TSEK/YEAR) | 5.0 |
| Woman | 50.2% |
| Age < 30 | 9.3% |
| Single | 22.4% |
| Born in Sweden | 86.9% |
| Living in a large city | 34.4% |
| University degree | 19.8% |
Table 4
Probit estimates of the probability to become a CHC owner.
| Parameter | Estimate | P-value |
|---|---|---|
| Inte rcept | −2.5002 | <.0001 |
| Sole propriator/partnership last year | 0.3729 | <.0001 |
| Difference in disposable income | 0.00538 | <.0001 |
| Woman | −0.2528 | <.0001 |
| Age < 30 | −0.1446 | <.0001 |
| Single | −0.1535 | <.0001 |
| Born in Sweden | 0.179 | <.0001 |
| Living in a large city | 0.1476 | <.0001 |
| Unive rsity degree | −0.0512 | 0.0095 |
| Discriminatory power | 0.35 | Somers’ D |
Table 5
Disposable income elasticities to become a CHC owner.
| Hourly wage rate (decile) | Average hourly wage rate (SEK) | Elasticity |
|---|---|---|
| All | 156 | 0.07 |
| 1 | 95 | 0.01 |
| 2 | 111 | 0.01 |
| 3 | 120 | 0.01 |
| 4 | 127 | 0.01 |
| 5 | 135 | 0.02 |
| 6 | 144 | 0.03 |
| 7 | 156 | 0.06 |
| 8 | 172 | 0.11 |
| 9 | 200 | 0.17 |
| 10 | 301 | 0.24 |
Download links
A two-part list of links to download the article, or parts of the article, in various formats.