A care time benefit as a timely alternative for the non-working spouse compensation in the Belgian tax system
- University of Antwerp, Belgium
- Article
- Figures and data
- Jump to
Figures

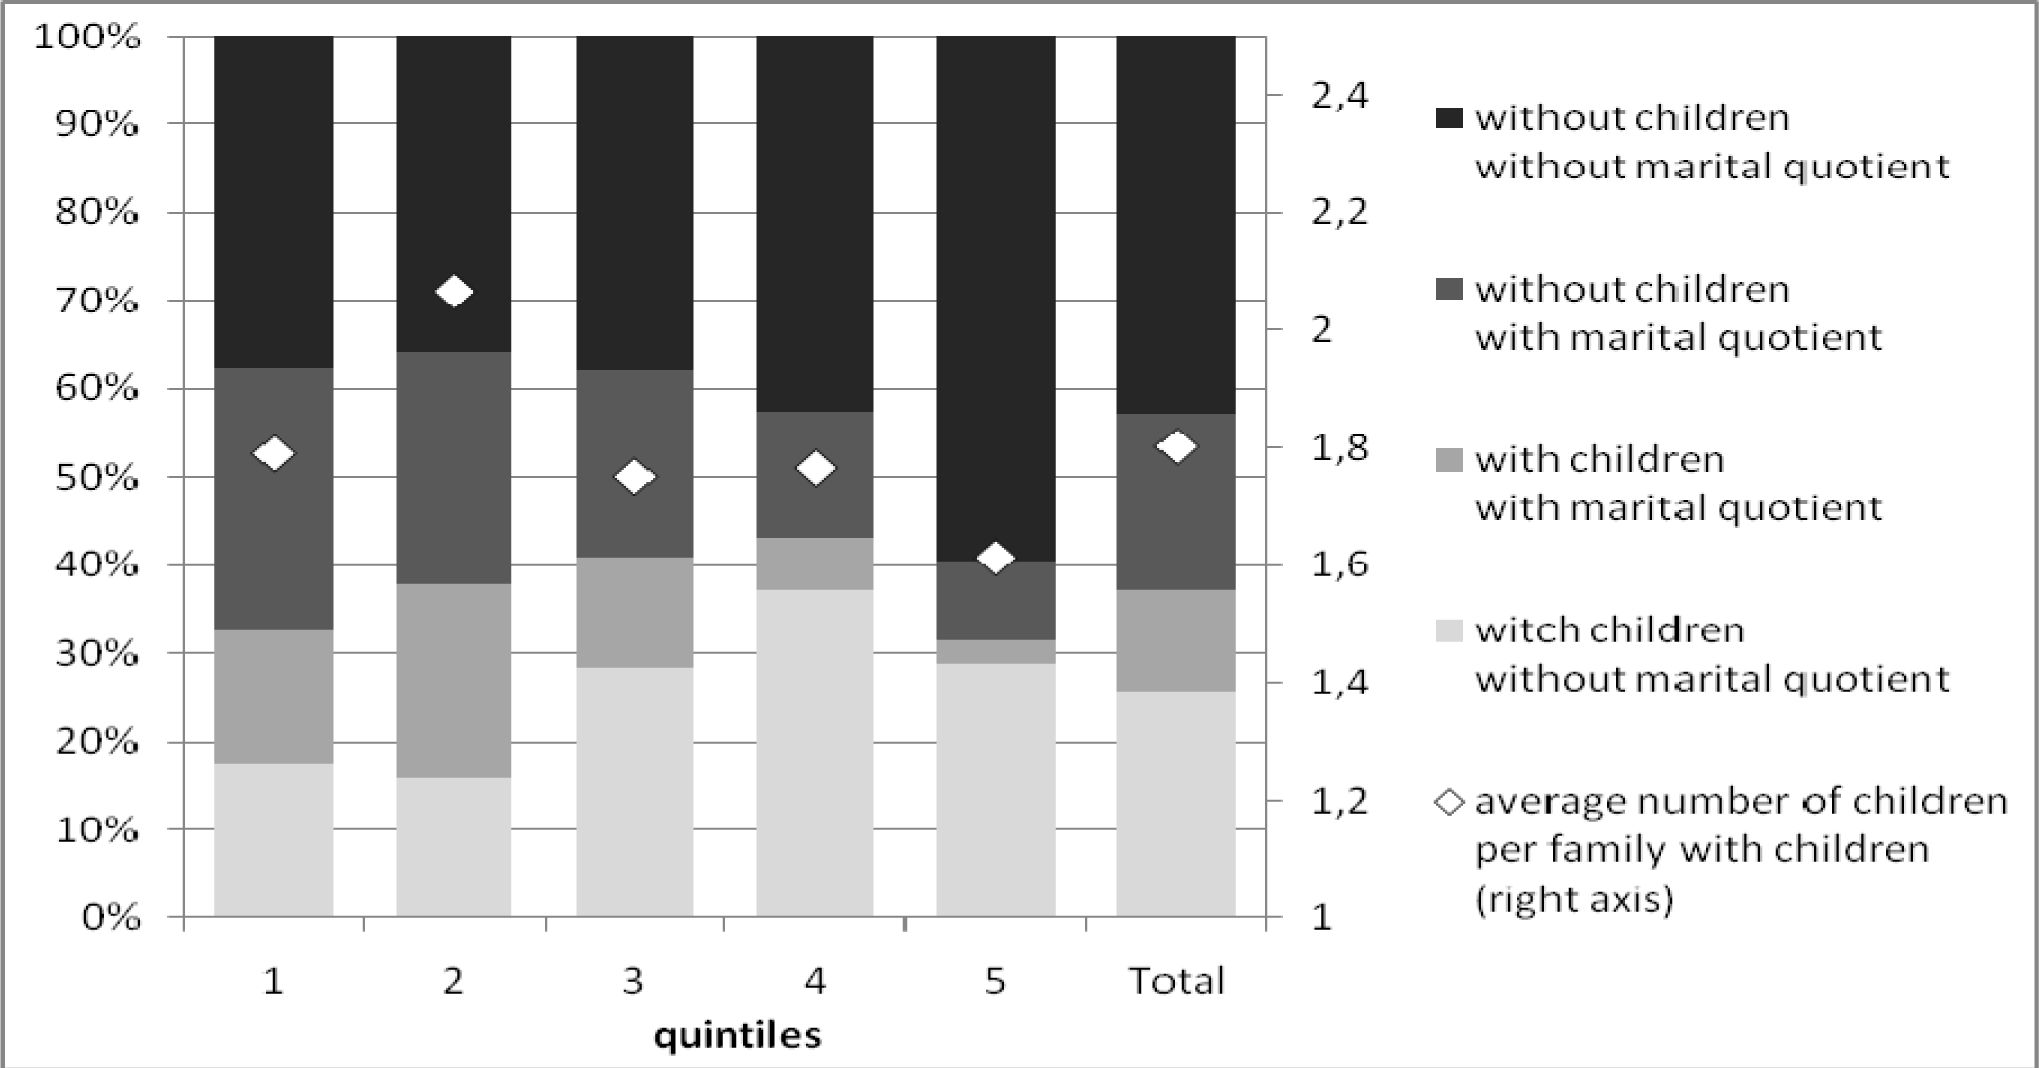
Distribution of household types and average number of children over the income distribution.
Tables
The distribution of paid employment among fathers in dual-earner families, hours per week.
| N(observations) | 574 |
|---|---|
| Mean | 43h11’ |
| Percentiles | |
| 10 | 25.0 hours |
| 25 | 38.0 hours |
| 50 | 42.5 hours |
| 75 | 51.0 hours |
| 90 | 60.0 hours |
| 95 | 68.0 hours |
-
Source: FFCS (2004–2005).
-
Note: the original measurement is in half hour units.
Time spent at schoo1 according to the age of the child, hours per week.
| Age | Median | Mean | S.E. | Minimum | Maximum | N | Proposal |
|---|---|---|---|---|---|---|---|
| 0 | 0.00 | 0.00 | 0.00 | 0.00 | 0.00 | 45 | 0 |
| 1 | 0.00 | 0.23 | 0.17 | 0.00 | 9.75 | 69 | 0 |
| 2 | 0.00 | 6.52 | 1.48 | 0.00 | 43.42 | 60 | 0 |
| 3 | 24.96 | 22.49 | 1.63 | 0.00 | 40.00 | 46 | 25 |
| 4 | 28.43 | 27.25 | 1.30 | 0.00 | 49.75 | 46 | 28 |
| 5 | 31.50 | 29.66 | 1.05 | 0.00 | 46.50 | 61 | 30 |
| 6 | 30.42 | 28.57 | 1.23 | 0.00 | 43.00 | 40 | 30 |
| 7 | 29.49 | 27.06 | 1.16 | 0.00 | 43.17 | 62 | 30 |
| 8 | 33.36 | 34.99 | 1.92 | 13.50 | 103.50 | 58 | 30 |
| 9 | 29.00 | 25.92 | 1.03 | 0.00 | 39.75 | 73 | 30 |
| 10 | 26.75 | 22.60 | 1.66 | 0.00 | 40.50 | 49 | 30 |
| 11 | 30.55 | 27.68 | 1.21 | 0.00 | 41.67 | 66 | 31 |
| 12 | 30.75 | 27.01 | 1.62 | 0.00 | 43.17 | 55 | 31 |
| 13 | 35.50 | 32.12 | 1.46 | 0.00 | 52.75 | 69 | 32 |
| 14 | 26.00 | 25.02 | 1.83 | 0.00 | 45.75 | 51 | 32 |
| 15 | 33.50 | 27.88 | 1.63 | 0.00 | 53.00 | 74 | 32 |
-
Source: FFCS (2004–2005).
-
Note: the original measurement is in half hour units.
Socially grounded number of child care hours (CCH) per household in an average month, according to the age of the youngest child and the number of children in the household.
| age youngestchild | number of children < 13 | 1 | 2 | 3 | 4+ | Total |
|---|---|---|---|---|---|---|
| < 3 | Proportion with children under 13 | 14% | 14% | 5% | 2% | 36% |
| CCH, based on 42.5 hours workweek | 180 | 301 | 375 | 534 | 275 | |
| >= 3 | Proportion with children under 13 | 37% | 22% | 4% | 1% | 64% |
| CCH, based on 42.5 hours workweek | 89 | 179 | 256 | 379 | 136 | |
| Total | Proportion with children under 13 | 51% | 36% | 10% | 3% | 100% |
| CCH, based on 42.5 hours workweek | 114 | 226 | 322 | 476 | 185 |
-
Source: own calculations on the basis of SILC 2004.
Average equivalent household income per individual in the baseline and the alternative scenario for various age groups and family types.
| Categories | Baseline | Alternative | ||
|---|---|---|---|---|
| Amount | Amount | % increase | ||
| Overall | 16,336 | 16,402 | 0.41% | |
| Age groups | Children (0–17) | 15,765 | 16,340 | 3.64% |
| 0–3 | 16,379 | 17,490 | 6.78% | |
| 4–12 | 16,125 | 16,848 | 4.49% | |
| 13–17 | 14,695 | 14,647 | -0.32% | |
| Adults (18–64) | 17,311 | 17,304 | -0.04% | |
| Elderly (65 + ) | 13,257 | 12,904 | -2.66% | |
| Family types | With children and no MQ | 17,616 | 18,503 | 5.04% |
| With children and with MQ | 13,343 | 13,563 | 1.65% | |
| No childrenand no MQ | 17,526 | 17,495 | -0.18% | |
| No children and with MQ | 13,918 | 13,057 | -6.18% | |
-
Source: MISIM.
Change of disposable equivalent income, split for tax increase and equivalent Euro and in percentage of baseline disposable equivalent income.
| quintiles | disposable equivalent income | net change | tax increase | parental subsidy | ||||
|---|---|---|---|---|---|---|---|---|
| baseline | alternative | Δ | % | Δ | % | Δ | % | |
| 1 | 8,156 | 8,210 | 54 | 1.03 | 271 | 2.88 | 337 | 4.35 |
| 2 | 12,374 | 12,313 | -61 | -0.52 | 434 | 3.54 | 386 | 3.12 |
| 3 | 15,392 | 15,427 | 36 | 0.18 | 357 | 2.36 | 393 | 2.54 |
| 4 | 18,933 | 19,099 | 166 | 0.88 | 257 | 1.36 | 423 | 2.24 |
| 5 | 26,827 | 26,963 | 116 | 0.46 | 185 | 0.72 | 301 | 1.18 |
| Total | 16,336 | 16,402 | 62 | 0.41 | 301 | 2.17 | 368 | 2.69 |
-
Source: MISIM.
Gainers and losers, average gain per gainer and average loss per loser, in equivalent Euros and in percentage of baseline disposable equivalent income.
| quintiles | % gainers | % losers | % unaffected | average gain/gainer in disp. eq. inc. | average loss / loser in disp. eq. inc. | ||
|---|---|---|---|---|---|---|---|
| Δ | % | Δ | % | ||||
| 1 | 26.20 | 31.97 | 41.84 | 910 | 11.51 | -577 | -6.22 |
| 2 | 29.62 | 41.87 | 28.52 | 823 | 6.64 | -727 | -5.93 |
| 3 | 35.55 | 41.12 | 23.33 | 809 | 5.21 | -612 | -4.06 |
| 4 | 40.31 | 33.33 | 26.36 | 870 | 4.62 | -555 | -2.95 |
| 5 | 30.13 | 24.70 | 45.17 | 823 | 3.24 | -535 | -2.09 |
| Total | 32.36 | 34.60 | 33.04 | 847 | 6.24 | -601 | -4.25 |
-
Source: MISIM.
Gainers and losers, average gain per gainer and average loss per loser, in equivalent Euros and in percentage of disposable equivalent income, for the 4 family types.
| quintile s | With children and no MQ | With children and with MQ | No children and no MQ | No children and with MQ | ||||||||
|---|---|---|---|---|---|---|---|---|---|---|---|---|
| % gainer % losers % unaffected |
average gain/gainer or loss/loser | % gainer % losers % unaffected |
average gain/gainer or loss/loser | % gainer % losers % unaffected |
average gain/gainer or loss/loser | % gainer % losers % unaffected |
average gain/gainer or loss/loser | |||||
| Δ | % | Δ | % | Δ | % | Δ | % | |||||
| 1 | 97% | 1064 | 13.32 | 59% | 639 | 8.32 | 0% | 0 | 0.00 | 0% | 0 | 0.00 |
| 0% | 0 | 0.00 | 39% | -394 | -4.50 | 13% | -171 | -2.08 | 72% | -721 | -7.65 | |
| 2 | 3% | 0 | 0.00 | 2% | 0 | 0.00 | 87% | 0 | 0.00 | 28% | 0 | 0.00 |
| 97% | 890 | 7.19 | 65% | 749 | 6.04 | 0% | 0 | 0.00 | 0% | 0 | 0.00 | |
| 0% | 0 | 0.00 | 34% | -427 | -3.45 | 27% | -155 | -1.24 | 95% | -1033 | -8.45 | |
| 3 | 3% | 0 | 0.00 | 1% | 0 | 0.00 | 73% | 0 | 0.00 | 5% | 0 | 0.00 |
| 100% | 866 | 5.55 | 55% | 585 | 3.86 | 0% | 0 | 0.00 | 0% | 0 | 0.00 | |
| 0% | 0 | 0.00 | 45% | -536 | -3.62 | 39% | -126 | -0.82 | 99% | -977 | -6.47 | |
| 4 | 0% | 0 | 0.00 | 0% | 0 | 0.00 | 61% | 0 | 0.00 | 1% | 0 | 0.00 |
| 100% | 898 | 4.77 | 54% | 562 | 2.96 | 0% | 0 | 0.00 | 0% | 0 | 0.00 | |
| 0% | 0 | 0.00 | 46% | -562 | -2.92 | 39% | -133 | -0.70 | 98% | -1054 | -5.61 | |
| 5 | 0% | 0 | 0.00 | 0% | 0 | 0.00 | 61% | 0 | 0.00 | 2% | 0 | 0.00 |
| 100% | 831 | 3.28 | 44% | 600 | 2.07 | 0% | 0 | 0.00 | 0% | 0 | 0.00 | |
| 0% | 0 | 0.00 | 56% | -561 | -2.11 | 24% | -114 | -0.47 | 100% | -1,193 | -4.65 | |
| 0% | 0 | 0.00 | 0% | 0 | 0.00 | 76% | 0 | 0.00 | 0% | 0 | 0.00 | |
-
Source: MISIM.
Average net change in yearly disposable equivalent income and in percentage of baseline disposable equivalent income for various age groups.
| quintiles | 0 to 12 | 13 to 18 | 19 to 34 | 35 to 49 | 50 to 64 | 65 to 74 | 75+ | Total |
|---|---|---|---|---|---|---|---|---|
| 1 | 849 | -80 | 211 | -2 | -211 | -259 | -207 | 54 |
| 10.61 | -0.62 | 2.79 | 0.37 | -2.25 | -2.54 | -2.09 | 1.03 | |
| 2 | 750 | -1 38 | 1 39 | -33 | -469 | -500 | -355 | -61 |
| 6.05 | -1.13 | 1.11 | -0.30 | -3.83 | -4.07 | -2.92 | -0.52 | |
| 3 | 788 | -1 1 1 | 1 50 | 46 | -424 | -443 | -454 | 36 |
| 5.06 | -0.76 | 0.92 | 0.25 | -2.81 | -2.89 | -3.00 | 0.18 | |
| 4 | 880 | 76 | 196 | 204 | -437 | -324 | -377 | 1 66 |
| 4.69 | 0.44 | 1.02 | 1.10 | -2.32 | -1.75 | -2.02 | 0.88 | |
| 5 | 860 | 85 | 82 | 1 86 | -280 | -303 | -265 | 116 |
| 3.38 | 0.35 | 0.34 | 0.70 | -1.06 | -1.24 | -1.10 | 0.46 | |
| Total | 824 | -55 | 151 | 96 | -358 | -378 | -319 | 62 |
| 5.90 | -0.48 | 1.12 | 0.48 | -2.37 | -2.90 | -2.45 | 0.41 |
-
Source: MISIM.
Poverty rates with confidence intervals (*) by age group.
| Baseline | Alternative | ||||||||
|---|---|---|---|---|---|---|---|---|---|
| Categories | Population share | Poverty Rate | S.E. | C.I. (95%) | Poverty Rate | S.E. | C.I. (95%) | ||
| Overall | 100% | 11.71 | 0.68 | 10.37 | 13.05 | 12.19 | 0.65 | 10.90 | 13.47 |
| Children (0–17) | 22% | 10.08 | 1.05 | 8.01 | 12.16 | 8.60 | 0.94 | 6.75 | 10.45 |
| 0-3 | 4% | 12.22 | 1.90 | 8.47 | 15.97 | 7.10 | 1.49 | 4.16 | 10.03 |
| 4–12 | 12% | 7.99 | 0.96 | 6.10 | 9.88 | 5.97 | 0.80 | 4.40 | 7.54 |
| 13–17 | 6% | 12.66 | 1.74 | 9.24 | 16.08 | 14.50 | 1.80 | 10.96 | 18.05 |
| Adults (18–64) | 62% | 10.22 | 0.70 | 8.85 | 11.59 | 10.79 | 0.69 | 9.43 | 12.16 |
| Elderly (65+) | 16% | 19.94 | 1.27 | 17.43 | 22.45 | 22.74 | 1.38 | 20.02 | 25.47 |
-
Source: MISIM.
(*) Confidence intervals are based on a Taylor-linearized variance estimation (Greene, 2000).
Poverty rates with confidence intervals (*) for 4 family types by the presence of children and use of marital quotient system.
| Baseline | Alternative | ||||||||
|---|---|---|---|---|---|---|---|---|---|
| Categories | Population share | Poverty Rate | S.E. | C.I. (95%) | Poverty Rate | S.E. | C.I. (95%) | ||
| Overall | 100% | 11.71 | 0.68 | 10.37 | 13.05 | 12.19 | 0.65 | 10.90 | 13.47 |
| With children and no MQ | 26% | 7.02 | 0.95 | 5.15 | 8.89 | 4.25 | 0.73 | 2.83 | 5.68 |
| With children and with MQ | 12% | 13.61 | 1.97 | 9.73 | 17.50 | 13.37 | 2.05 | 9.33 | 17.41 |
| No children and no MQ | 43% | 11.60 | 0.75 | 10.12 | 13.07 | 11.70 | 0.76 | 10.22 | 13.19 |
| No children and with MQ | 20% | 16.82 | 1.30 | 14.27 | 19.37 | 22.61 | 1.42 | 19.81 | 25.42 |
-
Source: MISIM.
(*) Confidence intervals are based on a Taylor-linearized variance estimation.
Inequalit measures.
| Baseline | Alternative | |||||||
|---|---|---|---|---|---|---|---|---|
| S.E. | C.I. (95%) | S.E. | C.I. (95%) | |||||
| Gini | 0.2294 | 0.0032 | 0.2231 | 0.2356 | 0.2321 | 0.0031 | 0.2261 | 0.2381 |
| GE(-1) | 0.1684 | 0.0113 | 0.1462 | 0.1907 | 0.1695 | 0.0113 | 0.1475 | 0.1916 |
| MLD | 0.1014 | 0.0035 | 0.0946 | 0.1082 | 0.1029 | 0.0034 | 0.0963 | 0.1095 |
| Theil | 0.0887 | 0.0026 | 0.0836 | 0.0937 | 0.0902 | 0.0025 | 0.0853 | 0.0951 |
| GE(2) | 0.0918 | 0.0030 | 0.0860 | 0.0976 | 0.0934 | 0.0029 | 0.0876 | 0.0991 |
| GE(3) | 0.1076 | 0.0046 | 0.0986 | 0.1166 | 0.1093 | 0.0046 | 0.1003 | 0.1183 |
-
Source: MISIM.
-
*
Confidence intervals are based on a Taylor-linearized variance estimation.
Within group and between group inequality (MLD16) under baseline and alternative scenario for various age groups and family types.
| Categories | Baseline | Alternative | ||||
|---|---|---|---|---|---|---|
| Within | Between | Within | %Δ | Between | %Δ | |
| Overall | 0.1014 | 0.1028 | 1.36% | |||
| Age groups | 0.0968 | 0.00462 | 0.0973 | 0.50% | 0.00558 | 21.21% |
| Children (0-17) | 0.0702 | 0.0678 | -3.38% | |||
| 0-3 | 0.0796 | 0.0681 | -14.48% | |||
| 4-12 | 0.0664 | 0.0620 | -6.70% | |||
| 13-17 | 0.0678 | 0.0705 | 4.03% | |||
| Adults (18–64) | 0.1101 | 0.1117 | 1.51% | |||
| Elderly (65+) | 0.0827 | 0.0843 | 1.98% | |||
| Family types | 0.0949 | 0.00651 | 0.0932 | -1.78% | 0.00967 | 48.54% |
| With children and no MQ | 0.0670 | 0.0593 | -11.61% | |||
| With children and with MQ | 0.0545 | 0.0518 | -4.90% | |||
| No children and no MQ | 0.1316 | 0.1321 | 0.41% | |||
| No children and with MQ | 0.0758 | 0.0777 | 2.49% | |||
-
Source: MISIM.
The use of centre-based childcare in Flanders: a comparison of sources.
| SILC (use/hours) | FFCS (use) | FFCS (hours) | |
|---|---|---|---|
| None | 95.0 % | 91.0% | 83.8 % |
| For one child | 4.5 % | 8.1% | 13.8 % |
| For two children | 0.3 % | 0.7% | 2.3 % |
| For three children | 0.3 % | 0.3% | 0.2 % |
| N | 684 | 1577 | 394 |
| Indicator of use is | Types of childcare | Types of childcare | Hours of effective |
| based on: | services used in a ‘normal’ week | services used in a ‘normal’ week | use in the observation week |
-
Notes: all figures refer to families with any children < 13 in the region of Flanders SILC data are from 2004, FFCS from the school year 2004–2005 Data are weighted to correct for selective non-response.
Types of childcare services used by Flemish families in a normal week.
| FFCS | SILC | |
|---|---|---|
| Centre based care (crèche) | 9.0% | 5.0% |
| Childminder | 11.79% | 8.8% |
| Centre based care before and after school hours (other than school) | 7.8% | 0.9% |
| School care outside of school hours | 17.6% | 17.6% |
| Informal (grandparents and other) | 30.2% | 21.8% |
| Internate | 0.3% | 0.3% |
| Childminder at home under activation programme (‘PWA’) | 2.8% | 0.2% |
| Number of observations | 1577 | 684 |
-
Notes: all figures refer to families with any children < 13 in the region of Flanders SILC data are from 2004, FFCS from the school year 2004–2005 Data are weighted to correct for selective non-response.