Constructing a basefile for simulating Kunming’s medical insurance scheme of urban employees
- Second Military Medical University, China
- University of Canberra, Australia
- Bureau of Labour and Social Security of Kunming, China
- Office of Medical Insurance at No. 43 General Hospital, China
Cite this article
as: X. Linping, T. Weidong, L. Hong; 2011; Constructing a basefile for simulating Kunming’s medical insurance scheme of urban employees; International Journal of Microsimulation; 4(3); 3-16.
doi: 10.34196/ijm.00056
- Article
- Figures and data
- Jump to
Figures
Figure 1

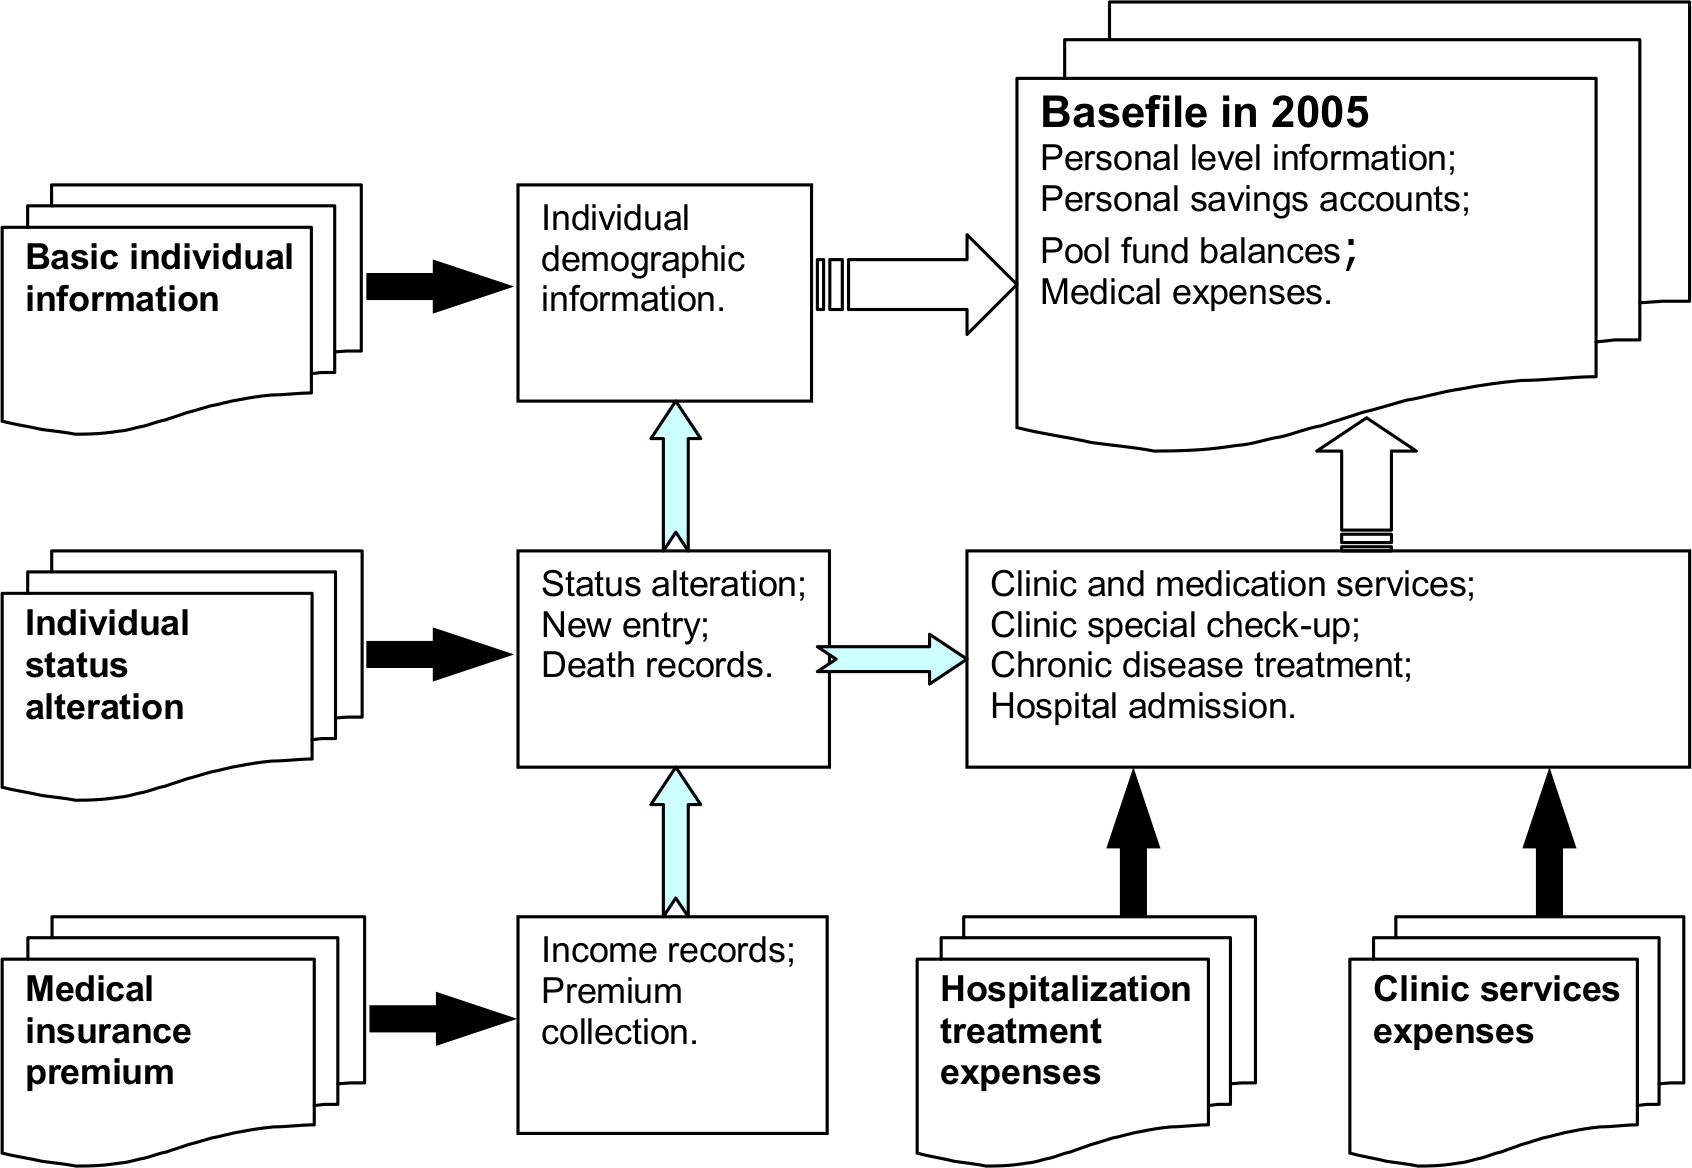
Datasets used in the research and their functions.
Figure 2
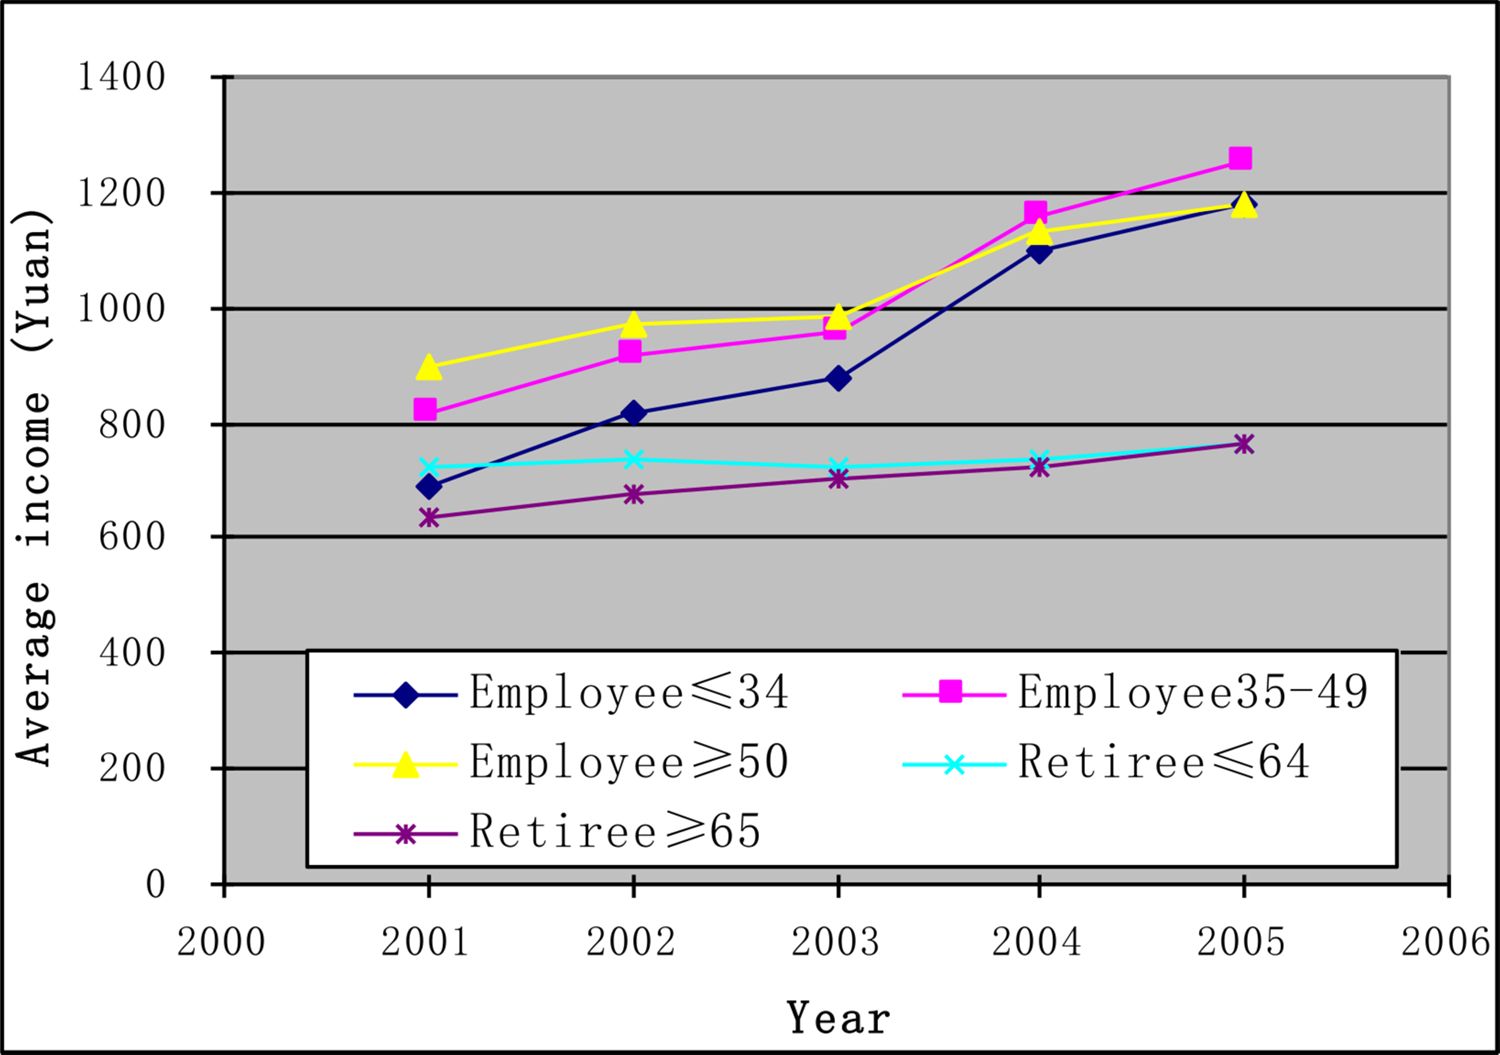
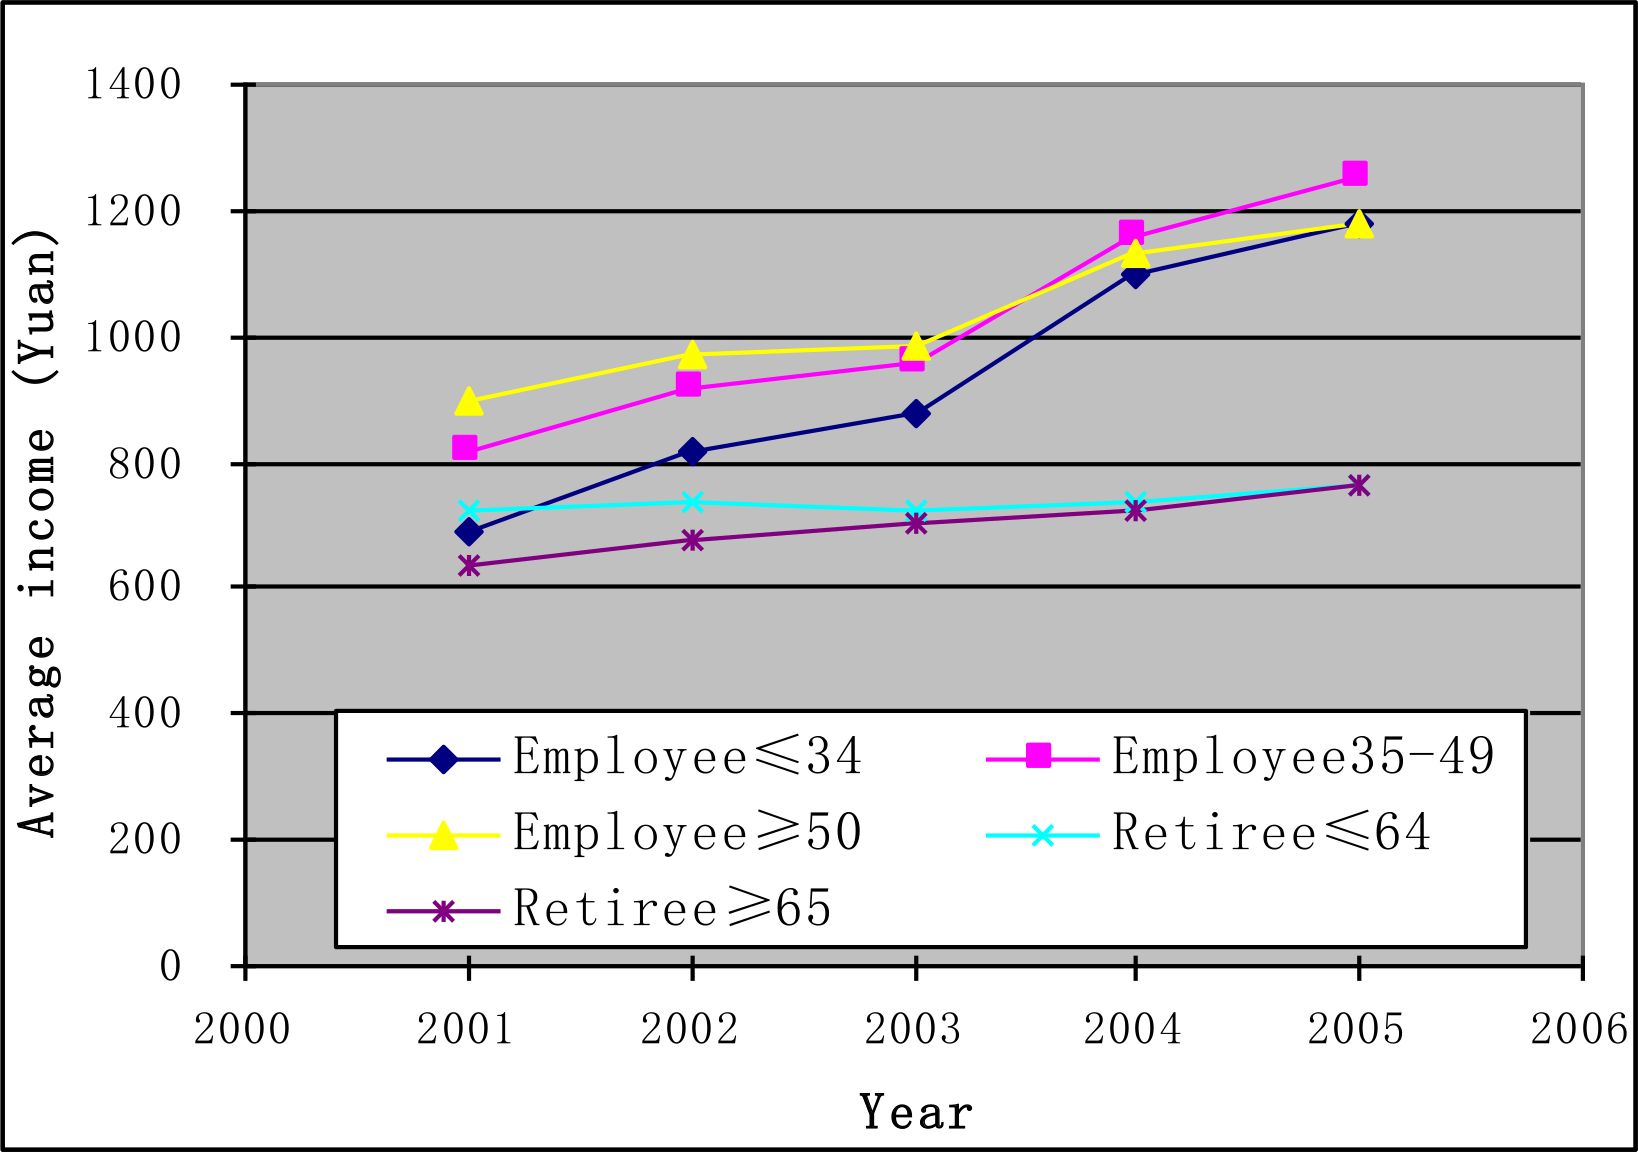
The income trends of 2001–2005 by age group.
Figure 3

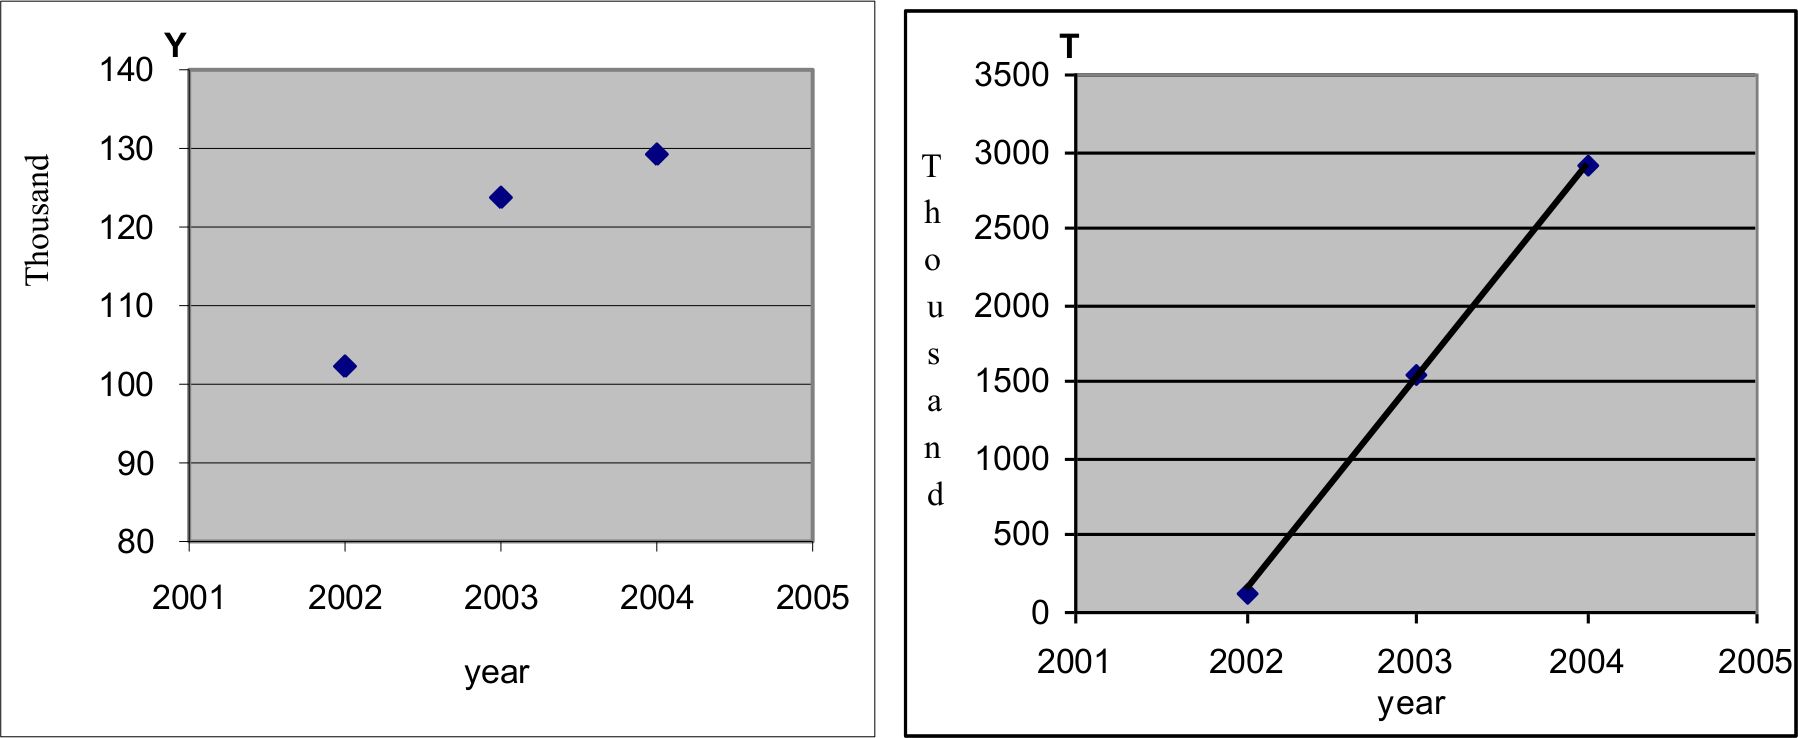
Exponential curve fitting for estimating the number of officials.
Tables
Table 1
Administrative datasets used in modelling medical insurance scheme.
| Datasets | Description |
|---|---|
| Basic individual information | Individuals’ basic demographic information under the urban medical insurance scheme over the period of 2001–2005 |
| Individual status alteration | Individual status alteration records of medical insurance scheme participants over the period of 2001–2005 |
| Medical insurance premium | Amount of contributions by individuals and their employers to the basic medical insurance scheme over the period of 2001–2005 |
| Hospitalization treatment expenses | Medical expenditure records of insured participants in both hospitalization and special disease services for the year 2002–2005 |
| Clinic services expenses | Medical expenditure records of clinic services and medications in pharmacies of insured participants over the period of 2001–2005 |
Table 2
Death of medical insurance participants in 2001–2005.
| Year | Number of participants | Number of deaths | Accumulative frequency | Proportion of death (%) |
|---|---|---|---|---|
| 2001 | 3,77,676 | 291 | 291 | 0.0771 |
| 2002 | 5,32,706 | 2,373 | 2,664 | 0.4455 |
| 2003 | 6,61,038 | 3,573 | 6,237 | 0.5405 |
| 2004 | 7,56,996 | 3,823 | 10,060 | 0.5050 |
| 2005 | 7,93,987 | 4,064 | 14,124 | 0.5118 |
Table 3
Age group specific death number and death rate (0.1%) of male (2001–2005).
| Year | ≤ 34 | 35–49 | 50–64 | ≥ 65 | Total number | ≤ 34 | 35–49 | 50–64 | ≥ 65 | Total rate |
|---|---|---|---|---|---|---|---|---|---|---|
| 2001 | 4 | 16 | 47 | 127 | 194 | 0.0804 | 0.2543 | 0.8673 | 4.3571 | 0.9899 |
| 2002 | 35 | 99 | 374 | 1,095 | 1,603 | 0.5003 | 1.0766 | 4.4636 | 23.1903 | 5.4724 |
| 2003 | 43 | 152 | 525 | 1,653 | 2,373 | 0.5057 | 1.3631 | 5.0157 | 27.3214 | 6.5605 |
| 2004 | 66 | 178 | 612 | 1,808 | 2,664 | 0.6881 | 1.4875 | 5.2957 | 27.7599 | 6.7226 |
| 2005 | 60 | 195 | 761 | 1,725 | 2,741 | 0.5678 | 1.5188 | 6.1504 | 23.6195 | 6.3623 |
| Average death rate over 2002–2005 (0.1%) | 0.5655 | 1.3615 | 5.2314 | 25.4728 | 6.2795 | |||||
Table 4
Age group death number and death rate (0.1%) of female (2001–2005).
| Year | ≤ 34 | 35–49 | 50–64 | ≥ 65 | Total number | ≤ 34 | 35–49 | 50–64 | ≥ 65 | Total rate |
|---|---|---|---|---|---|---|---|---|---|---|
| 2001 | 2 | 11 | 23 | 61 | 97 | 0.0431 | 0.2008 | 0.4777 | 3.0511 | 0.5728 |
| 2002 | 16 | 57 | 160 | 537 | 770 | 0.2545 | 0.6833 | 2.2372 | 17.0563 | 3.0886 |
| 2003 | 29 | 77 | 248 | 846 | 1,200 | 0.3892 | 0.7402 | 2.8507 | 20.7135 | 3.9168 |
| 2004 | 21 | 82 | 256 | 800 | 1,159 | 0.2527 | 0.7132 | 2.7311 | 17.7054 | 3.4392 |
| 2005 | 21 | 83 | 335 | 884 | 1,323 | 0.2312 | 0.6878 | 3.3030 | 17.6004 | 3.6430 |
| Average death rate over 2002–2005 (0.1%) | 0.2819 | 0.7061 | 2.7805 | 18.2689 | 3.5219 | |||||
Table 5
Monthly premium information by age group in 2005.
| Age group | Number of participants | Number of participants with payment | Payment rate (%) | Average monthly income (Yuan) | Minimum income (Yuan) | Maximum income (Yuan) |
|---|---|---|---|---|---|---|
| Emp ≤ 34 years | 1,96,410 | 1,89,614 | 96.54 | 1,176 | 450 | 3,342 |
| Emp 35–49 | 2,43,227 | 2,40,111 | 98.72 | 1,249 | 468 | 3,342 |
| Emp ≥ 50 years | 91,893 | 91,424 | 99.49 | 1,179 | 336 | 3,342 |
| Ret ≤ 64 years | 139,362 | 137,544 | 98.70 | 763 | 111 | 3,320 |
| Ret ≥ 65 years | 1,23,095 | 1,18,424 | 96.21 | 760 | 108 | 3108 |
| Total | 7,93,987 | 7,77,117 | 97.88 |
-
Note: Emp – Employee, Ret – Retiree
Table 6
Distribution of number of monthly payments to the scheme in 2005.
| Number of months | Participant frequency | Percentage | Accumulative frequency | Accumulative percentage |
|---|---|---|---|---|
| 1 | 5,576 | 0.70 | 5576 | 0.70 |
| 2 | 4,545 | 0.57 | 10,121 | 1.27 |
| 3 | 6,211 | 0.78 | 16,332 | 2.06 |
| 4 | 5,309 | 0.67 | 21,641 | 2.73 |
| 5 | 4,417 | 0.56 | 26,058 | 3.28 |
| 6 | 4,856 | 0.61 | 30,914 | 3.89 |
| 7 | 4,816 | 0.61 | 35,730 | 4.50 |
| 8 | 9,043 | 1.14 | 44,773 | 5.64 |
| 9 | 4,597 | 0.58 | 49,370 | 6.22 |
| 10 | 5,506 | 0.69 | 54,876 | 6.91 |
| 11 | 12,472 | 1.57 | 67,348 | 8.48 |
| 12 | 709,769 | 89.39 | 777,117 | 97.88 |
| 99 | 16,870 | 2.12 | 793,987 | 100.00 |
-
Note: ’99 in the first column indicates missing records.
Table 7
The monthly income by age group in 2005 after imputation.
| Age group | Actual population | Population after imputation | Average income (Yuan) | Minimum income (Yuan) | Maximum income (Yuan) |
|---|---|---|---|---|---|
| Emp ≤34 years | 1,96,410 | 1,96,410 | 1,175.67 | 450.00 | 3,342.25 |
| Emp 35–49 years | 2,43,227 | 243,227 | 1,249.58 | 468.25 | 3,342.25 |
| Emp ≥50 years | 91,893 | 91,893 | 1,179.26 | 336.00 | 3,342.25 |
| Ret ≤64 years | 1,39,362 | 1,39,362 | 763.59 | 111.00 | 3,319.71 |
| Ret ≥65 years | 1,23,095 | 1,23,095 | 760.58 | 108.00 | 3,107.50 |
| Total | 7,93,987 | 7,93,987 |
-
Note: Emp – Employee, Ret – Retiree.
Table 8
The accumulative amount in personal savings accounts at the end of 2005 (Yuan).
| Age group | Population | Average accumulate | Standard deviation | Minimum | Maximum |
|---|---|---|---|---|---|
| Emp ≤ 34 years | 1,96,410 | 1,116 | 754 | 69 | 5,014 |
| Emp 35–49 years | 2,43,227 | 1,698 | 900 | 69 | 5,758 |
| Emp≥50 years | 91,893 | 1,989 | 1,033 | 39 | 6,484 |
| Ret ≤64 years | 1,39,362 | 1,402 | 766 | 28 | 6,382 |
| Ret ≥65 years | 1,23,095 | 1,385 | 714 | 35 | 7,257 |
| Total | 7,93,987 |
-
Notes: Emp – Employee,Ret – Retiree.
Table 9
Estimation of number of officials using exponential curve fitting.
| Year | Actual number of officials | Estimated number of officials | Relative errors* | Estimated number of participants | % of officials to participants |
|---|---|---|---|---|---|
| 2002 | 1,02,310 | 1,02,873 | 0.5503 | 577,066 | 17.8 |
| 2003 | 123,769 | 123,670 | −0.0800 | 683,646 | 18.1 |
| 2004 | 1,29,259 | 1,29,285 | 0.0201 | 747,710 | 17.3 |
| 2005 | 1,32,667 | 7,93,663 | 16.7 | ||
| 2006 | 1,35,096 | 8,29,518 | 16.3 | ||
| 2007 | 1,36,991 | 8,58,925 | 15.9 | ||
| 2008 | 1,38,546 | 8,83,852 | 15.7 | ||
| 2009 | 1,39,865 | 9,05,486 | 15.4 | ||
| 2010 | 1,41,009 | 9,24,596 | 15.3 | ||
| Fitted R2 | 0.9999 |
-
Note: *Relative Errors = (Estimated – Actual)/Actual × 100.
Table 10
The distribution of personal status in 2005.
| Variable | Category | Frequency | Percentage | Accumulative frequency |
|---|---|---|---|---|
| Personal status | Cadre | 1,05,604 | 14.33 | 1,13,778 |
| Worker | 76,308 | 9.90 | 1,92,403 | |
| Farmer labourer | 137 | 0.02 | 1,92,601 | |
| Missing | 6,01,386 | 75.74 | 7,93,987 |
Table 11
The impact factors of discriminant analysis in identifying officials.
| Factors | Category | Frequency | percentage | Accumulative frequency |
|---|---|---|---|---|
| Gender | Male | 4,16,632 | 54.59 | 4,16,632 |
| Female | 3,46,583 | 45.41 | 7,63,215 | |
| Nationality | Han | 6,98,678 | 91.54 | 6,98,678 |
| Minorities | 64,537 | 8.46 | 7,63,215 | |
| Employment status | Employee | 5,08,400 | 66.61 | 5,08,400 |
| Retiree | 2,54,815 | 33.39 | 7,63,215 | |
| Education degree | Under primary | 1,50,333 | 19.70 | 1,50,333 |
| Junior high school | 1,81,643 | 23.80 | 3,31,976 | |
| Senior high school | 2,45,124 | 32.12 | 5,77,100 | |
| University | 1,86,115 | 24.39 | 7,63,215 | |
| Marital status | Single | 1,75,146 | 22.95 | 1,75,146 |
| Married | 5,88,069 | 77.05 | 7,63,215 | |
| Age group | Employee ≤34 years | 1,87,106 | 24.52 | 1,87,106 |
| Employee 35–49 years | 2,32,154 | 30.42 | 4,19,260 | |
| Employee ≥50 years | 89,140 | 11.68 | 5,08,400 | |
| Retiree ≤64 years | 1,35,959 | 17.81 | 6,44,359 | |
| Retiree ≥65 years | 1,18,856 | 15.57 | 7,63,215 | |
| Age | Continuous variable | 7,63,215 | ||
| Monthly income | Continuous variable | 7,63,215 |
Table 12
Constants and Coefficients of discriminant functions.
| Classify | Constant | Gender | Nationality | Employment | Education | Marry | Age |
|---|---|---|---|---|---|---|---|
| Official | −54.3071 | 6.16945 | 14.2724 | 25.45331 | 6.1558 | 5.37318 | 1.39241 |
| Worker | −48.8466 | 6.20641 | 14.15723 | 25.34738 | 4.69624 | 5.83103 | 1.36205 |
| Partial R-Square | 0.0001 | 0.0002 | 0.0001 | 0.2277 | 0.0063 | 0.0335 |
Table 13
Number of Observations and Percent Classified into Cadre or Worker.
| Original classification | Classified into Official | Classified into Worker | Total |
|---|---|---|---|
| Official No | 75,451 | 30,153 | 1,05,604 |
| % | 71.38 | 28.62 | 100.00 |
| Worker No | 19,206 | 57,102 | 76,308 |
| % | 25.08 | 74.92 | 100.00 |
| Total No | 94,657 | 87,255 | 1,81,912 |
| % | 51.96 | 48.04 | 100.00 |
Table 14
Different kind of costs in average by age group at the end of 2005 (Yuan).
| Age group | Average Payment for each insured individual by | Amount of Accumulate in PSA | Balance of PSA | ||||
|---|---|---|---|---|---|---|---|
| Self Totally | Personal savings account | Social pool fund | Serious illness fund | Government official fund | |||
| Emp ≤34 years | 22 | 1,050 | 283 | 19 | 3 | 1,607 | 557 |
| Emp 35–49 years | 49 | 1,640 | 724 | 47 | 9 | 2,226 | 586 |
| Emp ≥50 years | 81 | 1,977 | 1,361 | 126 | 12 | 2,477 | 501 |
| Ret ≤64 years | 130 | 1,961 | 2,687 | 187 | 9 | 1,639 | −322 |
| Ret ≥65 years | 223 | 2,578 | 5,025 | 313 | 23 | 1,614 | −964 |
-
Note: Emp – Employee, Ret – Retiree, PSA – Personal savings account
Table 15
The monthly income adjustment parameters.
| Sex | Group | Income | Rate1 | Rate2 | Rate3 | Rate4 | Rate5 | Rate6 | Rate7 | Rate8 |
|---|---|---|---|---|---|---|---|---|---|---|
| 1 | 1 | 1 | 0.12266 | 0.14138 | 0.21787 | 0.47927 | 1.04961 | 1.73501 | 3.31952 | 4.66841 |
| 1 | 1 | 2 | 0.08690 | 0.11716 | 0.20500 | 0.42003 | 0.87130 | 1.47540 | 3.00536 | 4.31932 |
| 1 | 1 | 3 | −0.00323 | 0.06362 | 0.13608 | 0.39481 | 0.81915 | 1.47868 | 2.85378 | 4.02337 |
| 1 | 1 | 4 | −0.18203 | −0.03832 | 0.03729 | 0.22041 | 0.49273 | 0.95651 | 2.01142 | 3.10143 |
| 1 | 1 | 5 | −0.36013 | −0.16767 | 0.01439 | 0.11296 | 0.30066 | 0.65700 | 1.38539 | 2.07747 |
| 1 | 1 | 6 | −0.48373 | −0.28098 | −0.04153 | 0.08365 | 0.28106 | 0.52561 | 1.04572 | 1.53034 |
| 1 | 1 | 7 | −0.61252 | −0.42016 | −0.15020 | 0.06411 | 0.25603 | 0.45087 | 0.66346 | 0.89255 |
| 1 | 1 | 8 | −0.69212 | −0.49179 | −0.18298 | 0.05357 | 0.18571 | 0.27947 | 0.36918 | 0.47154 |
| 1 | 1 | 9 | −0.70124 | −0.45743 | −0.20916 | 0.00736 | 0.02508 | 0.02691 | 0.00249 | 0.15586 |
| 1 | 2 | 1 | 0.09254 | 0.14038 | 0.21973 | 0.50458 | 1.17240 | 1.93866 | 3.50962 | 4.69382 |
| 1 | 2 | 2 | 0.04557 | 0.08680 | 0.15186 | 0.43602 | 0.99369 | 1.67413 | 2.98944 | 4.24908 |
| : | : | : | : | : | : | : | : | : | : | |
| 2 | 5 | 8 | −0.60547 | −0.41587 | −0.00792 | 0.03741 | 0.06543 | 0.11838 | 0.17226 | 0.27425 |
| 2 | 5 | 9 | −0.68014 | −0.47035 | −0.16917 | 0.02955 | 0.05355 | 0.10269 | 0.13050 | 0.18214 |
| Relative frequency | 0–0.10 | 0.10–0.25 | 0.25–0.50 | 0.50–0.75 | 0.75–0.90 | 0.90–0.95 | 0.95–0.99 | 0.99–1.00 | ||
Download links
A two-part list of links to download the article, or parts of the article, in various formats.