Simulating histories within dynamic microsimulation models
- Maastricht University / UNU-MERIT, The Netherlands
- Rural Economy and Development Programme, Teagasc, Ireland
Cite this article
as: J. Li, C. O’Donoghue; 2012; Simulating histories within dynamic microsimulation models; International Journal of Microsimulation; 5(1); 52-76.
doi: 10.34196/ijm.00067
- Article
- Figures and data
- Jump to
Figures
Figure 1
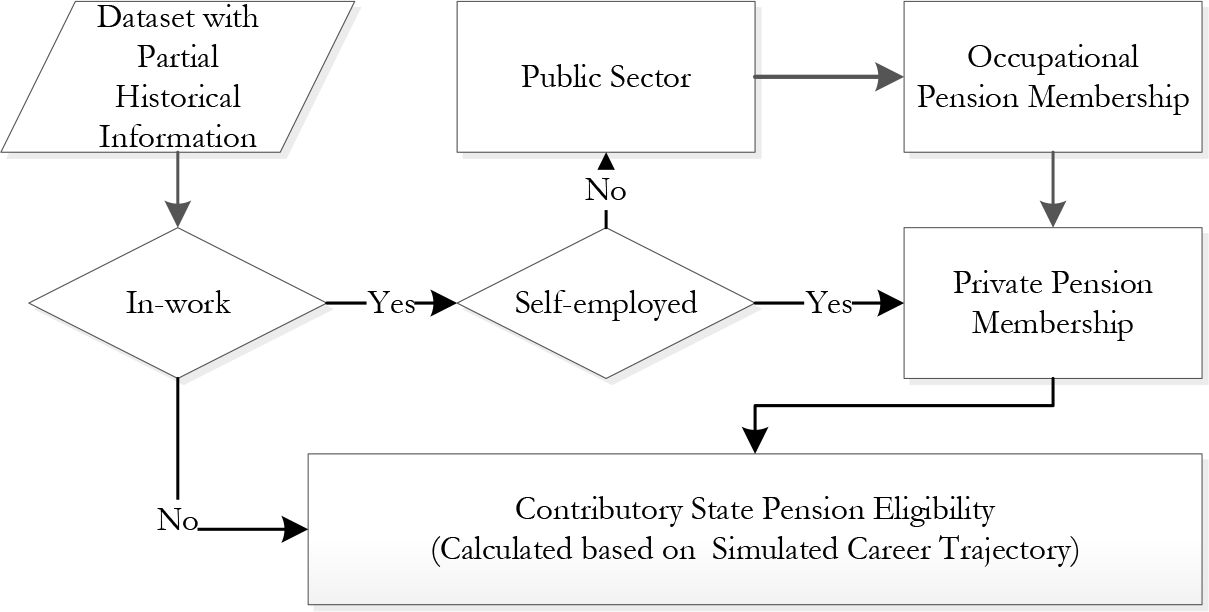
Simulation flowchart for the employment status variables.
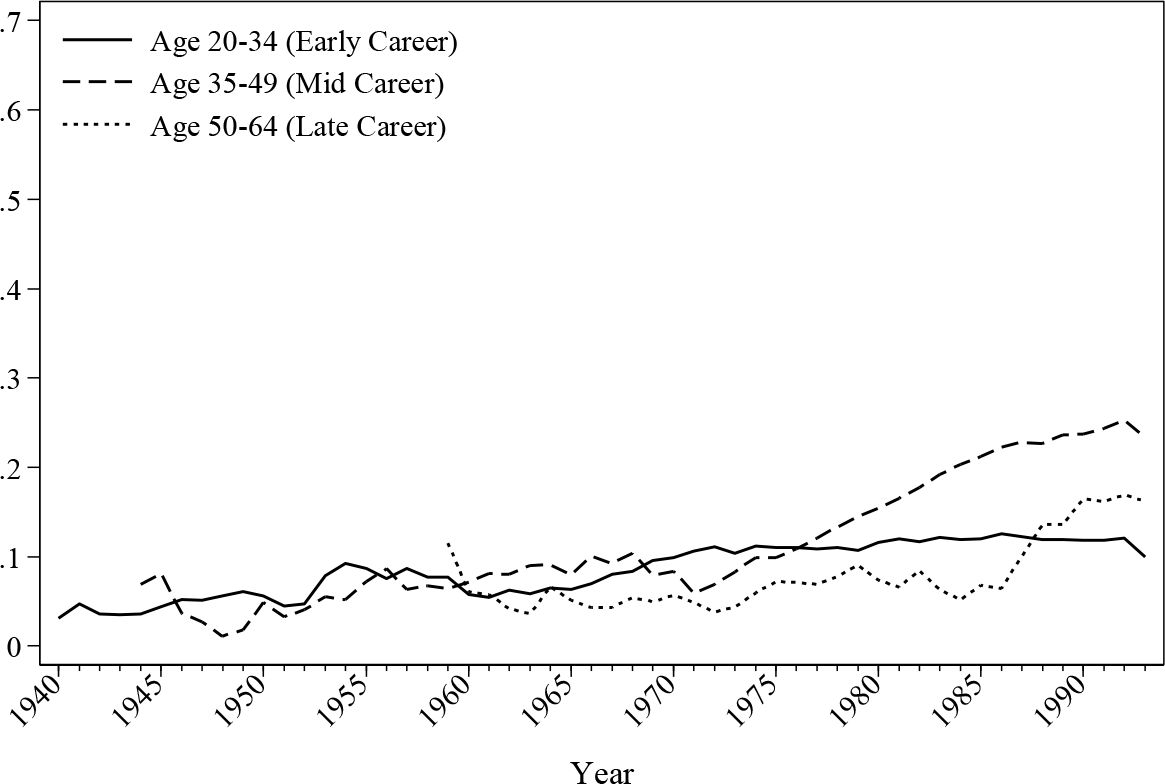
Figure 2

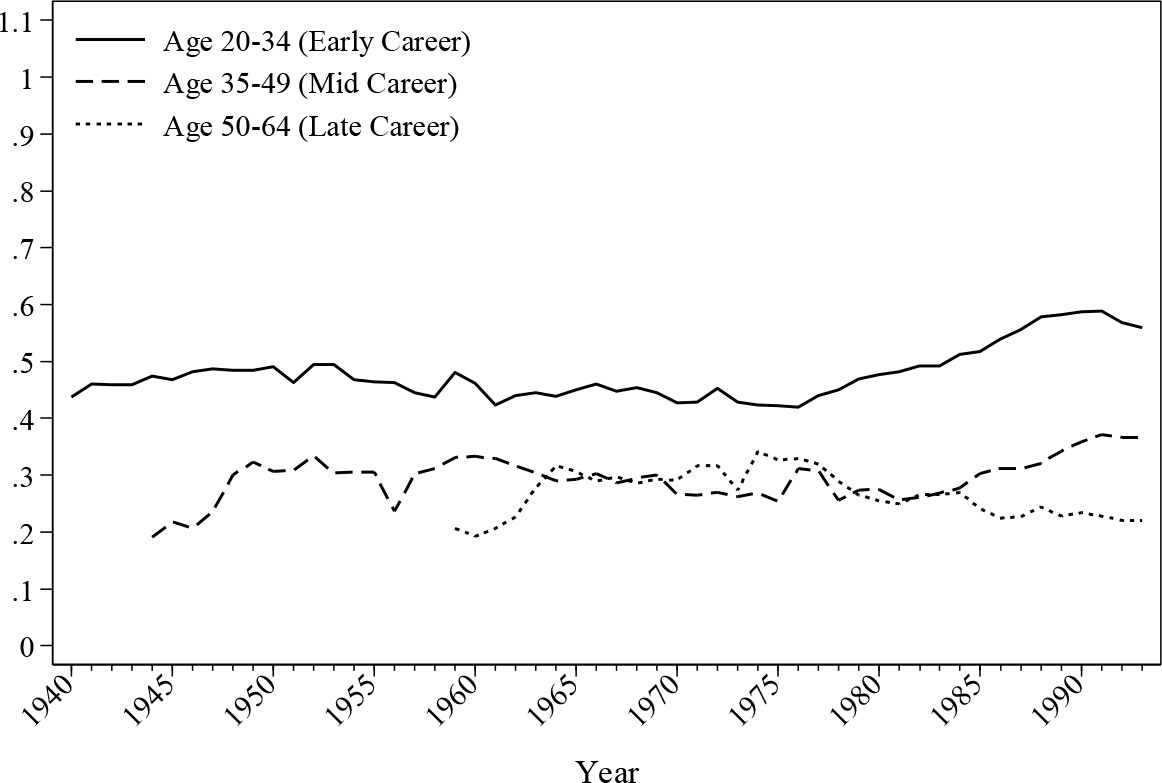
Simulated historical in-work ratio for male by age.
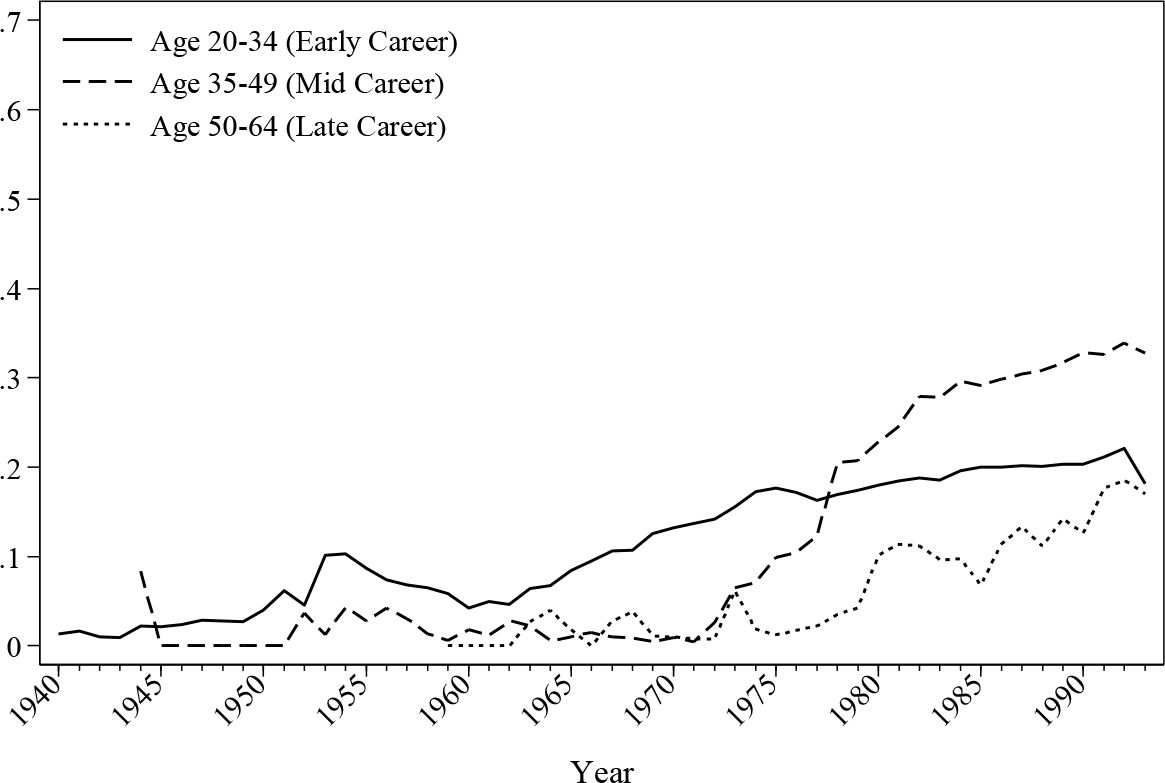
Figure 3

Simulated historical in-work ratio for female by age.
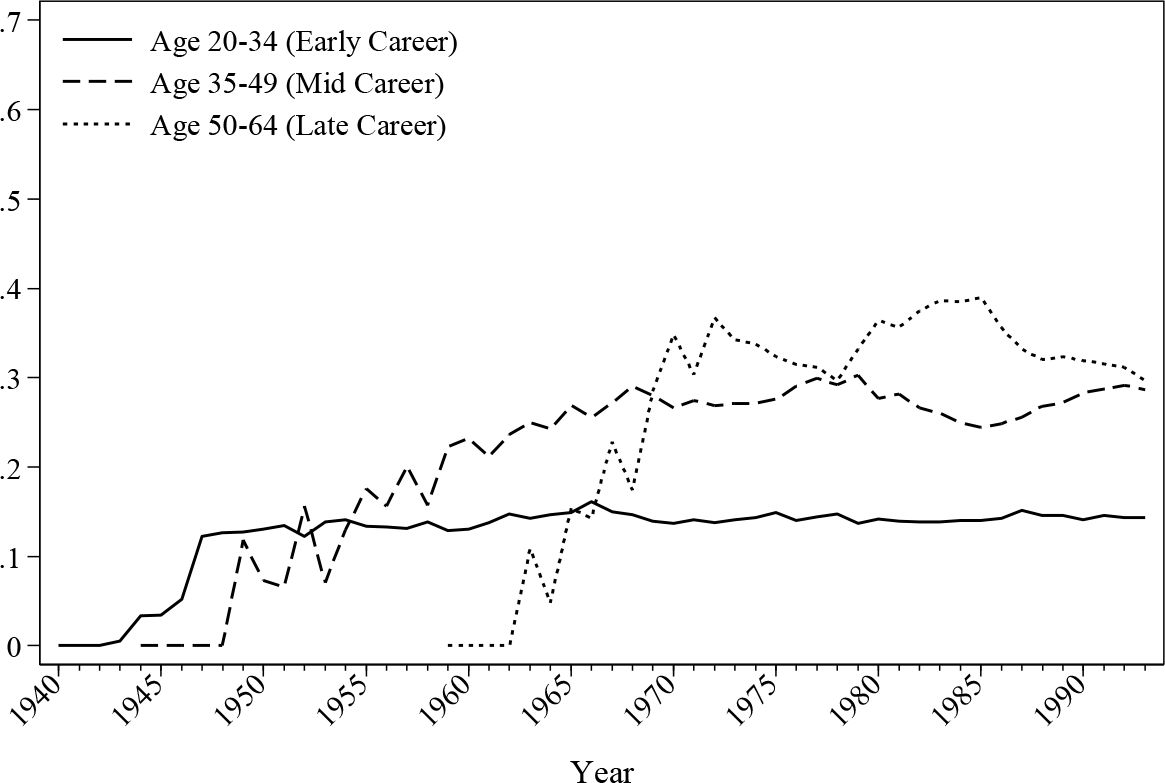
Figure 4

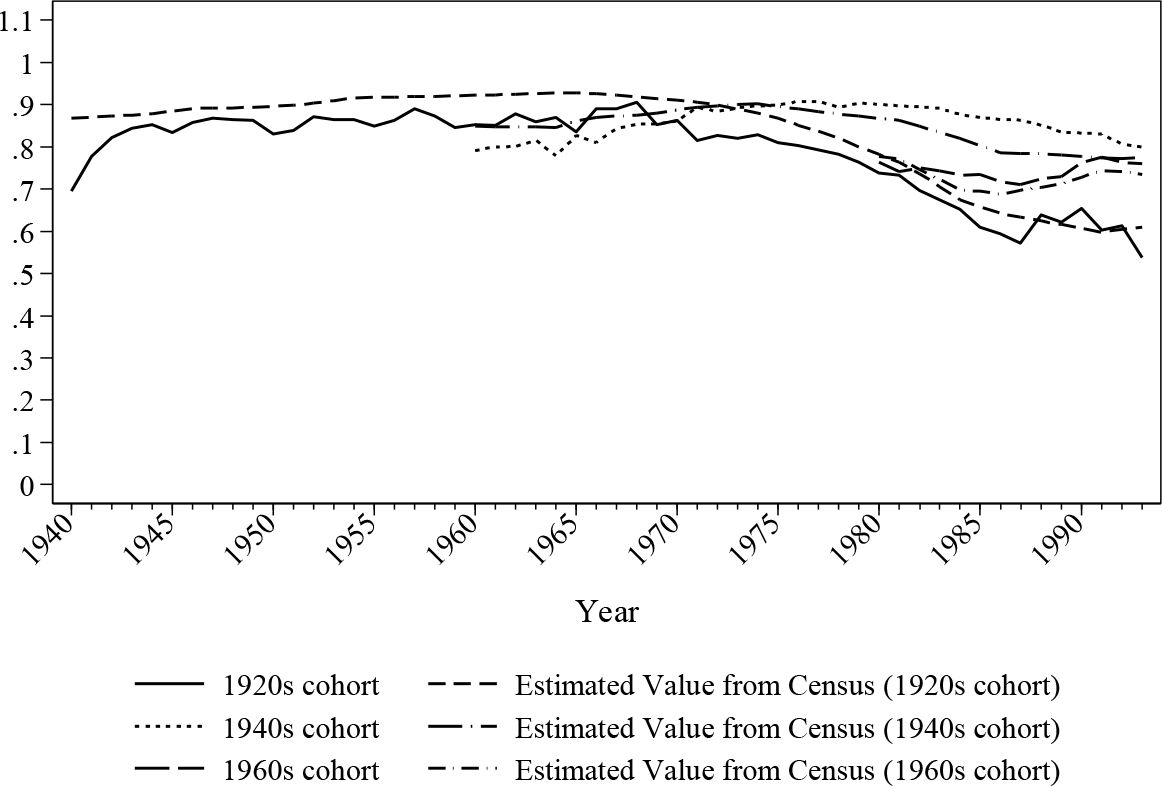
Simulated historical in-work ratio for male by cohorts.
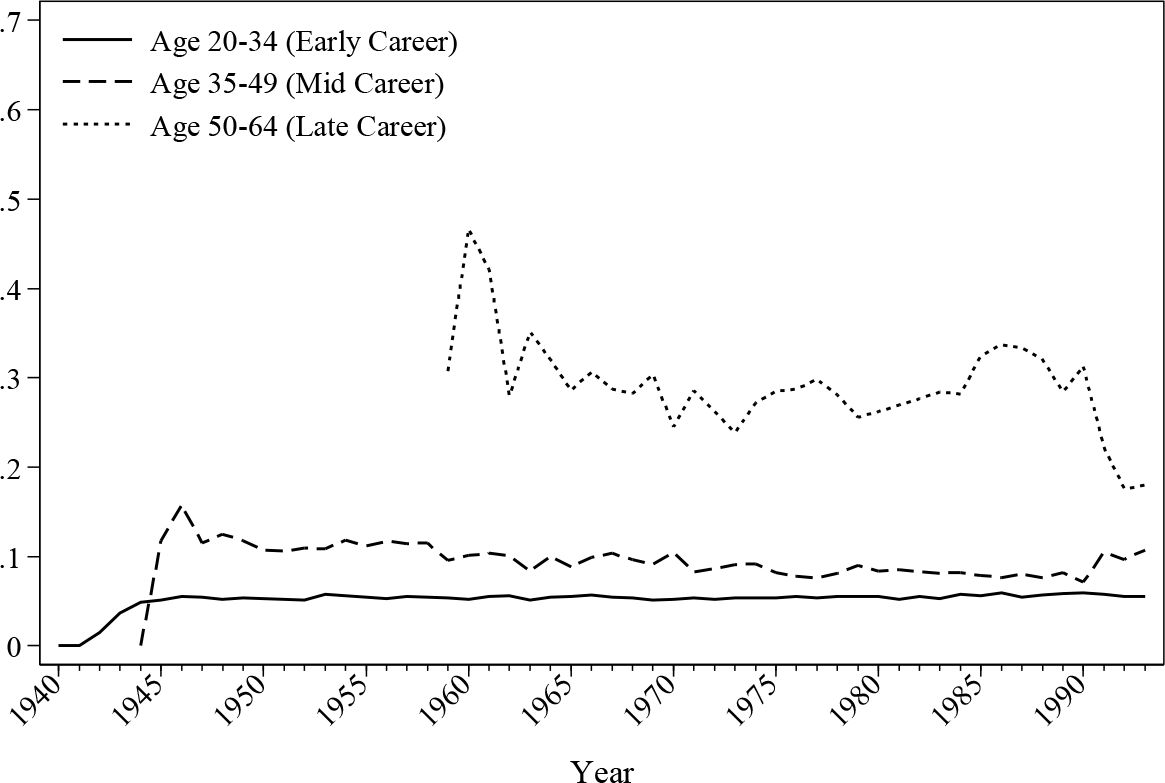
Figure 5

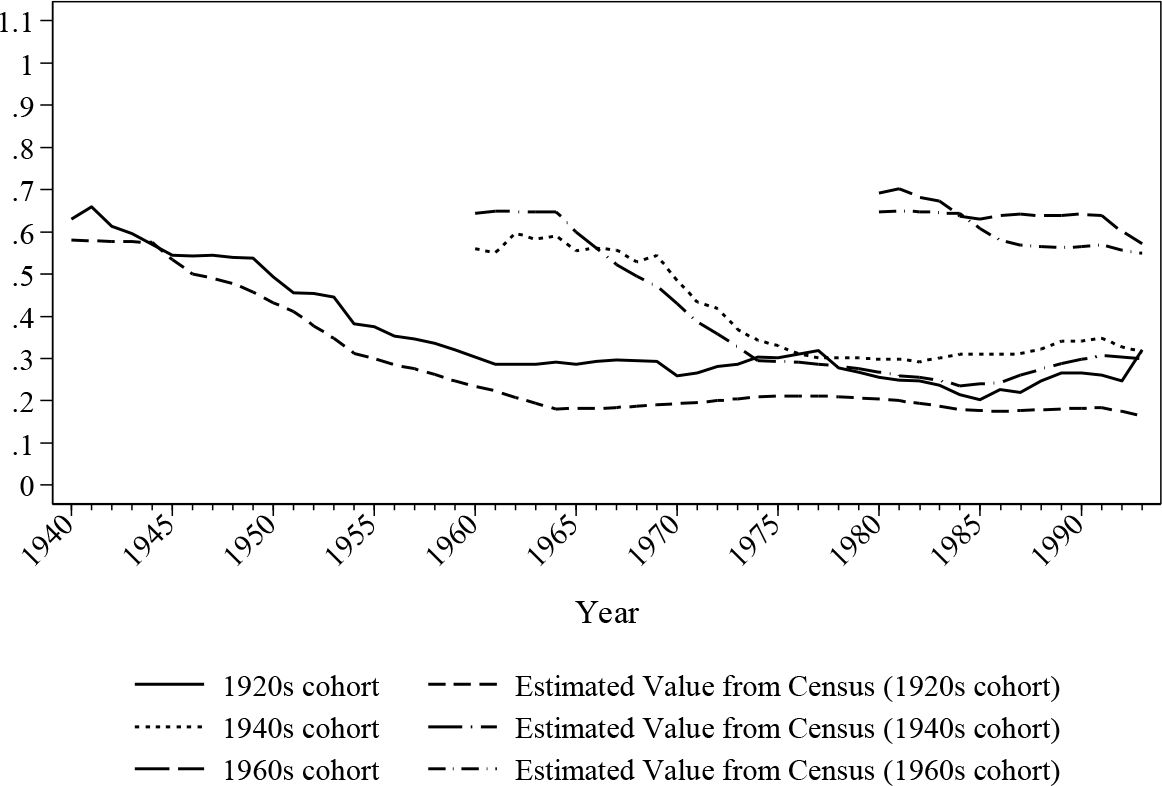
Simulated historical in-work ratio for female by cohorts.
Figure 6

Difference between simulated years of work and reported value.
Figure 7

Public sector employment for male.
Figure 8
Simulated public sector employment for female.
Figure 9

Simulated male self-employed ratio by age.
Figure 10

Simulated female self-employed ratio by age.
Figure 11
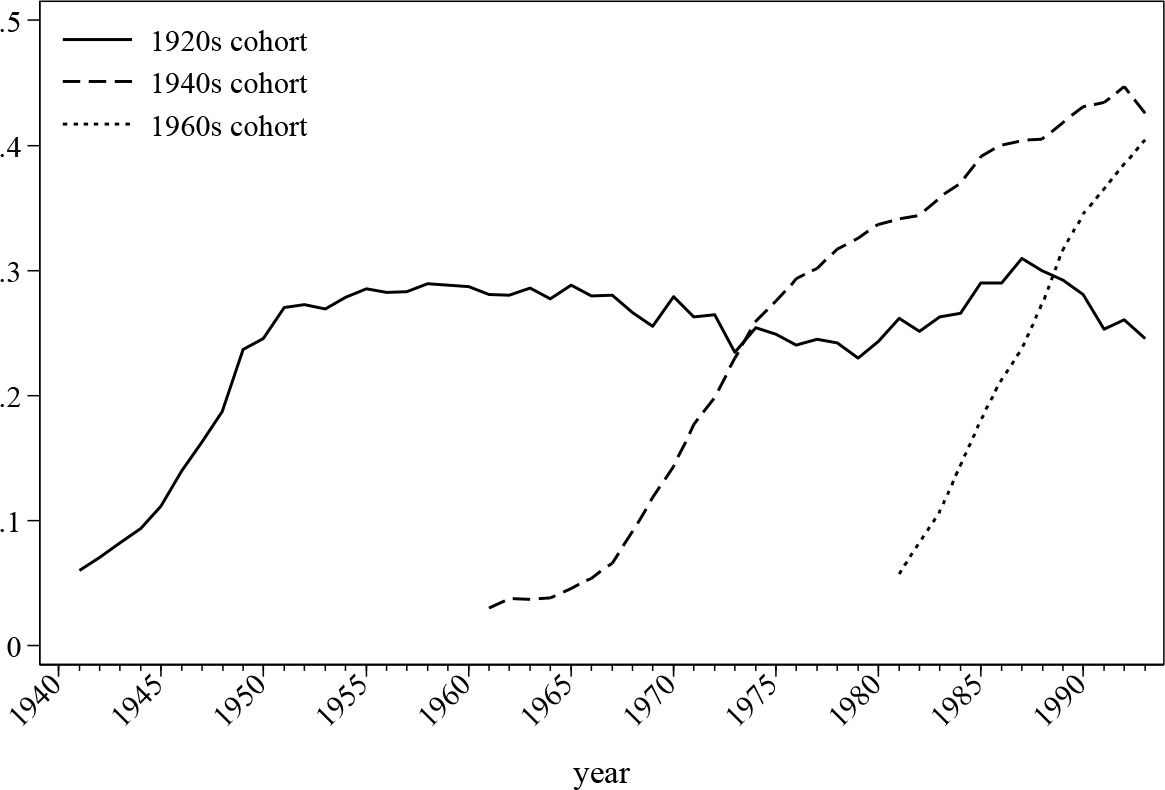

Occupational pension participation by cohort.
Figure 12
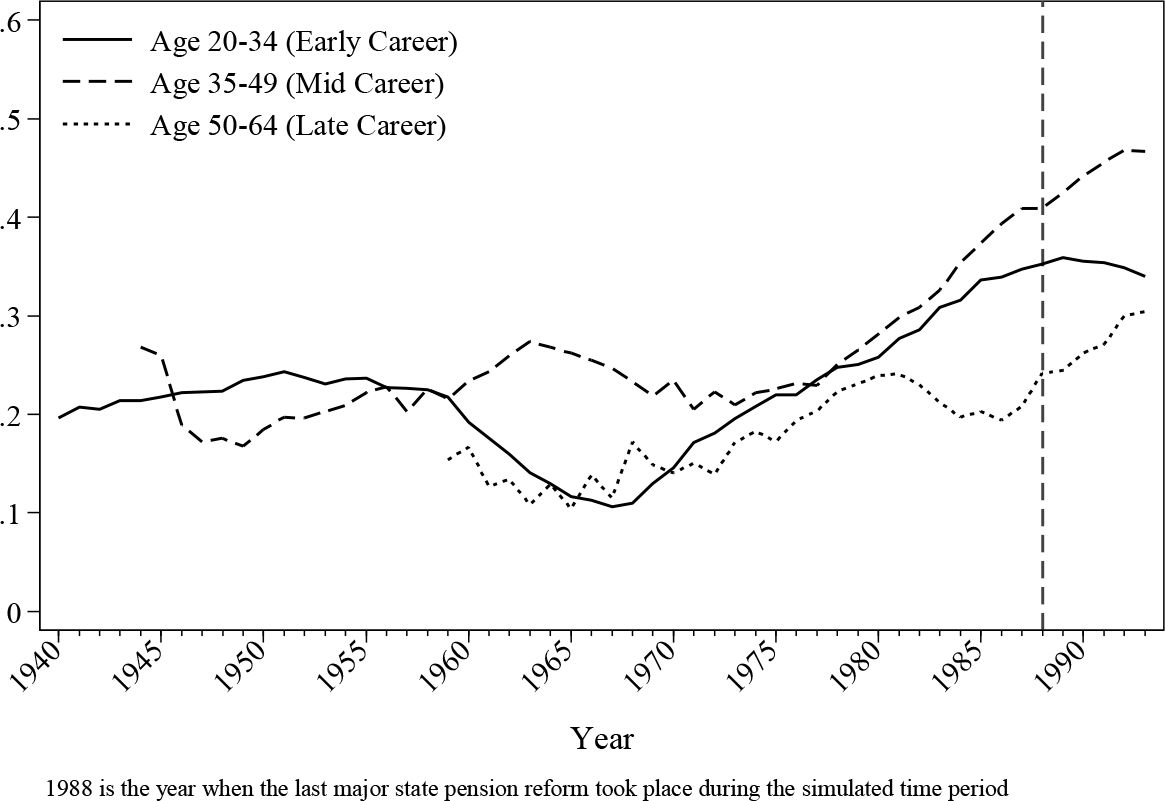
Occupational pension participation by age group.
Figure 13

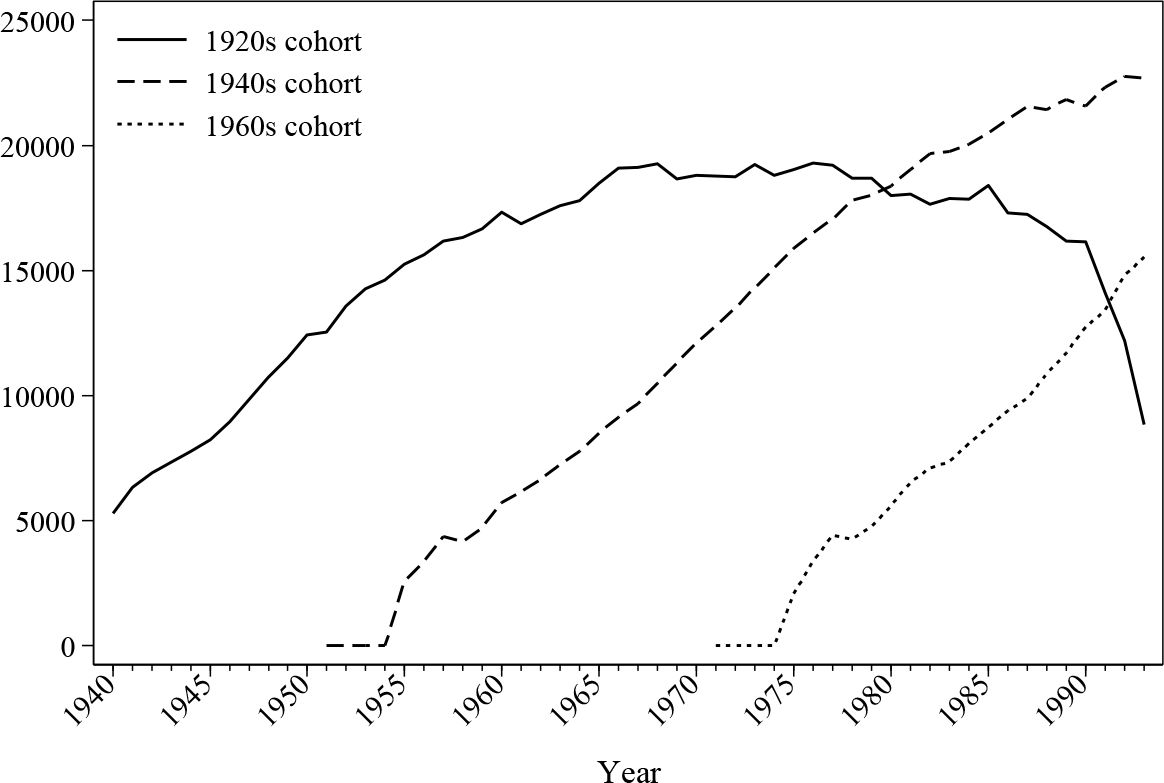
Average male earnings (£) by cohort.
Figure 14
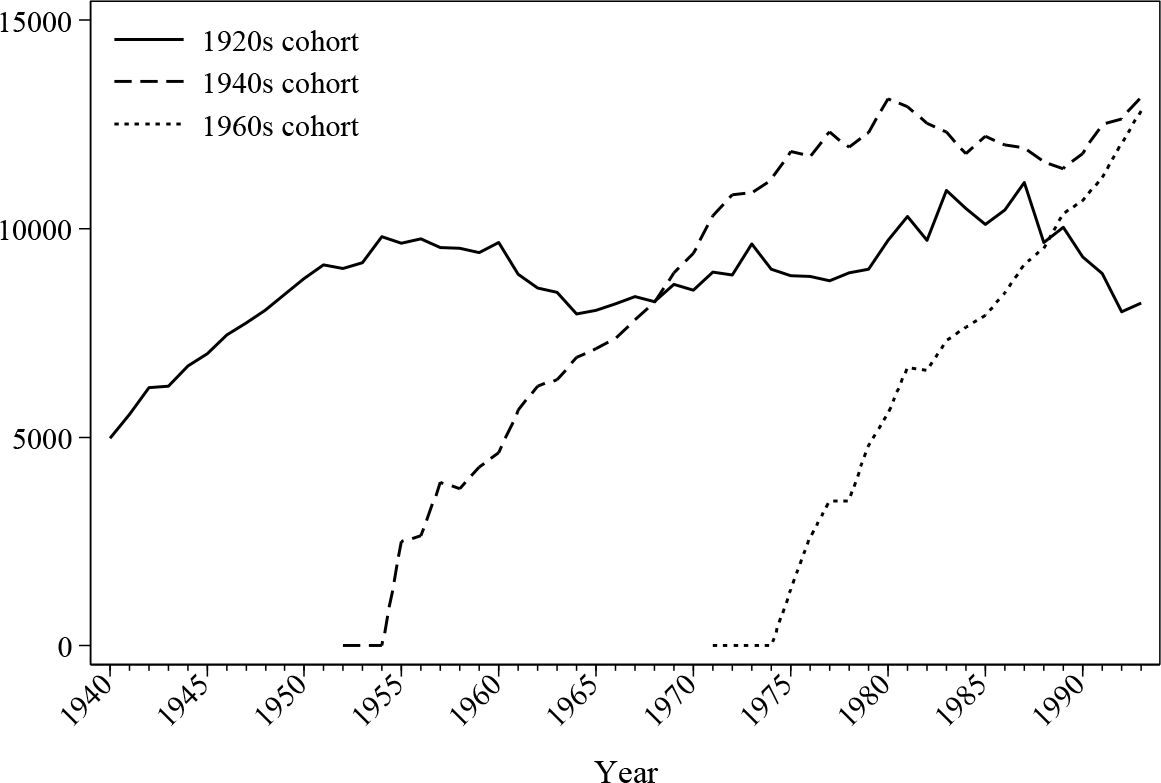

Average female earnings (£) by cohort.
Figure 15

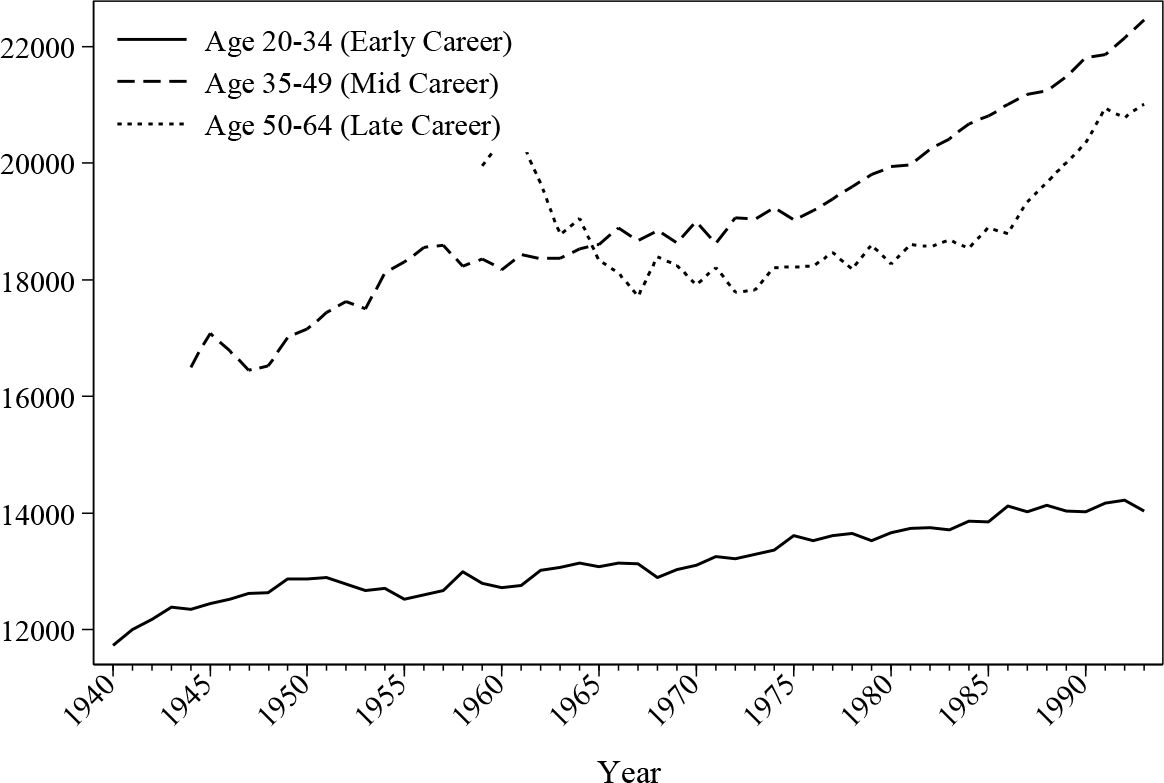
Average male earnings (£) by age.
Figure 16

Average female earnings (£) by age.
Tables
Table 1
An overview of LII survey.
| Variable | Mean | Standard Deviation |
|---|---|---|
| Age | 34.15 | 21.86 |
| Gender | 0.50 | 0.50 |
| Married (%) | 38.91% | 0.49 |
| Average household size | 4.31 | 1.86 |
| Working population (%) | 38.18% | 0.49 |
| Public Sector worker (%) | 7.81% | 0.27 |
| Self-employed (%) | 7.73% | 0.27 |
| Retired (%) | 6.85% | 0.25 |
| Unemployed (%) | 5.40% | 0.23 |
| Percentage of the population with college education | 17.46% | 0.38 |
| Average reported years of work | 13.66 | 15.20 |
| Total number of household | 7,529 | |
| Total number of individuals | 23,955 | |
| Total number of observations | 100,639 | |
Table 2
Retrospective variables adjustment in the LII survey (base year).
| Sex | Variable Description | Original | Adjusted | Observations Adjusted (%) | ||
|---|---|---|---|---|---|---|
| Mean | s.d. | Mean | s.d. | |||
| Male | Years in full-time education or training | 6.83 | 2.67 | 6.67 | 2.85 | 2.28% |
| Years in employment, self-employment or farming | 19.38 | 17.88 | 19.32 | 17.88 | 0.40% | |
| Years in unemployment | 1.11 | 3.24 | 1.11 | 3.24 | 0.14% | |
| Years of illness/disabled | 0.39 | 2.88 | 0.39 | 2.88 | 0.02% | |
| Years spent on home duties | 0.21 | 3.30 | 0.14 | 2.63 | 0.23% | |
| Years in retirement | 1.01 | 3.44 | 1.00 | 3.42 | 0.07% | |
| Female | Years in full-time education or training | 6.92 | 2.36 | 6.77 | 2.57 | 2.23% |
| Years in employment, self-employment or farming | 9.17 | 10.68 | 9.10 | 10.64 | 0.51% | |
| Years in unemployment | 0.32 | 1.58 | 0.32 | 1.58 | 0.09% | |
| Years of illness/disabled | 0.27 | 2.39 | 0.25 | 2.26 | 0.05% | |
| Years spent on home duties | 12.76 | 17.21 | 12.70 | 17.14 | 0.17% | |
| Years in retirement | 0.34 | 2.43 | 0.33 | 2.39 | 0.05% | |
| Total | Years in full-time education or training | 6.87 | 2.52 | 6.72 | 2.71 | 2.26% |
| Years in employment, self-employment or farming | 14.29 | 15.59 | 14.22 | 15.58 | 0.45% | |
| Years in unemployment | 0.72 | 2.58 | 0.72 | 2.58 | 0.11% | |
| Years of illness/disabled | 0.33 | 2.65 | 0.32 | 2.59 | 0.03% | |
| Years spent on home duties | 6.48 | 13.88 | 6.41 | 13.77 | 0.20% | |
| Years in retirement | 0.68 | 3.00 | 0.67 | 2.97 | 0.06% | |
Table 3
Imputed variables.
| Imputed Variables | Personal Characteristics used (X) |
|---|---|
Years in full-time education or training Years in employment, self-employment or farming Years in unemployment Years of illness/disability Years spent on home duties Years in retirement |
Education, age, current employment status, chronic illness, retirement status, number of children in different age groups |
Table 4
Components of the employment status equations.
| Equations | |||||
|---|---|---|---|---|---|
| Variables Included in the Equations | In-Work | Self-employment | Job Sector | Occupational Pension Membership | Private Pension Membership |
| Age or Age group | Yes | Yes | Yes | Yes | Yes |
| Age Squared | Yes | Yes | Yes | ||
| Age 65 or above | Yes | ||||
| Education | Yes | Yes | Yes | Yes | Yes |
| Gender | Yes | Yes | Yes | Yes | Yes |
| Work Experience | Yes | ||||
| Gave Birth to a Child in the current year | Yes | Yes | Yes | ||
| Work in the Public Sector or Not | Yes | Yes | |||
| Job Industry | Yes | Yes | |||
| Job Occupation | Yes | Yes | |||
| Lagged variables | Yes | Yes | Yes | Yes | Yes |
| Mean value of residuals | Yes | Yes | Yes | Yes | Yes |
Table 5
Simulated profile without adjustment.
| Year | 1950 | 1951 | 1952 | 1971 | 1972 | 1973 | Total Years of Work | Rate | Simulated Eligibility | Actual Eligibility |
|---|---|---|---|---|---|---|---|---|---|---|
| Individual A | ● | ○ | ● | ○ | ○ | ● | 3 | 33.3% | Yes | No |
| Individual B | ● | ○ | ● | ● | ○ | ● | 4 | 66.7% | Yes | Yes |
| Individual C | ● | ● | ● | ○ | ○ | ○ | 3 | 0.00% | No | Yes |
| Yearly Aggregate | 3 | 1 | 3 | 1 | 0 | 2 | (1/3 correct) | |||
Table 6
Simulated profile with adjustment.
| Year | 1950 | 1951 | 1952 | 1971 | 1972 | 1973 | Total Years of Work | Rate | Simulated Eligibility | Actual Eligibility |
|---|---|---|---|---|---|---|---|---|---|---|
| Individual A | ● | ● | ● | ○ | ○ | ○ | 3 | 0.0% | No | No |
| Individual B | ● | ○ | ● | ● | ○ | ● | 4 | 66.7% | Yes | Yes |
| Individual C | ● | ○ | ● | ○ | ○ | ● | 3 | 33.3% | Yes | Yes |
| Yearly Aggregate | 3 | 1 | 3 | 1 | 0 | 2 | (3/3 correct) | |||
Table 7
Percentage of correctly simulated eligibility.
| Pension Type | Correctly Simulated | Number of Observations* |
| Contributory State Pension | 96.08% | 9,343 |
| Occupational Pension | 98.25% | 10,030 |
| Private Pension | 97.36% | 1,706 (Year 2000 onwards) |
-
*
Only those aged 66+ are included for state pension and those aged 65+ for occupational and private pension.
Table 1
| Variables | Equations | |||
|---|---|---|---|---|
| Years in full-time education or training | Years in employment, self-employment or farming | |||
| coefficient | s.e. | coefficient | s.e. | |
| College Education | 4.22 | 0.07 | −3.43 | 0.21 |
| Secondary Education | 2.17 | 0.07 | −1.66 | 0.21 |
| Age | 0.00 | 0.02 | 0.36 | 0.05 |
| Is Working | −1.02 | 0.13 | 7.37 | 0.37 |
| Illness | 0.16 | 0.14 | −1.99 | 0.42 |
| In education | −0.89 | 0.14 | 2.85 | 0.41 |
| Unemployed | −1.28 | 0.14 | 1.03 | 0.40 |
| Retired | −1.05 | 0.17 | 4.30 | 0.51 |
| Number of Children under Age 3 | −0.06 | 0.06 | 0.16 | 0.19 |
| Number of Children between Age 4 and 11 | −0.10 | 0.03 | 0.09 | 0.10 |
| Number of Children between Age 12 and 15 | −0.09 | 0.04 | 0.06 | 0.12 |
| Cohort Dummies | Yes | Yes | Yes | Yes |
| Number of Observations | 5,738 | 5,738 | ||
| Adjusted R-square | 0.48 | 0.90 | ||
Table 2
| Variables | Equations | |||
|---|---|---|---|---|
| Years in unemployment | Years of illness/disabled | |||
| coefficient | s.e. | coefficient | s.e. | |
| College Education | −1.05 | 0.11 | −0.02 | 0.10 |
| Secondary Education | −0.79 | 0.11 | −0.03 | 0.10 |
| Age | −0.01 | 0.02 | 0.05 | 0.02 |
| Is Working | −0.04 | 0.19 | −0.80 | 0.18 |
| Illness | −1.33 | 0.21 | 3.78 | 0.20 |
| In education | 0.61 | 0.21 | −0.23 | 0.20 |
| Unemployed | 3.91 | 0.21 | 1.17 | 0.19 |
| Retired | 1.01 | 0.26 | −1.46 | 0.24 |
| Number of Children under Age 3 | −0.03 | 0.10 | 0.07 | 0.09 |
| Number of Children between Age 4 and 11 | 0.06 | 0.05 | −0.04 | 0.05 |
| Number of Children between Age 12 and 15 | 0.10 | 0.06 | −0.13 | 0.06 |
| Cohort Dummies | Yes | Yes | Yes | Yes |
| Number of Observations | 5,738 | 5,738 | ||
| Adjusted R-square | 0.23 | 0.15 | ||
Table 3
| Variables | Equations | |||
|---|---|---|---|---|
| Years spent on home duties | Years in retirement | |||
| coefficient | s.e. | coefficient | s.e. | |
| College Education | 0.43 | 0.12 | 0.00 | 0.07 |
| Secondary Education | 0.40 | 0.12 | −0.01 | 0.07 |
| Age | −0.12 | 0.03 | 0.03 | 0.02 |
| Is Working | −2.35 | 0.21 | −0.25 | 0.12 |
| Illness | 0.62 | 0.24 | −0.05 | 0.13 |
| In education | −2.20 | 0.24 | −0.22 | 0.13 |
| Unemployed | −2.28 | 0.23 | −0.20 | 0.13 |
| Retired | −2.42 | 0.29 | 5.65 | 0.16 |
| Number of Children under Age 3 | 0.20 | 0.11 | −0.01 | 0.06 |
| Number of Children between Age 4 and 11 | −0.06 | 0.06 | −0.03 | 0.03 |
| Number of Children between Age 12 and 15 | 0.04 | 0.07 | −0.02 | 0.04 |
| Cohort Dummies | Yes | Yes | Yes | Yes |
| Number of Observations | 5,738 | 5,738 | ||
| Adjusted R-square | 0.03 | 0.74 | ||
Table 4
| Variables | Equations | |||
|---|---|---|---|---|
| Years in full-time education or training | Years in employment, self-employment or farming | |||
| coefficient | s.e. | coefficient | s.e. | |
| College Education | 3.47 | 0.07 | −0.54 | 0.29 |
| Secondary Education | 2.01 | 0.06 | −0.06 | 0.26 |
| Age | 0.02 | 0.01 | 0.05 | 0.06 |
| Is Working | 0.34 | 0.06 | 8.34 | 0.28 |
| Illness | −0.32 | 0.12 | 0.06 | 0.53 |
| In education | 0.21 | 0.11 | 2.79 | 0.48 |
| Unemployed | 0.96 | 0.13 | 4.00 | 0.55 |
| Retired | 0.53 | 0.13 | 26.78 | 0.59 |
| Number of Children under Age 3 | −0.07 | 0.05 | 1.26 | 0.23 |
| Number of Children between Age 4 and 11 | −0.03 | 0.03 | 0.27 | 0.13 |
| Number of Children between Age 12 and 15 | −0.06 | 0.04 | −0.75 | 0.16 |
| Cohort Dummies | Yes | Yes | Yes | Yes |
| Number of Observations | 5,725 | 5,725 | ||
| Adjusted R-square | 0.50 | 0.54 | ||
Table 5
| Variables | Equations | |||
|---|---|---|---|---|
| Years in unemployment | Years of illness/disabled | |||
| coefficient | s.e. | coefficient | s.e. | |
| College Education | −0.37 | 0.06 | −0.25 | 0.09 |
| Secondary Education | −0.30 | 0.05 | −0.26 | 0.08 |
| Age | 0.01 | 0.01 | −0.03 | 0.02 |
| Is Working | 0.18 | 0.06 | −0.26 | 0.09 |
| Illness | −0.20 | 0.11 | 2.55 | 0.17 |
| In education | 0.16 | 0.10 | −0.10 | 0.15 |
| Unemployed | 1.74 | 0.12 | 0.30 | 0.17 |
| Retired | 0.65 | 0.12 | 0.27 | 0.19 |
| Number of Children under Age 3 | 0.03 | 0.05 | −0.02 | 0.07 |
| Number of Children between Age 4 and 11 | −0.03 | 0.03 | −0.11 | 0.04 |
| Number of Children between Age 12 and 15 | 0.00 | 0.03 | −0.24 | 0.05 |
| Cohort Dummies | Yes | Yes | Yes | Yes |
| Number of Observations | 5,725 | 5,725 | ||
| Adjusted R-square | 0.06 | 0.05 | ||
Table 6
| Variables | Equations | |||
|---|---|---|---|---|
| Years spent on home duties | Years in retirement | |||
| coefficient | s.e. | coefficient | s.e. | |
| College Education | −1.87 | 0.34 | −0.10 | 0.07 |
| Secondary Education | −1.03 | 0.30 | −0.04 | 0.06 |
| Age | 0.22 | 0.07 | 0.03 | 0.02 |
| Is Working | −8.58 | 0.32 | 0.01 | 0.07 |
| Illness | −1.65 | 0.62 | 0.05 | 0.13 |
| In education | −5.04 | 0.56 | −0.01 | 0.12 |
| Unemployed | −7.31 | 0.64 | −0.02 | 0.13 |
| Retired | −34.35 | 0.69 | 8.96 | 0.14 |
| Number of Children under Age 3 | −0.66 | 0.27 | −0.03 | 0.06 |
| Number of Children between Age 4 and 11 | −0.03 | 0.15 | 0.03 | 0.03 |
| Number of Children between Age 12 and 15 | 0.42 | 0.18 | −0.05 | 0.04 |
| Cohort Dummies | Yes | Yes | Yes | Yes |
| Number of Observations | 5,725 | 5,725 | ||
| Adjusted R-square | 0.75 | 0.46 | ||
Table 7
| Male Employee Earnings | Female Employee Earnings | Self-employment Earnings | |
|---|---|---|---|
| College Education | 0.56 | 0.81 | 0.72 |
| (0.03) | (0.03) | (0.06) | |
| Secondary Education | 0.31 | 0.49 | 0.31 |
| (0.03) | (0.03) | (0.06) | |
| Work Experience (Years) | 0.09 | 0.05 | 0.03 |
| (0.00) | (0.00) | (0.00) | |
| Work Experience (Squared) | 0.00 | 0.00 | 0.00 |
| (0.00) | (0.00) | (0.00) | |
| Years of Unemployment) | 0.04 | 0.01 | 0.01 |
| (0.00) | (0.00) | (0.00) | |
| Gender (Male=1) | 0.44 | ||
| (0.06) | |||
| Total Number of Observation | 13678 | 10231 | 5092 |
-
(standard errors are reported in the parenthesis).
Download links
A two-part list of links to download the article, or parts of the article, in various formats.