Accrued pension rights in Belgium: Micro-simulation of reforms
- Université de Liège, Belgium
Cite this article
as: A. Jousten, S. Perelman, F. Sigismondi, E. Tarantchenko; 2012; Accrued pension rights in Belgium: Micro-simulation of reforms; International Journal of Microsimulation; 5(2); 22-39.
doi: 10.34196/ijm.00070
- Article
- Figures and data
- Jump to
Figures
Figure 1

Average ATD pension by age cohort – sample (2001 EUR).
Figure 2

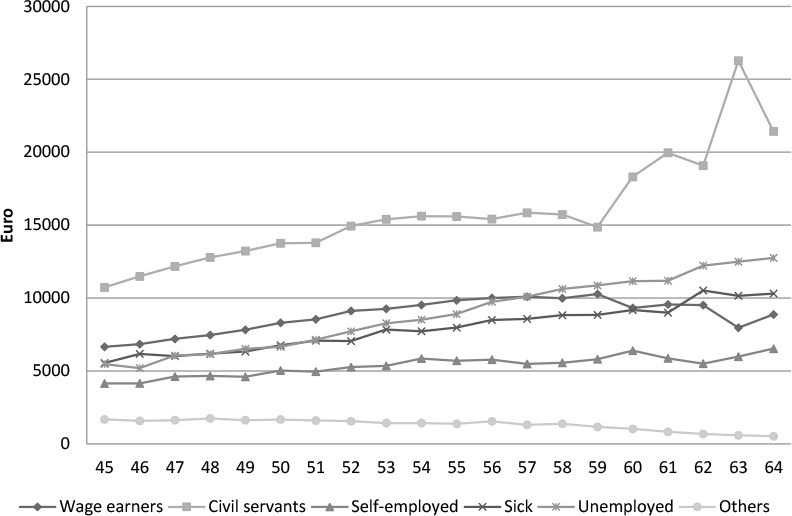
Average ATD pension by status: baseline scenario – sample (2001 EUR).
Figure 3a

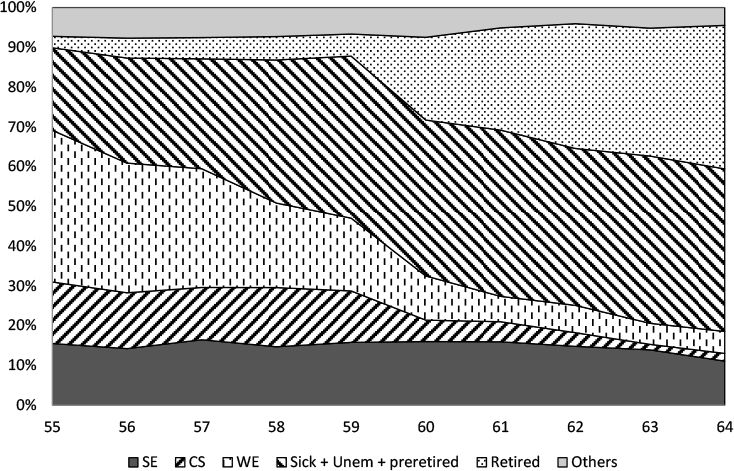
Population structure – Men ages 55–64 (2001).
Note: sample weights used.
Figure 3b

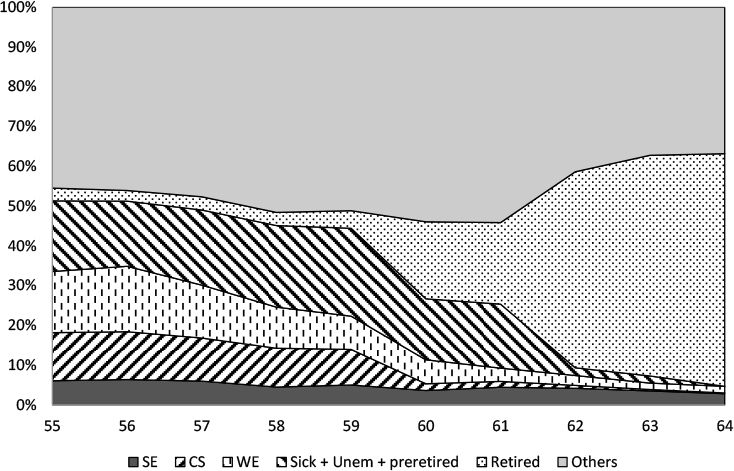
Population structure – Women ages 55–64 (2001).
Note: sample weights used.
Figure 4
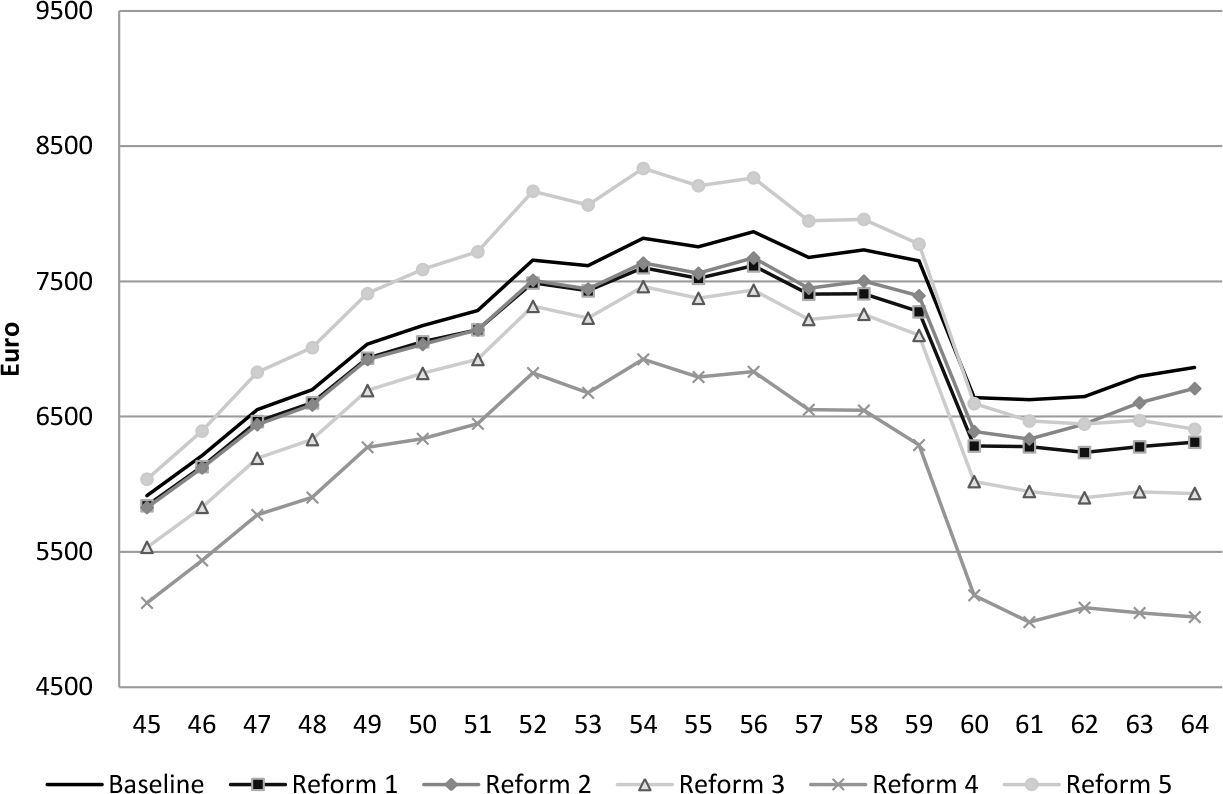
Average ATD pension by age cohort (ATD>0) – sample (2001 EUR).
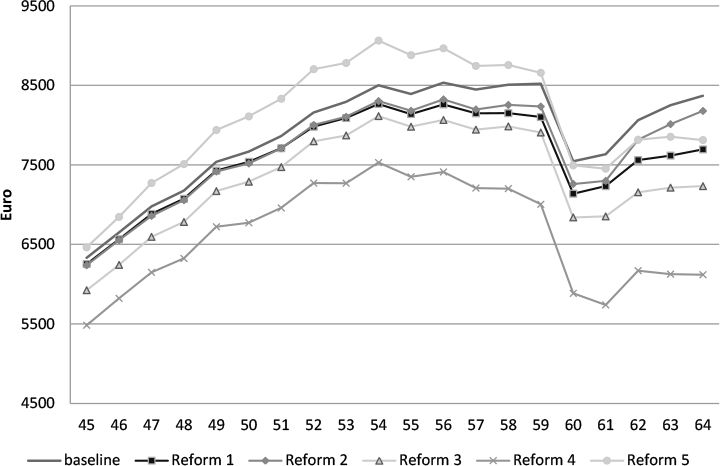
Figure 5a

Average ATD pension rights: Men ages 45–64 – sample (2001 EUR).
Figure 5b

Average ATD pension rights: Women ages 45–64 – sample (2001 EUR).
Figure 6a
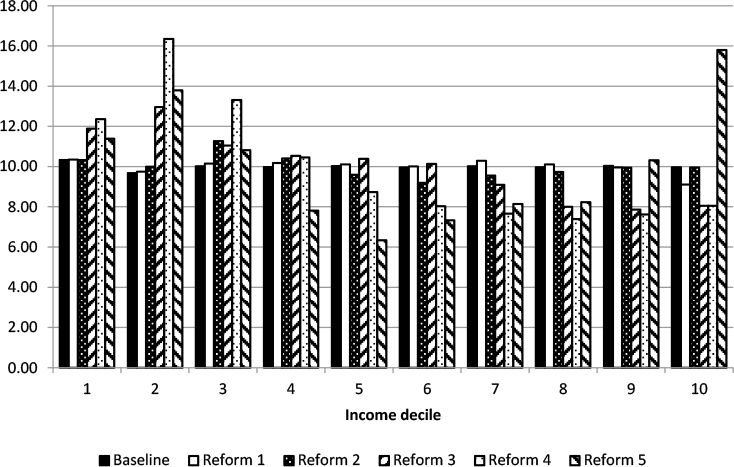

Distribution of individuals according to the ATD pension rights, Baseline deciles – Population Belgium 2001.
Notes: Sample weights used; the first decile is larger than 10 percent of the population because of the number of people with ATD = 0.
Figure 6b

Distribution of individuals according to the ATD pension rights, Baseline deciles – Population Flanders 2001.
Notes: Sample weights used; the first decile is larger than 10 percent of the population because of the number of people with ATD = 0.
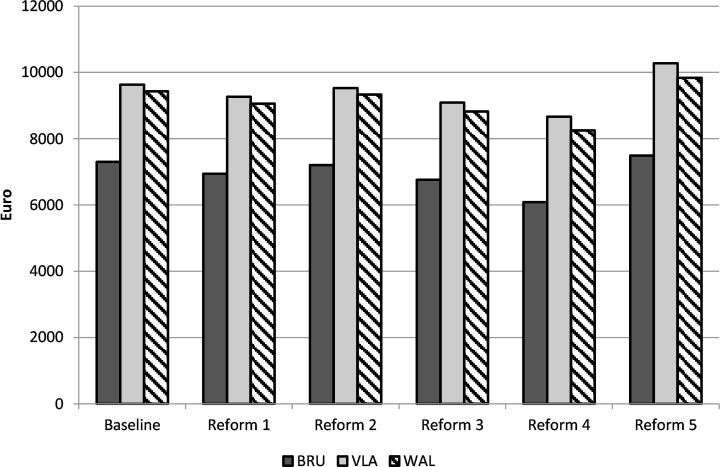
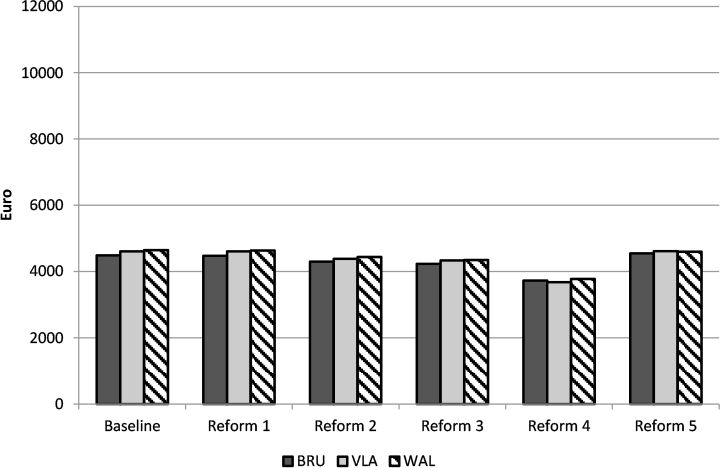
Figure 7

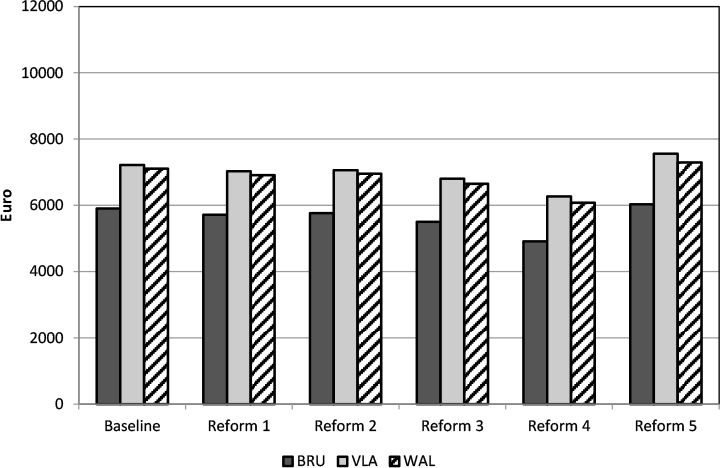
Average ATD pension rights by region – sample (45–64 years old – 2001 EUR).
Figure 8
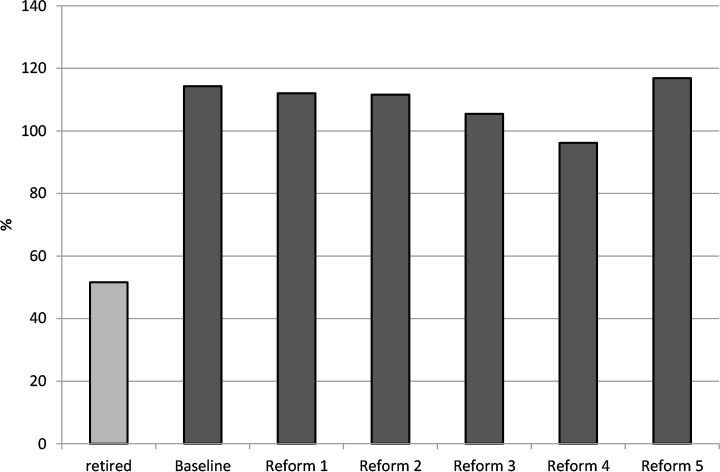
Present discounted value of pension rights as % of national GDP – Belgium, 2001 (black – non pensioners, grey – current pensioners).
Note: sample weights used.
Figure 9

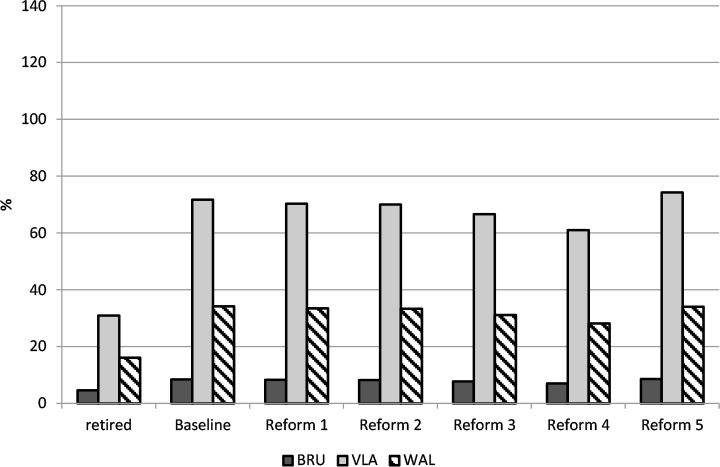
Present discounted value of pension rights as % of national GDP (18–64 years old, pensioners excluded) – Regional decomposition, 2001.
Note: sample weights used.
Figure 10

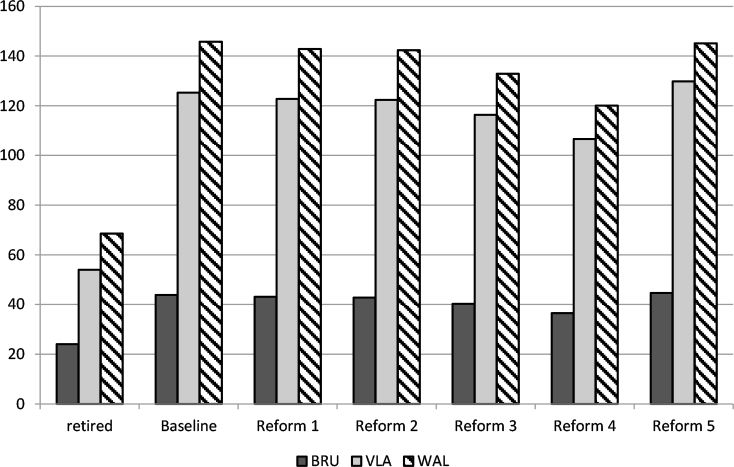
Present discounted value of pension rights as % of regional GDP(18–64 years old, pensioners excluded) – Regional decomposition, 2001.
Note: sample weights uses.
Tables
Table 1
Population aged 18–64, excluding pensioners and dependent children (in %) Belgium (1/1/2002).
| Gender and labor market situation | Age | Total | ||||
|---|---|---|---|---|---|---|
| 18–24 | 25–34 | 35–44 | 45–54 | 55–64 | ||
| Gender | ||||||
| Men | 52.8 | 50.4 | 50.5 | 50.3 | 51.3 | 50.3 |
| Women | 47.2 | 49.6 | 49.5 | 49.7 | 48.7 | 49.7 |
| Labor market situation | ||||||
| Wage earners | 78.6 | 60.6 | 50.9 | 37.8 | 16.8 | 46.9 |
| Self-employed | 4.2 | 8.8 | 11.9 | 11.3 | 11.5 | 10.4 |
| Civil servants | 2.0 | 5.2 | 11.7 | 16.0 | 9.6 | 10.1 |
| Sick / Disabled | 1.1 | 1.1 | 2.2 | 4.5 | 6.9 | 3.1 |
| Unemployed / Pre-retired | 14.1 | 9.5 | 7.5 | 9.8 | 23.6 | 11.6 |
| Others | 0.0 | 14.7 | 15.8 | 20.6 | 31.5 | 17.9 |
| Population (×1000) % of total population | 439.0 | 1,392.9 | 1,580 | 1,399.5 | 881.0 | 5,692.5 |
| 7.7 | 24.5 | 27.8 | 24.6 | 15.5 | 100.0 | |
-
Note: sample weights used.
Table 2
Key characteristics of reforms.
| Reform 1 | No spousal benefits | Elimination of the more generous “married couple” replacement rates |
| Reform 2 | No minima | Elimination of minimum pensions and of minimum earnings by year of work |
| Reform 3 | No imputed earnings | Imputed wages for periods of inactivity valued at 0 (assimilated days) |
| Reform 4 | Interaction effects | Reforms 2 and 3 together |
| Reform 5 | Career length | Elimination of minimum earnings by year. No imputed earnings. Pension benefits computed on the best 35 years of career. Full career: 35 years. |
Table 3
Distribution of gains and losses of annual ATD pensions: Ages 45–64 – sample (2001 EUR).
| Reform 1 | Reform 2 | Reform 3 | Reform 4 | Reform 5 | |
|---|---|---|---|---|---|
| % of losers | 11.9 | 28.0 | 65.2 | 70.3 | 24.9 |
| % of neutrals | 88.1 | 71.5 | 32.4 | 27.4 | 13.8 |
| % of winners | 0.0 | 0.5 | 2.4 | 2.2 | 61.3 |
| mean loss (k EUR) | −1,620 | −573 | −665 | −1,406 | −1,348 |
| mean gain (k EUR) | 0 | 587 | 271 | 505 | 992 |
| biggest loss (k EUR) | −4,386 | −6,620 | −8,538 | −13,727 | −10,472 |
| biggest gain(k EUR) | 0 | 2,478 | 2,078 | 2,903 | 7,956 |
| Gini coefficients | Baseline = 0.441 | ||||
| 0.439 | 0.454 | 0.453 | 0.502 | 0.465 | |
Table 4
Distribution of gains and losses of annual ATD pensions by sex: Ages 45–64 – sample (2001 EUR).
| Reform 1 | Reform 2 | Reform 3 | Reform 4 | Reform 5 | |
|---|---|---|---|---|---|
| Men | |||||
| % of losers | 22.1 | 23.7 | 67.8 | 71.7 | 22.2 |
| % of neutrals | 77.9 | 75.4 | 28.0 | 24.0 | 11.9 |
| % of winners | 0.0 | 0.9 | 4.3 | 4.3 | 66.0 |
| mean loss (k EUR) | −1,658 | −458 | −853 | −1,499 | −1,368 |
| mean gain (k EUR) | 0 | 587 | 289 | 506 | 992 |
| Women | |||||
| % of losers | 0.9 | 32.6 | 62.6 | 68.9 | 27.8 |
| % of neutrals | 99.1 | 67.4 | 37.1 | 31.1 | 15.8 |
| % of winners | 0.0 | 0.0 | 0.3 | 0.01 | 56.4 |
| mean loss (k EUR) | −658 | −662 | −448 | −1,302 | −1,330 |
| mean gain (k EUR) | 0 | 0 | 24 | 55 | 1,330 |
Download links
A two-part list of links to download the article, or parts of the article, in various formats.