Linking a microsimulation model to a dynamic CGE model: Climate change mitigation policies and income distribution in Australia
- Melbourne Institute of Applied Economic and Social Research, Australia
Cite this article
as: H. Buddelmeyer, N. Hérault, G. Kalb, M. van Zijll de Jong; 2012; Linking a microsimulation model to a dynamic CGE model: Climate change mitigation policies and income distribution in Australia; International Journal of Microsimulation; 5(2); 40-58.
doi: 10.34196/ijm.00071
- Article
- Figures and data
- Jump to
Figures
Figure 1
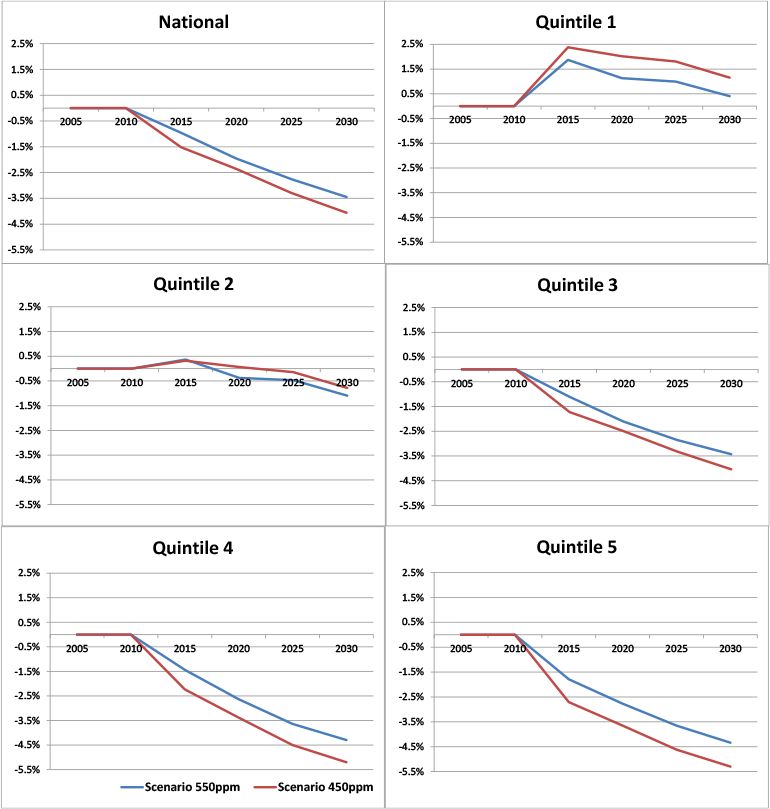
Average real net income per adult equivalent by income quintile: percentage deviations from the reference case.
Figure 2
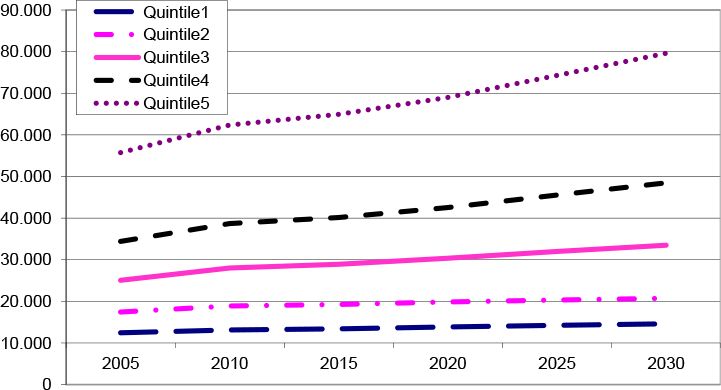
Average real net income per adult equivalent by quintile in the reference case (in financial year 2005/2006 dollars).
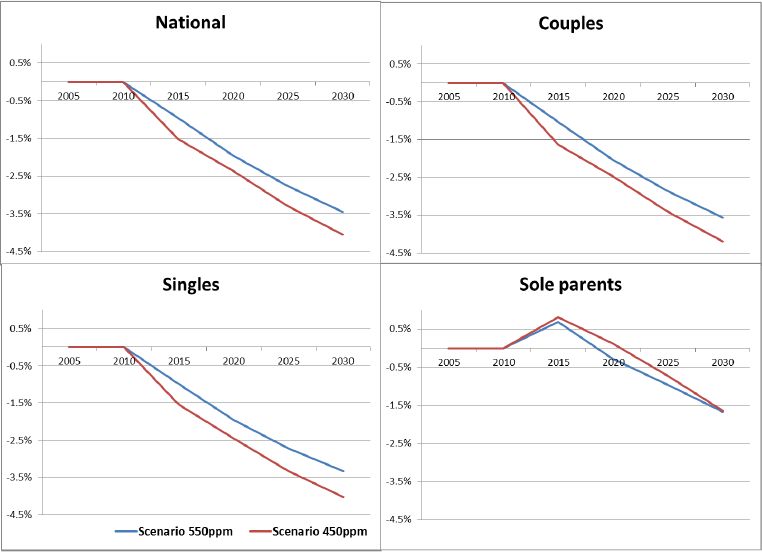
Figure 3

Average real net income per adult equivalent by household type: deviations from the reference case.
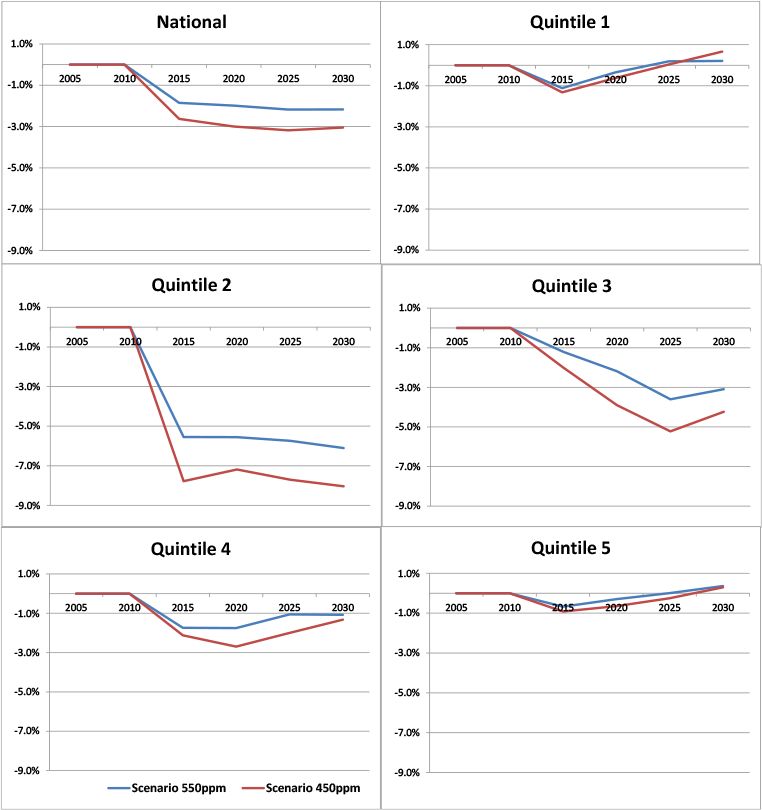
Figure 4

Gini coefficient within income quintiles: deviations from the reference case.
Figure 5

Gini coefficient by household type: deviations from the reference case.
Tables
Table 1
Computation of household real income for one particular household.
| 2005 (base) | 2010 | 2015 | 2020 | 2025 | 2030 | |
|---|---|---|---|---|---|---|
| Nominal household income | y0 | y1 | y2 | y3 | y4 | y5 |
| Cumulative price changes (63×1 vector) | P1 | P2 | P3 | P4 | P5 | |
| Budget shares (63×1 vector) | B0 | B1 | B2 | B3 | B4 | B5 |
| Real household income | y0 |
Table 2
Household income (in millions of dollars).
| 2005/2006 financial year | CGE model (MMRF) | MS model (MITTS) |
|---|---|---|
| Total household income | 886,422 | 562,478 |
| Labour | 447,962 | 371,716 |
| Non-labour factor income | 361,125 | 121,770 |
| Individual benefit payments | 77,336 | 68,992 |
| Unemployment benefits | 5,665 | 5,758 |
| Disability support pension | 8,257 | 7,148 |
| Age pension | 21,407 | 22,477 |
| Other individual benefit payments | 42,007 | 33,609 |
| Direct taxes on individuals | 114,624 | 113,795 |
| Direct taxes on enterprises | 45,435 | NA |
| Household disposable income | 726,363 | 448,683 |
Table 3
Aggregate income results: reference case.
| 2005 (base) | 2010 | 2015 | 2020 | 2025 | 2030 | |
|---|---|---|---|---|---|---|
| The MS model (MITTS) | $m/year | Cumulative percentage changes | ||||
| Gross income | 494,341 | 22.8 | 37.2 | 55.0 | 75.4 | 96.8 |
| Benefit payments | 65,936 | 1.3 | 9.2 | 17.9 | 26.9 | 35.7 |
| Income taxes + Medicare levy − rebates | 123,195 | 22.3 | 35.2 | 50.6 | 68.9 | 88.4 |
| Net income | 440,137 | 19.6 | 33.3 | 50.3 | 69.5 | 89.4 |
| Gross income + benefits | 560,277 | 20.3 | 33.9 | 50.6 | 69.7 | 89.6 |
| The CGE model (MMRF) | ||||||
| Gross income + benefits | 886,422 | 20.9 | 33.4 | 49.6 | 68.6 | 88.7 |
| Employment in 1000s | 10,058 | 12.4 | 20.0 | 25.9 | 31.2 | 36.4 |
| Basic necessities (a) | 48.4 | −1.4 | −2.8 | −4.6 | −6.2 | −7.7 |
| Energy bundle (a) | 11.6 | −0.1 | −0.5 | −1.2 | −1.7 | −2.2 |
| The MS model (MITTS) | Percentage | |||||
| Average tax rate | 24.9 | 24.8 | 24.6 | 24.2 | 24.0 | 23.9 |
| Benefit payments/Gross income | 13.3 | 11.0 | 10.6 | 10.1 | 9.7 | 9.2 |
-
(a)
Note: (a) Aggregate budget shares at percentage points. the national level (in per cent). Changes are expressed in percentage points.
Table 4
Lump sum transfers to households.
| 2005 | 2010 | 2015 | 2020 | 2025 | 2030 | ||
|---|---|---|---|---|---|---|---|
| Amounts in $ per year per capita | |||||||
| Government handout | Reference Case | 0 | 274 | 475 | 855 | 1,149 | 1,411 |
| Scenario – 550ppm | 0 | 274 | 303 | 546 | 760 | 948 | |
| Scenario – 450ppm | 0 | 274 | 190 | 437 | 650 | 845 | |
| Exogenous change in household income from carbon permit revenue | Reference Case | 0 | 0 | 0 | 0 | 0 | 0 |
| Scenario – 550ppm | 0 | 0 | 495 | 584 | 663 | 699 | |
| Scenario – 450ppm | 0 | 0 | 727 | 844 | 928 | 939 | |
| Total transfer | Reference Case | 0 | 274 | 475 | 855 | 1,149 | 1,411 |
| Scenario – 550ppm | 0 | 274 | 798 | 1,130 | 1,423 | 1,647 | |
| Scenario – 450ppm | 0 | 274 | 917 | 1,280 | 1,577 | 1,785 | |
| As a percentage of GDP | |||||||
| Total transfer | Reference Case | 0 | 0.50 | 0.81 | 1.36 | 1.71 | 1.98 |
| Scenario – 550ppm | 0 | 0.50 | 1.37 | 1.81 | 2.16 | 2.36 | |
| Scenario – 450ppm | 0 | 0.50 | 1.57 | 2.06 | 2.40 | 2.58 | |
Table 5
Ratio of new weights to original sample weights: reference case.
| 2005 | 2010 | 2015 | 2020 | 2025 | 2030 | |
|---|---|---|---|---|---|---|
| Decile 1 | 0.64 | 0.63 | 0.63 | 0.59 | 0.53 | 0.47 |
| Decile 2 | 0.77 | 0.79 | 0.82 | 0.80 | 0.77 | 0.71 |
| Decile 3 | 0.87 | 0.90 | 0.94 | 0.95 | 0.93 | 0.91 |
| Decile 4 | 0.94 | 0.99 | 1.05 | 1.09 | 1.08 | 1.07 |
| Decile 5 | 1.02 | 1.08 | 1.16 | 1.22 | 1.26 | 1.28 |
| Decile 6 | 1.10 | 1.18 | 1.27 | 1.38 | 1.42 | 1.50 |
| Decile 7 | 1.18 | 1.30 | 1.44 | 1.55 | 1.69 | 1.77 |
| Decile 8 | 1.30 | 1.45 | 1.61 | 1.77 | 1.95 | 2.15 |
| Decile 9 | 1.51 | 1.76 | 1.94 | 2.15 | 2.40 | 2.71 |
-
Note: This table should be read as follows: for 10 per cent of the records, the ratio of the new weight for 2005 (after reweighting) to the original sample weight is smaller than 0.64. For another 10 per cent of the records it is higher than 1.51.
Download links
A two-part list of links to download the article, or parts of the article, in various formats.