MIKMOD-ESt: A static microsimulation model of personal income taxation in Germany
- Fraunhofer FIT and Maastricht Graduate School of Governance, Germany
- Fraunhofer FIT, Germany
Abstract
MIKMOD-ESt is a microsimulation model of the German personal income tax. Developed and operated on behalf of the German Federal Ministry of Finance, MIKMOD-ESt is extensively used to evaluate numerous proposals for reforms of personal income taxation in Germany. The aim of this paper is to shed light on various aspects of the model. These include information on the microdata used for simulation (source and date, differences to other data sets) as well as the method for updating and uprating the data. Based on these information, advantages in comparison to other existing tax(-benefit) models as well as limitations of the current simulation model are discussed. Advantages are, e.g. the full inclusion of all taxpayers above a certain income threshold by using official tax returns or the possibility to conduct microsimulation analyses in a very detailed manner that allows for evaluation of very small and selective reforms. The main constraints are the restriction of the database to those currently obliged to file a tax return and the lack of information necessary to model the behavioural responses to tax changes.
1. Introduction
Thanks to the growing availability of microdata and increases in computing capacities, the use of microsimulation models has become very popular for informed policy making over the last decades (Gupta & Kapur, 2000). Particularly in the area of tax- transfer policies, a number of governments rely on microsimulation models for planning and forecasting purposes, among them the Scandinavian countries, Australia, Canada, and Hungary to name a few. This also applies to Germany where the German Federal Ministry of Finance developed a first microsimulation model for the personal income tax more than a decade ago.
Though utilisation of the first existing income tax microsimulation model used to be successful the Ministry was interested in an alternative solution. The motivation to outsource was to guarantee not only scientific accuracy but also political independence. Based on the initial model the research institute Fraunhofer FIT was commissioned a project to further improve and thereafter maintain the model on behalf of the Ministry. The respective project started in 2007 and led to the development of MIKMOD-ESt, a static microsimulation model for the evaluation of personal income taxation which is programmed in Java.
In the first place MIKMOD-ESt is used for policy advice and not for scientific research. The outcomes of a number of different income tax policy reforms can be estimated with the model. In addition, various figures related to income taxation, which are periodically published by the German government, are calculated on basis of the model. For instance, such figures are the amount of income tax revenue generated in a certain year, the income deciles of taxpayers or the number of taxpayers who profit from child allowances.
The aim of the present paper is to shed light on various aspects of the model. These include information on the microdata used for simulation as well as the method for updating and extrapolation of the data. Section 2 starts with a brief description of the microdata used for MIKMOD-ESt as well as the methods for updating and uprating the data. The section also gives a short overview of the advantages and disadvantages of the microdata used in comparison to other available data sources. Next, the general calculation of the income tax liability within the model is sketched in Section 3. The following Section 4 turns to selected examples of applications of the model. In addition, the section contains a discussion of potentials for further development. Section 5 concludes.
2. The MIKMOD-ESt model’s database from official income tax statistic
MIKMOD-ESt is based on a unique microdata set of official tax returns provided by the German Statistical Office. The German Statistical Office – through its Statistical Offices in the German States – collects the tax return data for each of the approximately 30 million taxpayers. In general, taxpayers are either unmarried singles or married couples. Currently the latest data available are those for the year 2006.
For exclusive use within the microsimulation project for the Ministry of Finance a representative, stratified 10% sample is drawn out of the population data1. The stratifying approach ensures that all taxpayers from the top of the income distribution are contained in the sample. That is to say in contrast to taxpayers with medium or low incomes the high income cases get an individual weighting factor equal to one. These observations are of major importance for microsimulation modelling since the taxpayers from the top decile of the income distribution contribute about 55 percent of personal income taxes paid (see Bundesministerium der Finanzen, 2012). The 10% sample provides information on more than one thousand different variables for each of the cases. Nearly all characteristics of each taxpayer are included that are relevant for tax determination, e.g. sources and amounts of incomes, deductions, child allowances, taxable income, and amount of income tax, of church tax and of solidarity surcharge paid. Moreover some limited information on socio-economic characteristics is included as well like gender, age, state of residence, and economic activity of entrepreneurs. Before the administrative tax data can be used within the microsimulation model, the data has to be processed in an approach that basically consists of four independent steps: reduction of the sample size, reduction of the number of variables used, imputation of missing information, and extrapolation of the data.
For the purpose of an easier handling and to meet the sometimes tight time constraints in the policy consulting context the initial 10% sample has to be reduced. The aim is to reach a run time of the model of approximately one minute, which allows for use of the model for the Minstry’s purposes and to quickly answer requests2. Hence, both the sample size and the number of variables are downsized. In order to precisely map the aggregate tax statistics in line with the explanation given above, taxpayers from top of the income distribution are fully incorporate in the downsized subsample. Thereby, we arrive at a reduced final sample that includes all taxpayers with total revenue above a threshold of 500,000 Euros and a randomly drawn subsample of taxpayers with lower incomes. The final sample size is about 485,000 observations, from which 45,000 belong to the top of the income distribution.
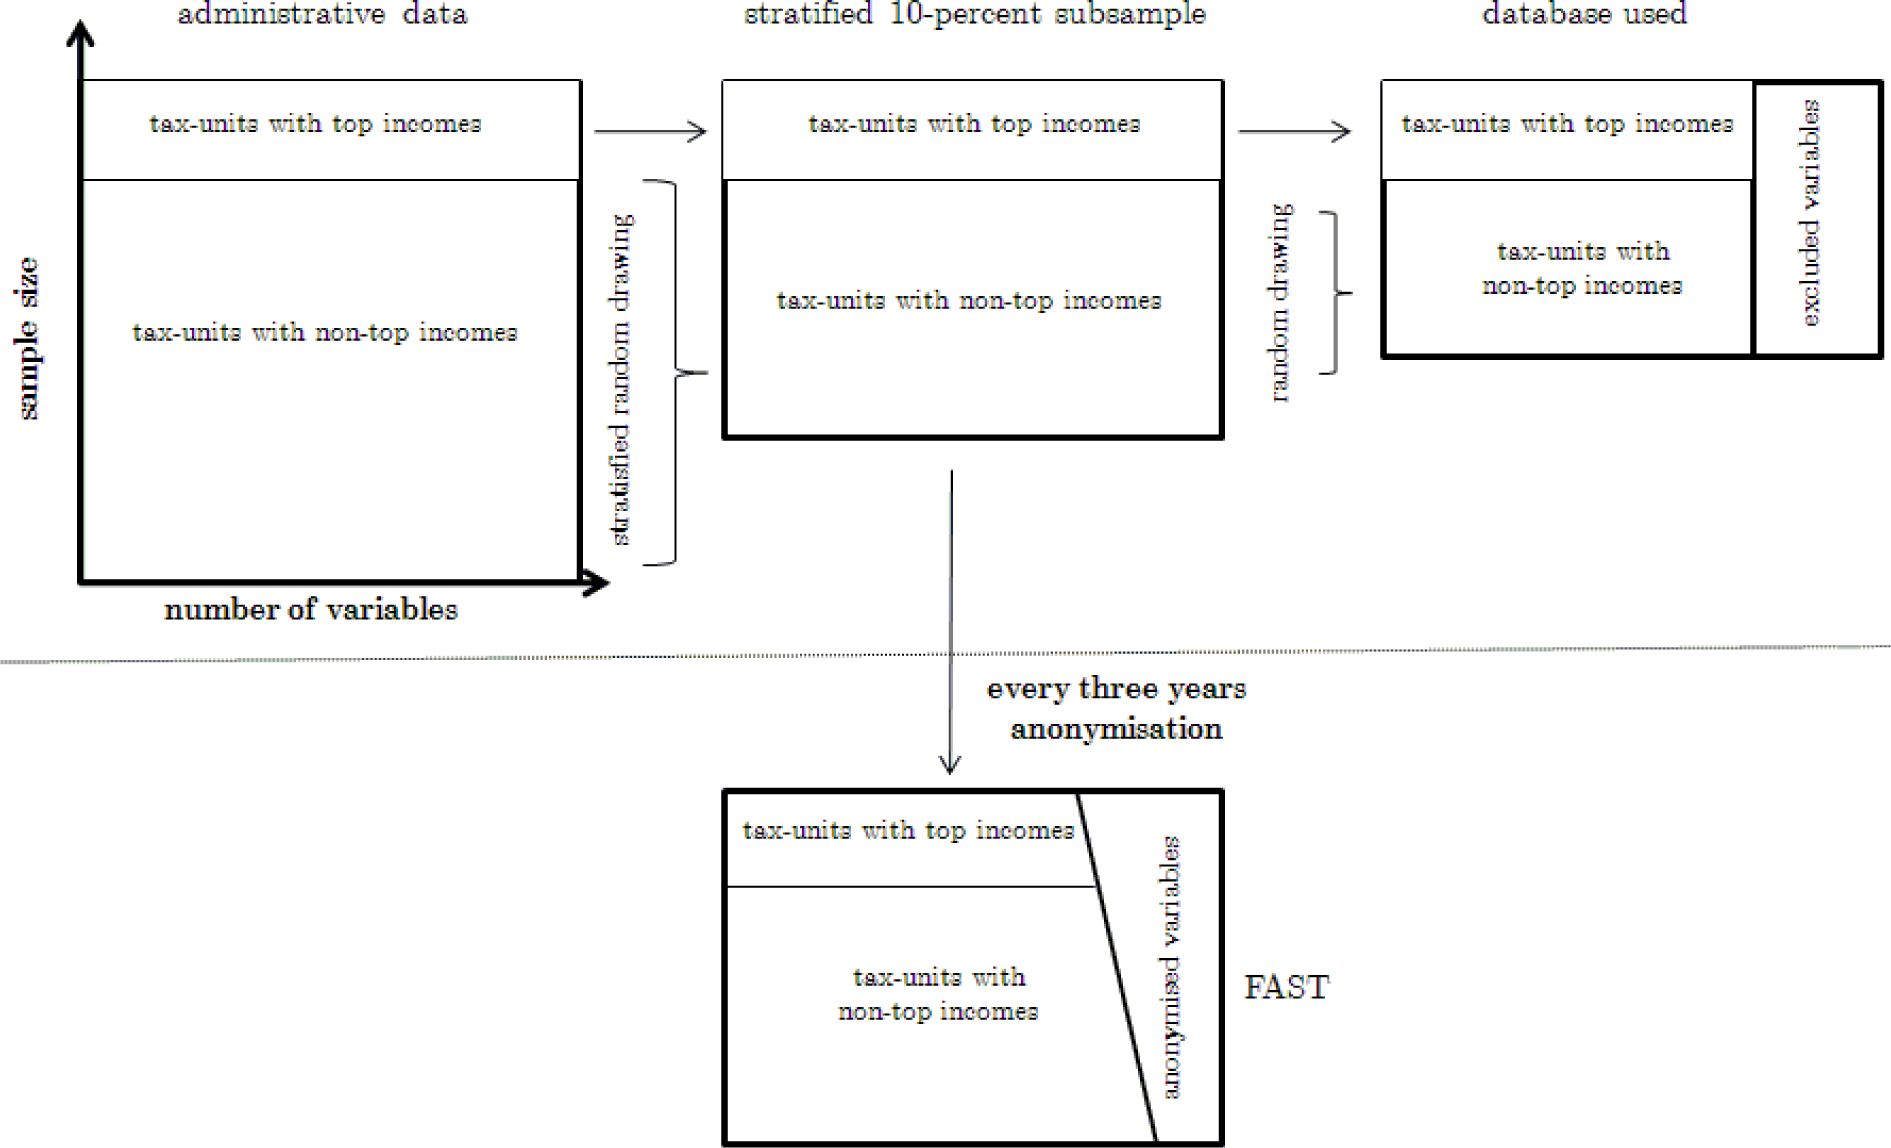
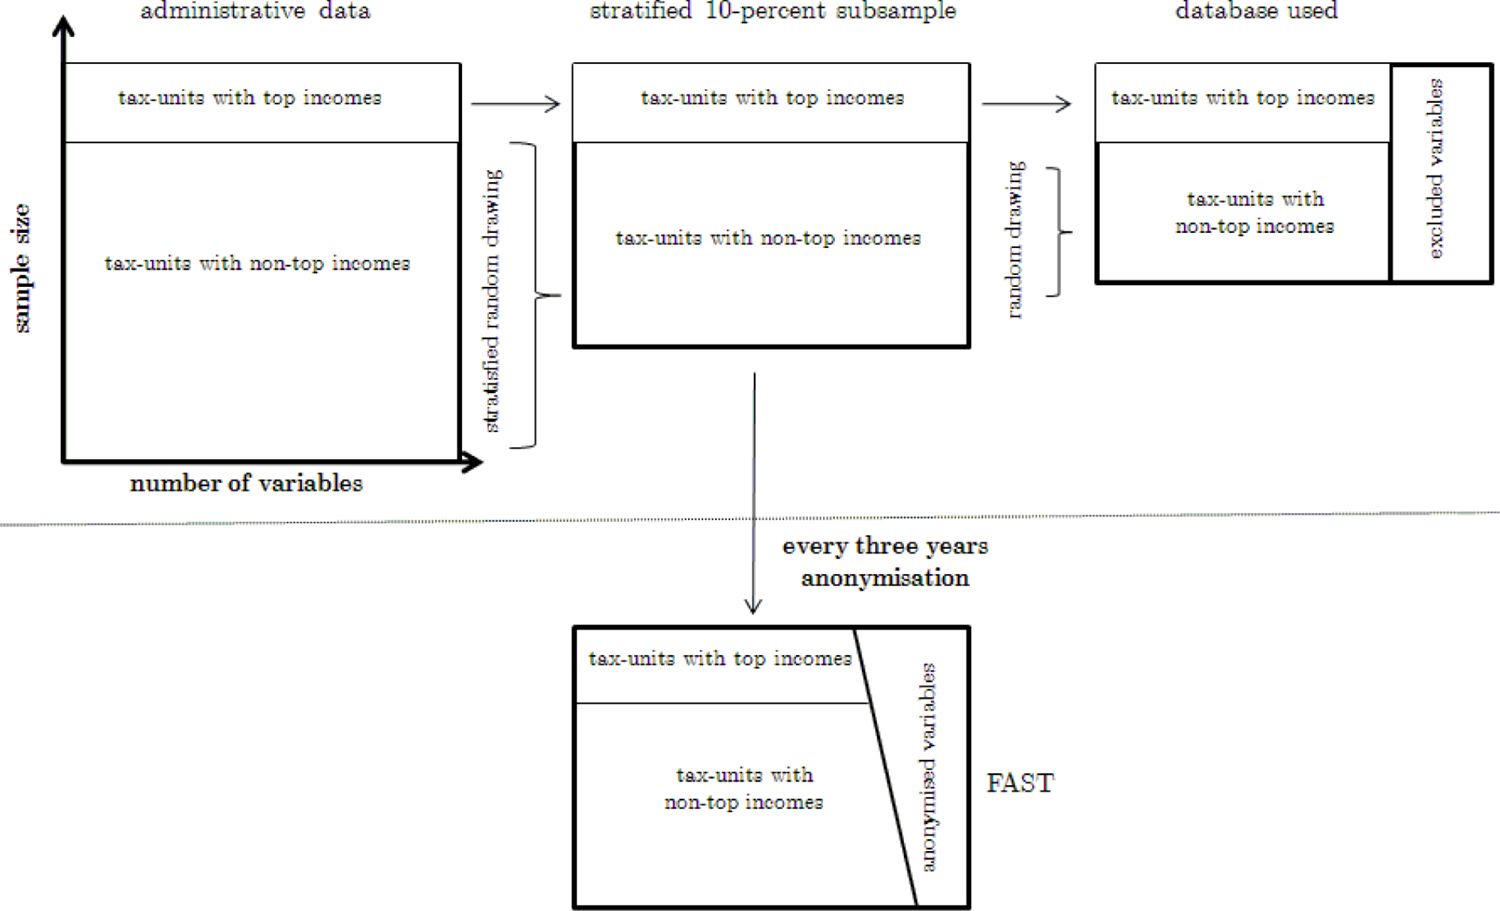
Furthermore, several input variables are summarized and others are deleted which are not essential for the calculations. For instance, very detailed data on specific tax issues can be lumped together with no effect on the calculation of the tax liability. Thereby, the total number of variables used within the model is concentrated to about 180, about one fifth of the variables initially provided in the 10% sample. The upper part of Figure 1 illustrates the approach taken to arrive at the final subsample. The horizontal size of each rectangle illustrates the number of variables in the sample while the vertical height sketches the number of observations. The scientific use file FAST, which is also shown in Figure 1, is introduced later on.
Database generation.
After drawing a stratified subsample of the data and adjusting case specific weighting factors, the data are checked for inconsistencies and missing values are imputed. Even after condensing the data a substantial number of variables with detailed information on each taxpayer is available in the sample. However, due to some limitations in the original administrative data (mainly concerning child benefits and child allowances) a number of imputations have to be made.
The general approach is to take those variables as given, which are the results of the official tax assessment like taxable income or the final tax liability. Then the aim is to recalculate these official figures. In those cases where full information about all input variables is given in the data this permits the identification of inconsistencies whenever differences between our calculations and the official values are observed. In cases where specific input variables are missing, existing information on input variables of all similar cases is used. Hereby, the large size of the data base is an asset as it yields reliable information on the distribution of the majority of input variables. In this way, missing values can be imputed such that the calculations made for a particular case with lacking information finally matches the official result, i.e. tax liability3. Further imputations concern missing values in the data for those cases where the tax law grants lump-sum deductions and taxpayers provide no information about their expenses below the lump-sum. After the modifications it is possible to precisely recalculate current tax liabilities for more than 99 percent of the cases in the sample. As regards the remaining unsolved cases the initial input values from the income tax statistics are used and inconsistent values are replaced by the results of our own tax calculation.
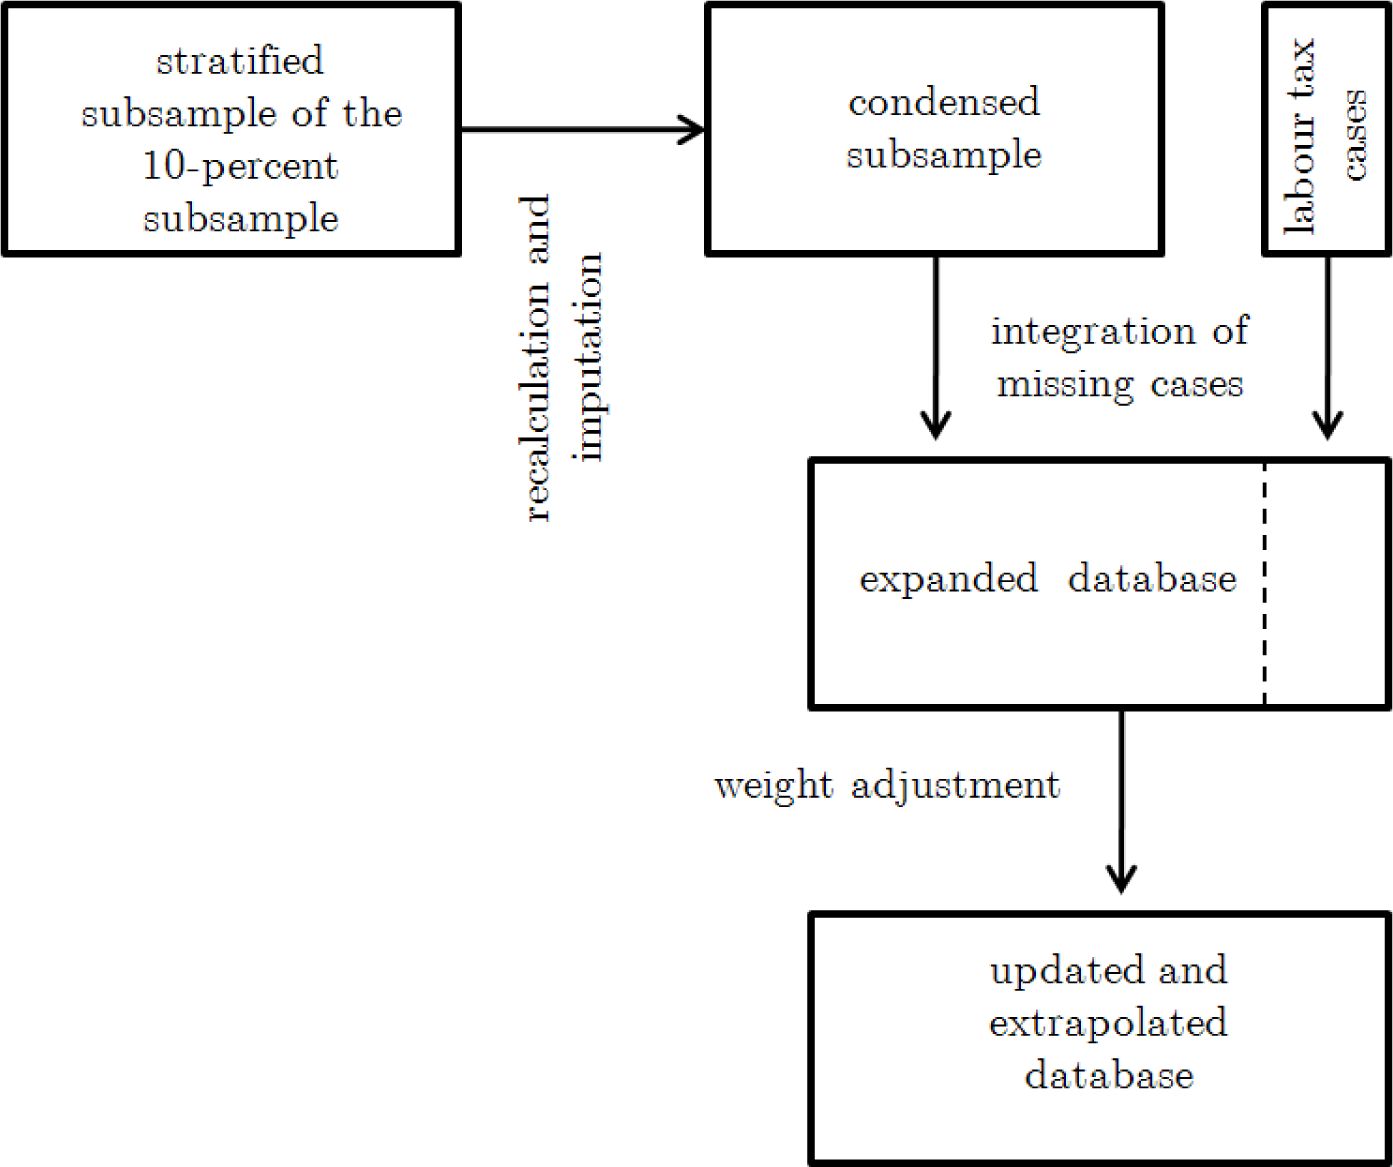
The administrative data of 2006 and hence the condensed subsample only include those cases for which a tax assessment took place, i.e. taxpayers who formally declared their incomes. Data for the sizeable population of persons paying source taxes on labour income only and not filing the tax returns are available only every third year, most recently 2004. Even though the data on these non-filers does basically include information only on wages and no information on other income sources, incorporation is necessary because these observations represent approximately 9 million out of the 30 million taxpayers. Income information of the labour tax cases from 2004 is extrapolated to 2006 according to the economy-wide development of wages. As depicted by Figure 2 in a second step the condensed sample is expanded by adding the extrapolated labour tax cases.
In a final step, the expanded database is updated and extrapolated to the years of analysis (i.e. on basis of the 2006 database it is updated for all years up to 2016) using static ageing techniques. The approach taken is to adjust the weighting factors in order to allow for changes in global structural variables whilst different types of income sources are updated according to the observed aggregated values and extrapolated on basis of the Federal Ministry of Finance’s annual tax estimate as well as on estimates of the Federal Ministry of Economics.
The method applied follows Quinke (2001), who employs an approach that compares the weighted cases of the sample data to aggregated macroeconomic statistics. He utilizes an algorithm based on the Minimum Information Loss Principle and the standard Newton-Raphson solution, which is quite similar to Merz’s “Adjust” reweighting algorithm (Merz, 1994). A comparison is made with respect to family structure (taxpayer units consisting of single taxpayers or married couples), age, state of residence (East Germany versus West Germany), number of taxpayers with gross income subject to mandatory social security contributions, number of civil servants, number of business man and self-employed, number of pensioners and the number of child allowances. Adjustments are made for all years of the analysis and the resulting weighting factors for each single year are stored as additional variables in the sample. Moreover, factors to update the data of the base year are kept in a parameter file for each category of income and for each year of the estimation period, i.e. 2007 till 2016. The MIKMOD-ESt programming code assesses these parameters during the calculations to update the original values.

Data processing.
What distinguishes MIKMOD-ESt from other tax-transfer models in Germany4 is the use of the unique database as described above. Thereby fiscal and distributional impacts of a wide range of tax reforms can be evaluated in much more detail than would be feasible using other German data sets. Two major alternative data sets are the scientific-use file of the income tax data (FAST) and the German Socio-economic panel (GSOEP)5.
In comparison to the FAST the sample used by MIKMOD-ESt is favourable in terms of currentness of the data6 and its lower degree of anonymization. The difference in the degree of anonymization is shown in the lower part of Figure 1. In particular, anonymization of the cases of the FAST increases with categories based on revenues of the taxpayer (see Merz et. al., 2006, and Buschle and Schwabbacher, 2010, for a more detailed description). Consequently, detailed simulations for top income households are rather difficult using the FAST. Another advantage of the official tax return data lies in its huge size. Compared to approximately 12,000 household observations for instance offered by the GSOEP, even the subsample used by MIKMOD-ESt with just below 500,000 observations allows in-depth distributional analysis as well as analysis of very specific tax issues in a way not possible with survey data7. While the analysis of smaller subgroups such as groups differentiated by age or federal state quickly reach limitations in the number of observations in the GSOEP they are possible using MIKMOD-ESt. Another drawback of the survey data like the GSOEP is the shortfall of a number of tax relevant information, an incomplete coverage of certain types of income8, and the lack of representative data on the top of the income distribution. A major advantage of the GSOEP data is given by the fact that it offers a large number of socio-economic variables not included in the administrative data, which for example allows adding more important dimensions when analysing distributional effects, or, in the case of information on hours worked, open the possibility to model behavioural effects. Moreover, as the GSOEP data represents the entire population, also those cases are included that do not pay income taxes. Thereby a more complete picture of the lower end of the income distribution is given that allows to model the benefit system as well. These latter two advantages of the GSOEP are clear shortcomings of the MIKMOD-ESt model’s data base.
In summary, it becomes clear that despite its strength MIKMOD-ESt is highly context specific. For the particular needs of the German Federal Ministry of Finance, where reliable estimations on the short-term effects of relatively small changes in personal income taxation must be carried out, the advantages of administrative tax data clearly dominate the disadvantages when compared to other data sources. Finally, it has to be noted that these advantages of using the exclusive access to less anonymized data come at a cost for researchers working on behalf of the Ministry: Scientific publications based on these data are highly restricted and publication of results is virtually impossible due to strict data-protection laws. This even includes publication of aggregate simulation results.
3. Modelling german personal income taxation
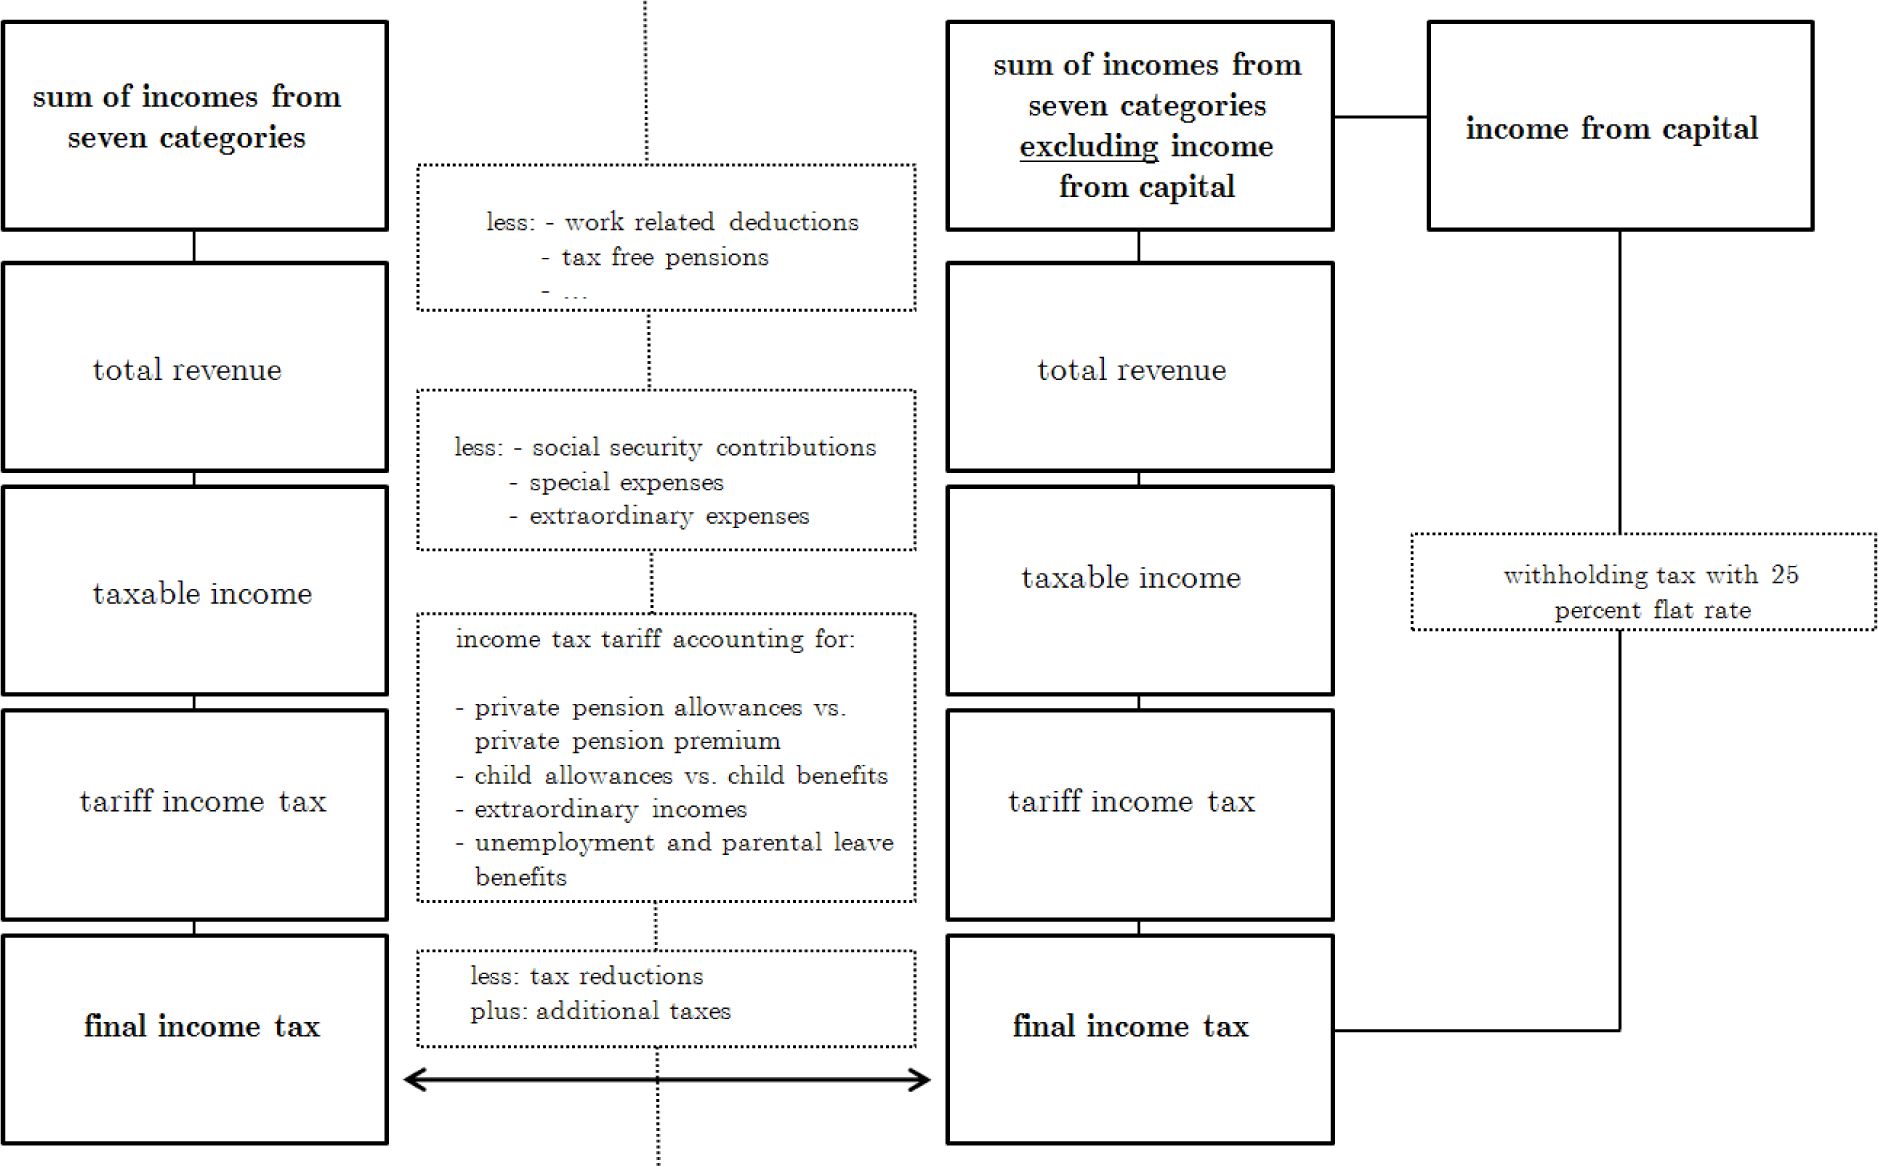
German personal income tax legislation is very comprehensive. Hence, the steps for income tax calculation with MIKMOD-ESt are presented in a simplified manner. Peichl and Schaefer (2009) can be consulted for a similar overview that in addition includes some numerical details which are left out in the general description below. Figure 3 summarizes the five major steps of tax calculation in the boxes on the left-hand side. For each observation in the data base these calculation steps are undertaken in the tax model.

Modelling German personal income taxation.
First, the sum of incomes from seven different categories as specified by the tax code is determined. The seven categories are income from agriculture and forestry, business, self-employment, salaries and wages of those in dependent employment, capital and dividends, rental income, and other incomes like annuities from pension funds. If income is received in one of these categories certain deductibles can be subtracted like work related deductions, tax free parts of pension benefits, and other specific allowances. Note that the determination of deductions and tax-free parts of the income itself may include several calculations to make a comparison between actual values and lump-sum amounts. In line with German tax legislation the outcome selected within the model is the one preferable from the taxpayer’s perspective. After subtraction of deductions total revenue is obtained.
In a next step, social security contributions are derived, which are not subject to taxation but deductible from taxable income before hand. Again, this involves different calculations that have to be performed next to each other in order to determine the final amount of deductible contributions, i.e. the one that minimizes a certain taxpayer’s taxable income9. Further reductions are related to other expenses such as the church tax, donations for charity, school fees, expenses for child care, or expenses for education of other dependants, as well as a possible deductible fraction of expenses for special medical needs or a given degree of disability. If a taxpayer qualifies for such reductions, they are subtracted from total revenue and eventually lead to a first version of taxable income10.
To arrive in a fifth step at the final amount of taxable income alternative calculations have to be made again for two specific positions. Namely, these positions are private pension contributions on the one hand and child allowances versus child benefits on the other. In both cases the German legislator offers either a direct transfer payment or a tax deduction whatever is favourable form the taxpayer’s perspective. Even without the legislator’s specification as in the case of child allowances and private pension contributions the optimal choice from the taxpayer’s perspective is always the guiding principle when modelling alternatives within the model. In such cases different possibilities of calculation have to be performed next to each other to decide afterwards which option is chosen, according to the outcomes. That is to say it has to be determined whether a direct payment receivable exceeds the difference between a tax payment based on a taxable income without reduction by a possible allowance and tax payment based on a taxable income lowered by such an allowance. Thereby, the optimal choice for the taxpayer is selected as prescribed by the tax law. where necessary, this also includes the special treatment of extraordinary incomes, 11 e.g. compensations for longer-term activities, and the application of a progression reservation among others on unemployment and parental leave benefits. The latter benefits are basically tax free. However, they are included when determining the average tax rate on taxable income. Due to increasing marginal tax rates in Germany, this leads to an increased average tax rate on taxable income.
In order to obtain the final tax liability tax payments based on the tax tariff need to be adjusted by tax reductions (e.g. payments for craftsmen or other household services, business taxes paid) and additional taxes. Eventually this final income is the tax base for personal income taxation, the solidarity surcharge and the church tax. For those cases that have just paid source taxes, the calculations are limited to the tariff income tax which is equal to the final tax liability in these cases.
For cases with capital income, calculations have become even more complex with the introduction of a withholding tax on capital income in 2009. According to the new law, taxpayers can choose between the alternative to tax their entire income from capital within the personal income tax or isolated from other types of income instead. In the latter case, a withholding tax with a flat rate of 25 percent is applied. After the five steps of the tax calculation the whole simulation has to be run a second time in case a taxpayer has income from capital. In the second run it is tested whether the sum of tax payments from the withholding tax and personal income taxes on incomes except income from capital is lower or higher than the tax payments obtained from the first calculation (right-hand side of Figure 3). Since no information can be found in the data whether a tax-unit chooses to tax its income from capital within the personal income tax or under the flat rate tax the guiding assumption again is that each tax-unit chooses the alternative which minimizes total tax payments in that year. The second loop through the five major steps of the calculation routines and the decision for or against the flat rate tax closes a complete simulation using the MIKMOD-ESt model.
4. Applications and further developments
In practice, MIKMOD-ESt is extensively used in advance of many policy reform projects as well as for the estimation of the fiscal effects of tax reductions within the currently existing law. These estimations are initiated and financed by the German Federal Ministry of Finance. The model is regularly employed for the fiscal evaluation of family policies such as the total amount of forgone tax revenue because of child allowance, the share of transfers incorporated in the child benefit, tax reliefs due to income splitting for married couples, (limited) income shifting between divorced taxpayers, or the tax allowance for lone parents. Within MIKMOD-ESt the procedure is always to compute tax payments for each observation of the data sample first under the law applicable in the year of consideration. To do so, the different tax codes for the years between 2006 and 2012 are incorporated in the model, either via tax parameters or directly in the programming code. In a second step, calculations are repeated under a changed tax law. To simplify the application of MIKMOD-ESt, modifications analysed more frequently can be done via parameter change while more complex or less frequently requested modifications of the law need changes in the programming code.
In addition, the model is used as the basis for distributional analysis, such as group wise differentiations of contributions to total tax revenue according to the amount of the taxpayer’s individual revenue or taxable income. Other evaluations are concerned with the fiscal effects of allowances for social security contributions or the taxation of pensioners. Results derived by the MIKMOD-ESt model are regularly published by the German Federal Ministry of Finance as part of reports for the OECD, the European Commission and the German public (Bundesministerium der Finanzen, 2012; Adema et. al., 2011, pp.60; European Commission, 2011, p.419). Most recently, the model was used in collaboration with the German Statistical Office to evaluate possible changes from the implementation of a community surcharge on income taxes paid, which was intended to compensate communities for losses from a possible abolishment of the current business tax (Schwabbacher et. al., 2011). The model was also used to estimate tax losses and distributional effects for different alternatives of a better deductibility of health insurance contributions (Deutscher Bundestag, 2009). A corresponding and indeed quite complex reform of the tax deductibility of health insurance contributions with an estimated total tax relief of about 10 billion Euros per year actually took place in 2010 and parts of our estimates directly entered the bill.
Given the growing possibilities for working with process data on tax payments within the last years, a future intention is to incorporate available information on capital and business taxes paid on the firm level in our data set. This may facilitate simulations concerning the effects of tax changes at the corporate level on the personal income tax paid on the individual level. Moreover, this would make calculations of the total individual tax burden possible.
Until now an unsolved problem is posed by the earlier mentioned withholding tax on capital income in 2009: Starting with the micro data from 2009 this withholding tax is in place and information on large amounts of capital income will be potentially lost. This is the case especially for high income taxpayers, since when choosing between the withholding tax with its flat rate of 25 percent or taxation within the personal income tax, only for small incomes the treatment of capital gains within the usual personal income tax is preferable. All income groups that face a marginal tax rate above 25 percent will hence opt for taxation of capital gains under the source tax scheme at the favourable rate of 25 percent. As a consequence, information on capital gains will no longer be available in the tax return data for all income groups but the ones with small incomes. However, as has been previously explained the major parts of tax revenue result from higher income groups. Therefore, missing information on capital gains, which contribute a large part of total income for a number of cases of taxpayers who belong to the higher end of the income distribution, lead to a non-negligible loss in precision of modelling total tax revenue from the respective income category. As appropriate microdata on capital gains do not exist outside the tax statistics, imputation or matching procedures are not possible. In the short run, it would be possible to use information on capital income from the 2008 data for future years, but in the long run an alternative solution for this missing data problem has to be found.
5. Conclusion
Micro data analysis has become a key instrument for informed policy making over the last decades in numerous countries among them Germany. Accordingly, the expansion of independent and reliable scientific tools was promoted. One such project is the development of MIKMOD-ESt a personal income tax microsimulation model on behalf of the German Ministry of Finance. The use of data anonymized to the lowest possible degree which is still compatible with German law allows in-depth distributional as well as fiscal analysis of different reforms. Effects for a variety of reform options can be calculated very precisely and results of the model have a great importance for policy makers. However, due to the restrictive legislation on data protection policy in Germany the model cannot be used for purely scientific analysis. In addition, the focus on current taxpayers and on the attributes necessary for the calculation of income taxes makes the model unsuited for the analysis of major reforms of the tax system where taxation is expanded to previously unaffected persons or where significant behavioural responses can be expected.
Footnotes
1.
For a more detailed description of the data and the sampling method see Merz et. al. (2006).
2.
Depending on the machine used and the year simulated, the time for one simulation varies between 30 and 80 seconds. Each simulation thereby comprises up to 17 million calculations of the tax-tariff.
3.
Imputation of missing values is of particular importance for the calculation of child allowances since the given data only contain information about the total child allowance, whereas according to German personal income tax law there are many circumstances where it is necessary to have information on each individual child on how long and to what amount an allowance had been granted or not. As the number of children for which a taxpayer receives child allowance is given in the data, the amount of allowance for each child can be estimated.
4.
Refer to Wagenhals (2004) for an overview of the different models.
5.
GSOEP is a representative panel study of private households in Germany conducted for more than 25 years (Wagner et. al., 2007).
6.
For details refer to Lietmeyer et. al. (2005).
7.
It has to be emphasised that both databases differ with respect of the type of socio-economic unit observed: while the unit considered by the administrative data is the taxpayer the unit offered by the survey data is the household, which may consist of one or more tax payer units.
8.
Capital and business incomes are not well represented in the GSOEP data (Bork, 2000).
9.
Until 2009 this involved the comparison of two alternative methods for considering social security contributions. From 2010 onwards, this involves a comparison between three different methods.
10.
It is worth mentioning that the model recalculates church taxes on the basis of changes in the final income tax, which forms the assessment base for the church tax (despite some exceptions w.r.t. the treatment of children). Accordingly, for those paying church taxes, taxable income changes. To solve this problem, an iterative process is modelled where personal income taxes and church taxes are calculated until no significant changes occur from one iteration to the next
11.
In order to minimize the effects from increasing marginal tax rates on income from longer-term activities, these incomes are divided in a first step by the factor five. Then the tax debt on these incomes equals five times the tariff tax on the divided incomes.
References
-
1
Is the European Welfare State Really More Expensive?: Indicators on Social Spending, 1980–2012; and a Manual to the OECD Social Expenditure Database (SOCX). OECD Social, Employment and Migration. Working Papers, No. 124OECD Publishing.
-
2
Steuern, Transfers und private Haushalte. Eine mikroanalytische simulationsstudie der Aufkommens-und VerteilungswirkungenSteuern, Transfers und private Haushalte. Eine mikroanalytische simulationsstudie der Aufkommens-und Verteilungswirkungen, Frankfurt.
-
3
Microsimulation as a Tool for Evaluating Redistribution PoliciesJournal of Economic Inequality 4:77–106.
- 4
-
5
Faktische Anonymisierung der Steuerstatistik (the FAST)Wiesbaden: Lohn- und Einkommensteuer 2004.
-
6
Entwurf eines Gesetzes zur verbesserten steuerlichen Berücksichtigung von Vorsorgeaufwendungen (Bürgerentlastungsgesetz Krankenversicherung)Entwurf eines Gesetzes zur verbesserten steuerlichen Berücksichtigung von Vorsorgeaufwendungen (Bürgerentlastungsgesetz Krankenversicherung), Drucksache 16/12254, Berlin.
-
7
Taxation trends in the European Union. Data for the EU Member States, Iceland and NorwayTaxation trends in the European Union. Data for the EU Member States, Iceland and Norway, Luxembourg.
-
8
Microsimulation in Government Policy and ForecastingMicrosimulation in Government Policy and Forecasting, Amsterdam.
-
9
Jährliche Einkommensteuerstatistik auf Basis der bisherigen Geschäftsstatistik der FinanzverwaltungWirtschaft und Statistik pp. 671–681.
-
10
The Adjustment of Microdata Using the Minimum Information Loss Principle. Department of Economics and Social Sciences discussion paper 8University of Luneburg.
-
11
De Facto Anonymised Microdata File on Income Tax Statistics 1998Schmollers Jahrbuch 126:313–327.
-
12
FiFoSIM - An integrated Tax Benefit Microsimulation and CGE ModelInternational Journal of Microsimulation 2:1–15.
-
13
Erneuerung der Stichprobe des ESt-Modells des Bundesministeriums der Finanzen auf Basis der Lohn- und Einkommensteuerstatistik 1995Erneuerung der Stichprobe des ESt-Modells des Bundesministeriums der Finanzen auf Basis der Lohn- und Einkommensteuerstatistik 1995, Sankt Augustin.
-
14
Politikberatung durch Mikrosimulationen – Berechnungen für die Gemeindefinanzkommission, Wirtschaft und Statistik1043–1054, Politikberatung durch Mikrosimulationen – Berechnungen für die Gemeindefinanzkommission, Wirtschaft und Statistik, 11/2011.
-
15
Tax-benefit microsimulation models for Germany: A survey. IAW-Report55–74, Tax-benefit microsimulation models for Germany: A survey. IAW-Report, 32.
-
16
The German Socio-economic panel study (SOEP) – Scope, Evolution and EnhancementsSchmollers Jahrbuch 127:139–169.
Article and author information
Author details
Acknowledgements
Paper presented at the Third General Conference of the International Microsimulation Association in Stockholm 2011. The authors would like to thank the seminar participants for their comments. They would also like to thank Hermann Quinke, Feras Nassaj, Martin Teuber, Gijs Dekkers and an anonymous referee for further comments and suggestions. Remaining errors are the authors’ sole responsibility.
Publication history
- Version of Record published: December 31, 2012 (version 1)
Copyright
© 2012, Flory and Stöwhase
This article is distributed under the terms of the Creative Commons Attribution License, which permits unrestricted use and redistribution provided that the original author and source are credited.