Tax-benefit systems, income distribution and work incentives in the European Union
- University of Essex and University of Leuven, United Kingdom
- University of Essex, United Kingdom
- Article
- Figures and data
- Jump to
Figures

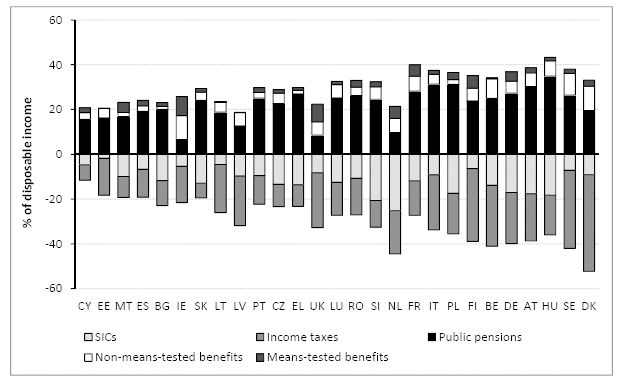
Tax-benefit components as share of household disposable income: all households (2007 policies).
Note: Countries ranked by the size of their tax-benefit system.
Source: EUROMOD version F6.20.

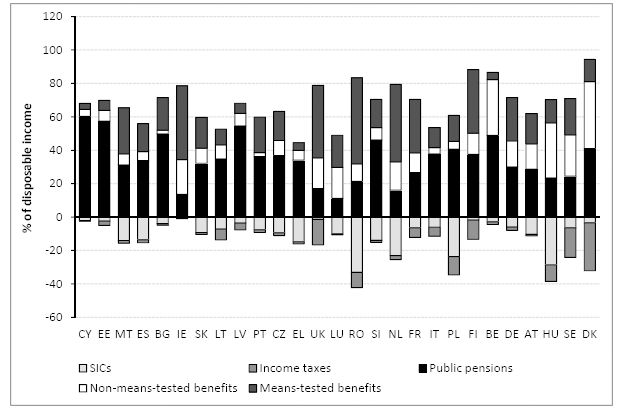
Tax-benefit components as share of household disposable income: bottom decile (2007 policies).
Note: Countries ranked by the size of their tax-benefit system.
Source: EUROMOD version F6.20.
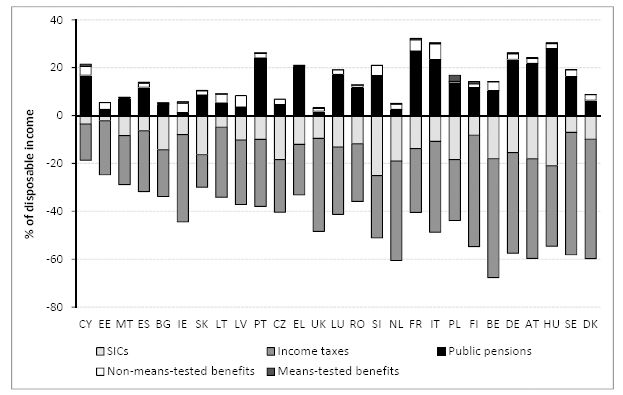
Tax-benefit components as share of household disposable income: top decile (2007 policies).
Note: Countries ranked by the size of their tax-benefit system.
Source: EUROMOD version F6.20.

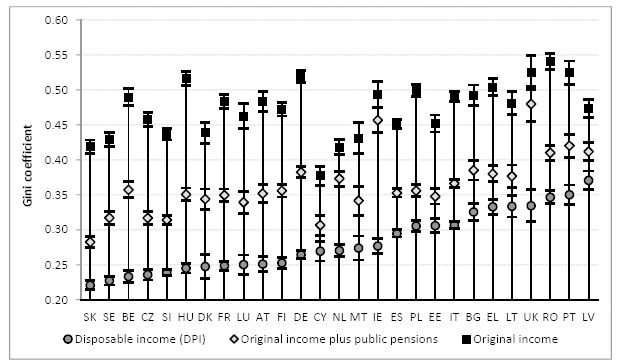
Income inequality before and after taxes and benefits as measured by the Gini coefficient.
Source: EUROMOD version F6.20

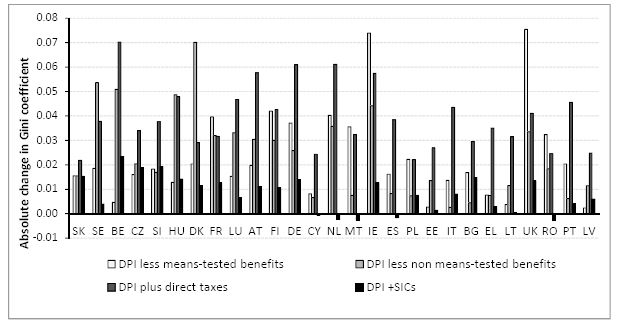
Redistributive effect of tax-benefit instruments, absolute change in the Gini coefficient.
Source: EUROMOD version F6.20
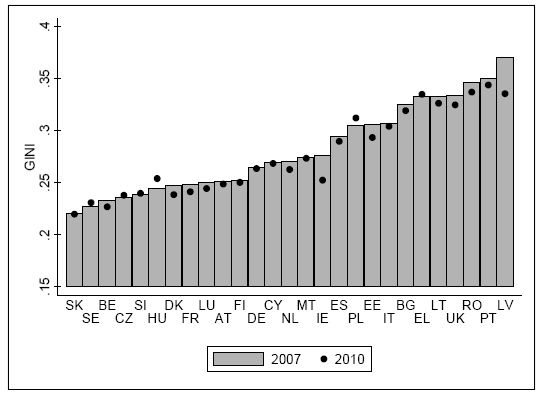
Changes in income inequality 2007–2010.
Note: Countries ranked by Gini coefficient in 2007.
Source: EUROMOD version F6.20.

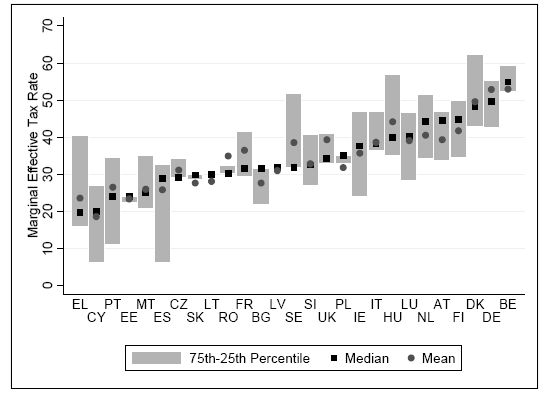
Marginal effective tax rates across the EU, 2007 (%).
Note: Countries are ranked by the median METR.
Source: EUROMOD version F6.20.

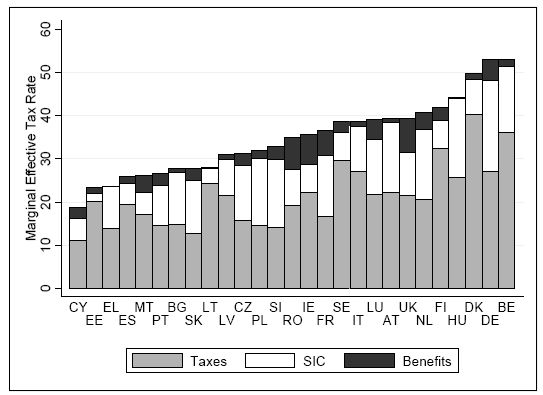
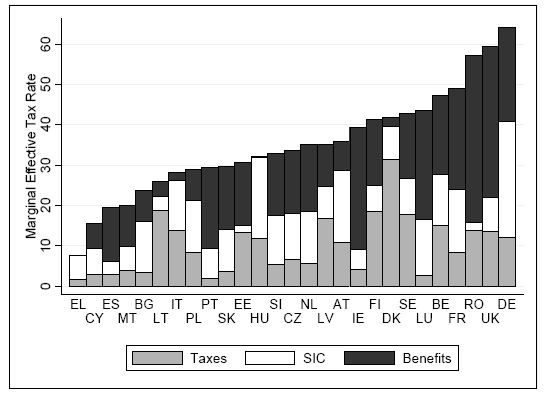
Mean marginal effective tax rates decomposition by income source across the EU, 2007 (%).
Note: Countries are ranked by the mean METR.
Source: EUROMOD version F6.20.

Mean marginal effective tax rates decomposition across the EU, Lowest two deciles of the income distribution, 2007(%).
Note: Countries are ranked by the mean METR.
Source: EUROMOD version F6.20.

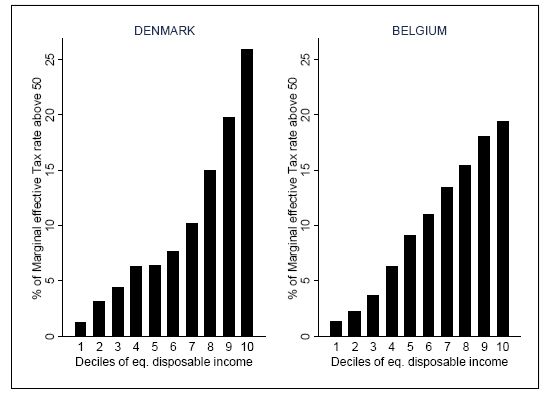
Proportion of high METR by deciles of equivalised disposable income, 2007.
Note: Proportion of METRs above 50% across deciles of income distribution.
Source: EUROMOD version F6.20.

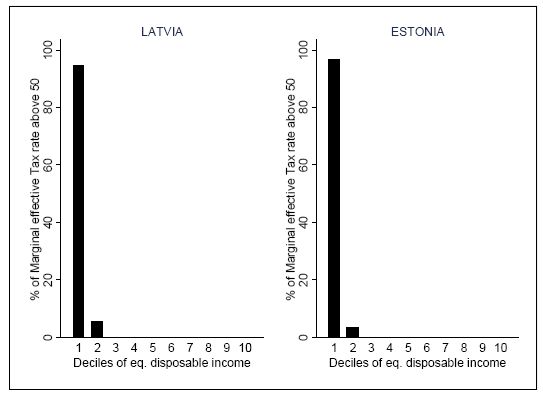
Proportion of high METR by deciles of equivalised disposable income, 2007.
Source: EUROMOD version F6.20.

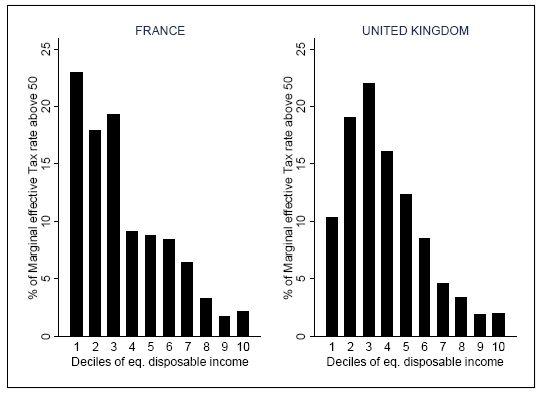
Proportion of high METR by deciles of equivalised disposable income, 2007.
Source: EUROMOD version F6.20.
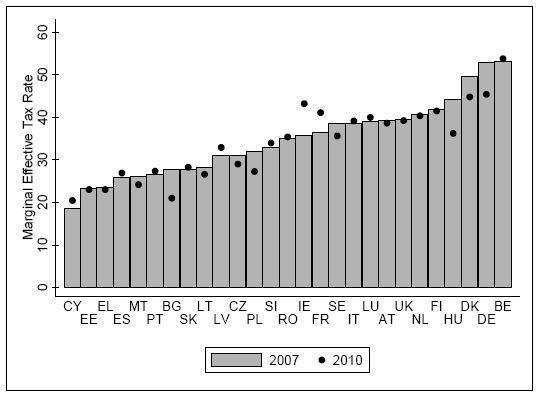
Average METRs in 2007 and 2010 (%).
Note: Countries are ranked by average METR in 2007.
Source: EUROMOD version F6.20.

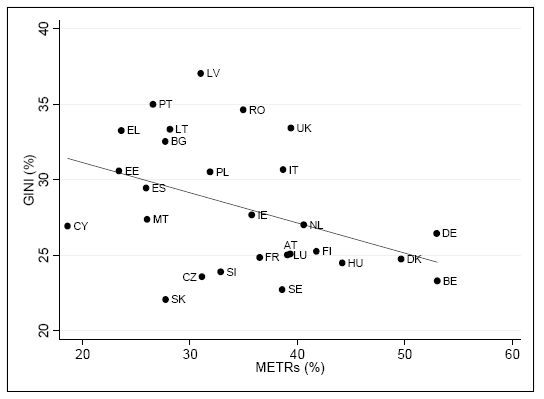
Relationship between income inequality and work incentives (2007).
Source: EUROMOD version F6.20.

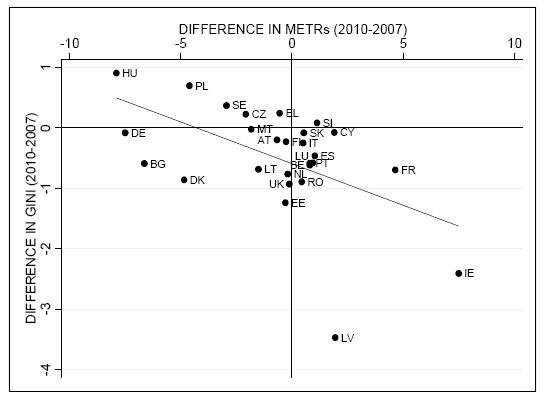
Relationship between changes in GINI and changes in mean METR.
Note: Differences in GINI and METRs expressed in percentage points.
Source: EUROMOD version F6.20.
Tables
METRs Distribution across the EU, 2007.
| MEAN | MEDIAN | PERCENTILES | ||
|---|---|---|---|---|
| 25% | 75% | |||
| AUSTRIA | 39.3 | 44.6 | 33.7 | 46.9 |
| BELGIUM | 53 | 54.9 | 52.4 | 59.4 |
| BULGARIA | 27.7 | 31.7 | 22 | 31.7 |
| CYPRUS | 18.6 | 20 | 6.3 | 27 |
| CZECK REPUBLIC | 31.1 | 29.1 | 29.1 | 34.4 |
| GERMANY | 53 | 49.6 | 42.7 | 55.3 |
| DENMARK | 49.7 | 48.3 | 43 | 62.3 |
| ESTONIA | 23.4 | 24 | 22.5 | 24 |
| GREECE | 23.6 | 19.6 | 16 | 40.4 |
| SPAIN | 25.9 | 28.8 | 6.3 | 32.6 |
| FINLAND | 41.8 | 44.8 | 34.4 | 49.9 |
| FRANCE | 36.5 | 31.6 | 29.5 | 41.7 |
| HUNGARY | 44.2 | 40 | 35 | 57 |
| IRELAND | 35.7 | 37.6 | 24 | 47 |
| ITALY | 38.7 | 38.4 | 36.5 | 46.9 |
| LITHUANIA | 28.1 | 30 | 30 | 30 |
| LUXEMBOURG | 39.1 | 40.2 | 28.4 | 46.7 |
| LATVIA | 31 | 31.8 | 31.8 | 31.8 |
| MALTA | 26 | 25 | 21 | 35 |
| NETHERLANDS | 40.6 | 44.2 | 34.3 | 51.5 |
| POLAND | 31.9 | 35.2 | 32.9 | 35.2 |
| PORTUGAL | 26.6 | 24 | 11 | 34.5 |
| ROMANIA | 35 | 30.3 | 30.3 | 32.3 |
| SWEDEN | 38.6 | 31.9 | 31.9 | 51.8 |
| SLOVENIA | 32.9 | 32.6 | 27 | 40.7 |
| SLOVAKIA | 27.7 | 29.9 | 28.7 | 29.9 |
| UNITED KINGDOM | 39.4 | 34.4 | 33 | 41.1 |
-
Source: EUROMOD F6.20.
Proportion of METRs above 50% by deciles of equivalised disposable income, 2007.
| N. Obs | Prop. | DECILES | ||||||||||
|---|---|---|---|---|---|---|---|---|---|---|---|---|
| 1 | 2 | 3 | 4 | 5 | 6 | 7 | 8 | 9 | 10 | |||
| AUSTRIA | 575 | 9.3 | 18.0 | 11.6 | 9.3 | 7.1 | 9.4 | 9.2 | 9.8 | 7.7 | 7.9 | 10.1 |
| BELGIUM | 5,136 | 79.2 | 1.4 | 2.3 | 3.7 | 6.3 | 9.1 | 11.0 | 13.4 | 15.4 | 18.1 | 19.4 |
| BULGARIA | 44 | 0.9 | 88.6 | 1.8 | 2.6 | 0.0 | 4.0 | 0.0 | 0.0 | 0.0 | 3.0 | 0.0 |
| CYPRUS | 116 | 2.8 | 12.4 | 16.8 | 24.2 | 12.5 | 9.9 | 6.4 | 3.5 | 6.4 | 1.0 | 6.6 |
| CZECK REPUBLIC | 310 | 2.9 | 56.0 | 13.4 | 4.4 | 2.5 | 2.1 | 3.6 | 10.8 | 5.5 | 0.5 | 1.2 |
| GERMANY | 6,048 | 47.7 | 6.2 | 7.8 | 4.3 | 6.8 | 9.3 | 11.2 | 14.0 | 14.7 | 15.1 | 10.7 |
| DENMARK | 3,136 | 35.9 | 1.2 | 3.2 | 4.4 | 6.3 | 6.4 | 7.7 | 10.2 | 15.0 | 19.7 | 26.0 |
| ESTONIA | 96 | 1.6 | 96.7 | 3.3 | 0.0 | 0.0 | 0.0 | 0.0 | 0.0 | 0.0 | 0.0 | 0.0 |
| GREECE | 67 | 1.0 | 0.0 | 0.0 | 0.0 | 0.0 | 5.2 | 8.1 | 10.4 | 8.3 | 22.6 | 45.5 |
| SPAIN | 300 | 1.7 | 79.0 | 6.2 | 3.6 | 1.7 | 3.4 | 2.9 | 1.0 | 0.3 | 1.1 | 0.9 |
| FINALND | 2,901 | 15.7 | 10.3 | 8.4 | 4.8 | 5.1 | 3.1 | 3.9 | 5.9 | 7.2 | 15.6 | 35.8 |
| FRANCE | 1,321 | 12.2 | 23.0 | 17.9 | 19.3 | 9.1 | 8.8 | 8.4 | 6.4 | 3.3 | 1.7 | 2.1 |
| HUNGARY | 4,068 | 43.0 | 3.8 | 3.6 | 5.3 | 6.4 | 6.4 | 8.0 | 10.5 | 14.0 | 17.8 | 24.1 |
| IRELAND | 711 | 15.6 | 5.2 | 16.9 | 11.2 | 8.2 | 5.8 | 7.1 | 12.1 | 7.4 | 12.6 | 13.5 |
| ITALY | 2,263 | 10.0 | 1.5 | 6.8 | 9.8 | 8.8 | 8.3 | 7.7 | 11.1 | 13.6 | 14.4 | 18.0 |
| LITHUANIA | 31 | 0.6 | 75.6 | 20.7 | 0.0 | 0.8 | 0.0 | 0.0 | 0.0 | 0.0 | 2.9 | 0.0 |
| LXEMBOURG | 459 | 6.8 | 52.5 | 14.6 | 4.0 | 0.3 | 3.3 | 3.8 | 2.4 | 3.6 | 7.9 | 7.8 |
| LATVIA | 110 | 104 | 94.5 | 5.5 | 0.0 | 0.0 | 0.0 | 0.0 | 0.0 | 0.0 | 0.0 | 0.0 |
| MALTA | 115 | 2.9 | 15.5 | 6.1 | 11.6 | 6.5 | 11.2 | 22.0 | 13.3 | 4.5 | 4.0 | 5.2 |
| NETHERLANDS | 3?311 | 26.2 | 7.7 | 8.2 | 10.3 | 10.9 | 8.2 | 7.0 | 7.8 | 7.9 | 9.8 | 22.2 |
| POLAND | 284 | 1.7 | 46.8 | 17.4 | 11.3 | 8.4 | 2.2 | 1.3 | 0.7 | 0.0 | 0.0 | 12.0 |
| PORTUGAL | 197 | 4.0 | 53.2 | 21.5 | 1.3 | 3.2 | 1.7 | 2.9 | 2.8 | 3.6 | 1.6 | 8.4 |
| ROMANIA | 680 | 9.1 | 54.2 | 16.4 | 10.2 | 4.7 | 5.5 | 2.7 | 3.4 | 2.7 | 0.2 | 0.0 |
| SWEDEN | 3?274 | 32.5 | 9.3 | 4.4 | 4.7 | 3.7 | 5.1 | 6.1 | 8.2 | 12.4 | 17.8 | 28.4 |
| SLOVENIA | 2,237 | 14.8 | 13.6 | 4.5 | 2.4 | 2.5 | 1.2 | 3.0 | 2.8 | 7.2 | 20.6 | 42.1 |
| SLOVAKIA | 170 | 2.0 | 64.9 | 11.0 | 6.2 | 2.5 | 3.5 | 5.4 | 3.6 | 0.8 | 2.1 | 0.0 |
| UNITED KINGDOM | 3,860 | 15.8 | 10.3 | 19.0 | 22.0 | 16.1 | 12.3 | 8.5 | 4.6 | 3.4 | 1.9 | 1.9 |
-
Note: The first column on the left reports the total number of observation with METR above 50%; the second column reports the proportion of earners with METR above 50%; the following columns reports the distribution of high METRs across deciles of equivalised disposable income.
-
Source: EUROMOD F6.20.