Impact assessment of alternative reforms of child allowances using RUSMOD – the static tax-benefit microsimulation model for Russia
- Department of Social and Political Sciences, Italy
- Article
- Figures and data
- Jump to
Figures

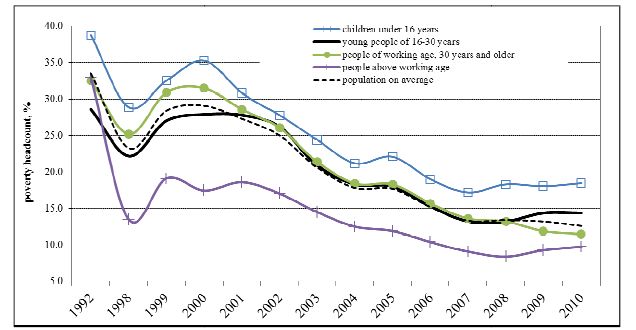
Poverty headcount in Russia by population groups, 1992–2010.
Source: Own calculations based on the FSSS data.
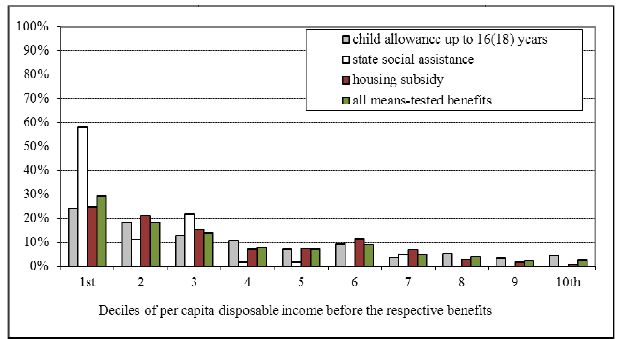
Distribution of the total spending on means-tested benefits by income deciles, baseline policies.
Source: Own calculations based on RUSMOD.

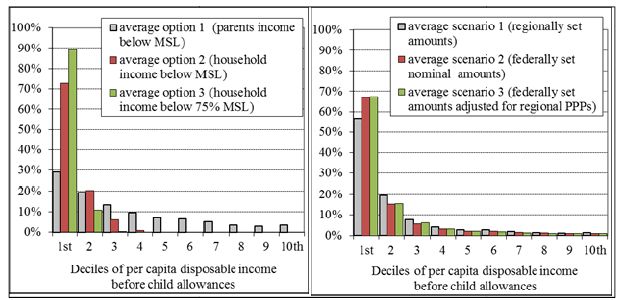
Distribution of the total spending on child allowances in the simulated reforms under the current budget, 2010.
Source: Own calculations based on RUSMOD.
Tables
Social protection spending in Russia as % of GDP.
| Year | 2005 | 2006 | 2007 | 2008 | 2009 | 2010 |
|---|---|---|---|---|---|---|
| Social protection, total | 13.5 | 13.1 | 13.6 | 13.8 | 17.6 | 18.8 |
| Health care, physical culture and sports | 3.7 | 3.6 | 4.2 | 3.7 | 4.3 | 3.8 |
| Pensions | 6 | 5.5 | 5.2 | 5.6 | 7.5 | 9 |
| Unemployment benefit and Active labour market policies | 0.1 | 0.1 | 0.2 | 0.1 | 0.4 | 0.4 |
| Social insurance | 0.7 | 0.7 | 0.9 | 0.9 | 1.1 | 1.1 |
| Maternity and child care allowances | 0.1 | 0.2 | 0.3 | 0.4 | 0.5 | 0.5 |
| Temporary incapacity benefit | 0.4 | 0.4 | 0.4 | 0.4 | 0.5 | 0.5 |
| Other | 0.2 | 0.2 | 0.1 | 0.1 | 0.2 | 0.1 |
| Social assistance | 1.8 | 2 | 1.9 | 1.8 | 2.6 | 2.8 |
| Monthly cash payment (monetized privileges) | 0.8 | 0.9 | 0.8 | 0.8 | 0.9 | 0.9 |
| Other privileges (cash and in kind) | 0.6 | 0.6 | 0.6 | 0.6 | 0.8 | 0.8 |
| Means-tested benefits | 0.4 | 0.3 | 0.3 | 0.3 | 0.5 | 0.5 |
| Other | 0 | 0.1 | 0.1 | 0.1 | 0.4 | 0.6 |
| Social care services | 0.6 | 0.5 | 0.7 | 0.9 | 0.9 | 0.9 |
| Childcare | 0.6 | 0.7 | 0.7 | 0.7 | 0.9 | 0.8 |
| Other | 0.1 | 0.1 | 0.1 | 0.1 | 0.1 | 0.1 |
| GDP in current prices, billion Rubles | 21,610 | 26,917 | 33,248 | 41,277 | 38,807 | 45,173 |
| GDP growth, in % to previous year | 106.4 | 108.2 | 108.5 | 105.2 | 92.2 | 104.0 |
| CPI end-year, in % to previous year | 110.9 | 109 | 111.9 | 113.3 | 108.8 | 108.8 |
-
Source: Own calculations based on the Federal State Statistics Service (FSSS) data on implementation of the extra-budgetary funds (http://www.gks.ru) and the Treasury data on implementation of the Consolidate Budget (http://www.roskazna.ru/).
Order of simulation in RUSMOD, 2010.
| Policy name: | Short policy description: |
|---|---|
| Employer social insurance contributions (Страховые взносыработодателей) | Social insurance contributions (SIC) are paid by employers on behalf of employees to cover the costs of mandatory social insurance-based allowances, public pensions and health care. Contribution rates are set by the Federal laws. Social contributions apply to the withholding personal income tax base (i.e. gross earnings). Annual employment income below 415,000 Rubles is taxed at 26%, while income exceeding this amount is exempt. |
| Self-employed social insurance contributions (Страховые взносысамозанятых) | The size of contributions for self-employed people is determined as follows: Cost of annual insurance = Minimum Wage * SIC Rate *12. The monthly minimum wage equals 4,330 Rubles. The self-employed are obliged to pay only pension and health insurance contributions, participation in other social insurance programs is voluntary. |
| Personal Income Tax (Налог надоходы физических лиц) | Income taxation is individual. A unified tax rate of 13% applies to main income (work for pay, contractor’s agreements, housing lease). State pensions and allowances are normally not taxable. Capital gains from asset sales are taxable only if the seller owned the asset for less than 3 years. A higher tax rate of 35% applies to some sources of income, e.g. bank interests that exceed the upper limit computed using a refinancing rate. However, interest rates are usually below the threshold, making interests tax free. Dividends received by shareholders are subject to a 9% tax. The model differentiates between the withholding income tax and the final income tax. The former is the amount of an employee’s pay withheld by the employer and sent directly to the government as partial payment of income tax. For the latter the liability is based on the final tax report submitted at the end of each tax year (in April). There are two non-refundable tax allowances that are used to reduce the withholding income tax base (the standard tax allowance for each taxpayer and the standard tax allowance for taxpayer’s children). |
| Maternity leave allowance (Пособие по беременности иродам) | The allowance is paid to socially insured women for approximately 4 months (70 days preceding the child birth and 70 days after). The monthly size of allowance equals 100% of monthly earnings net of withholding income tax, with an upper limit of 34,583 Rubles per month (the upper limit of income base for SIC). |
| Child care allowance up to 1.5 years (Пособие по уходу за ребенком ввозрасте до 1.5 лет) | There are two types of this allowance. The contributory allowance is proportional to a mother’s net earnings for the last 6 months preceding the leave. The monthly size equals 40% of net earnings with an upper limit of 13,833 Rubles. There are two lower limits – 2,060.4 Rubles for the first child and 4,120.8 Rubles for the second and subsequent children. The non-contributory allowance is provided to all women who did not have any earnings in the last 6 months. The monthly size equals 1,798.5 Rubles for the first child and 3,597 Rubles for the second and subsequent children. |
| Compensation of charges for pre-school institutions (Компенсация части родительской платы за посещение ребенком учреждения дошкольного образования) | Cash compensation is provided to all families with children attending public or private pre-school institutions that provide a general education program. The size of compensation is proportional to actual fees paid by parents and amounts to 20% for the first child, 50% for the second child and 70% for the third and subsequent children. |
| Minimum Subsistence Level (Прожиточный минимум) | Eligibility for means-tested allowances is defined by comparing family/household income with the poverty line or Minimum Subsistence Level (MSL). The value of MSL is computed separately for three socio-demographic groups – children under 16 years, persons of working age (men 16–59 years, women 16–54 years) and persons of retirement age (men 60+ years, women 55+ years). The MSL is set quarterly in all Federation subjects according to the federal guidelines. |
| Child allowance up to 16(18) years for poor families (Пособие на детей до 16(18) лет из бедных семей) | A monthly means-tested allowance is paid to families with children below 16 years (or 18 years if they are in full-time education). The means test is applied to the sum of parents’ net earnings, scholarships, pensions and alimonies averaged over the last 3 months. According to the federal regulations the allowance must be provided in all regions, but the amounts are set by regional authorities. The model computes the allowance for 5 categories of families that are differentiated in most of the Federation subjects and are large enough to be detected in the sample, including: two-parent families, lone mothers, large families (families with 3+ children), families with disabled children and families with disabled parents. |
| State social assistance (Государственная социальная помощь) | The allowance is means-tested and targeted at poor households and households in hard life situation. This program is both regulated and funded by regional authorities and there is no minimum federal standard of service provision. The means test is typically applied to total household income from all sources, including net earnings, net investment income and income from lease, pensions, scholarships and other social allowances, averaged over the 3 preceding months. The most common eligibility rule is that the total household income should be below the (fraction) of the regional poverty line (MSL) due to circumstances that could not be prevented by the family. In other words, it means that all people of working age should provide a justification if they are currently not working and not seeking employment. The target group may be additionally narrowed down to certain categories of the population that are considered to be the most vulnerable in that particular region (e.g. lone mothers, pensioners living along, families with the disabled members). The size of allowance is usually computed as a (fraction) of the shortfall of the household income from the poverty line for that particular household. In some cases the size of allowance is set as a fixed amount per family member. It is not uncommon to define upper and lower limits. |
| Housing subsidy (Жилищная субсидия) | This is a partially means-tested benefit designed to assist low-income households with meeting the costs of rent and utilities. Income test is applied to the total household income from all sources (as for the state social assistance) averaged over the last 6 months. The computation formula is quite complicated and includes a number of conditions at household and regional levels. The size of allowance is equal to: (social standard of living space*N of persons in the household * social standard of the cost of rent and utilities per 1 square metre) – (household income * maximum share of the cost of rent and utilities in total household income). For non-poor households, i.e. those whose income is equal or over the regional MSL, and for households eligible for discounts on rent and utilities, the formula is additionally multiplied by adjustment coefficients to reduce the subsidy size. The latter cannot exceed the actual cost of rent and utilities. The subsidy is only available if the household has no debts for rent and utilities. Social standards of the cost of rent and utilities are set by regional authorities. The maximum share of the cost of rent and utilities in household income may not exceed 22%. |
-
Notes: Exchange rate = 40.3 Rubles per 1 Euro (2010); PPPs (household consumption) = 16.2 Rubles per 1 Euro (2008); Net average monthly earnings = 20,437 Rubles (2010). Detailed description of the Russian tax-benefit system, including policies that are not simulated in RUSMOD is available in Popova (2012).
-
Source: Own analysis of the federal and regional legislative acts.
RUSMOD input database description, 2010.
| Original name | Russian Longitudinal Monitoring Survey (RLMS-HSE) |
|---|---|
| Provider | National Research University – Higher School of Economics |
| Year of collection | 2010 |
| Period of collection | October-December 2010 |
| Income reference period | Typically income and expenditure for the month preceding the survey, for some types of expenditure – 3 months preceding the survey |
| Sampling | A three-stage stratified clustered probability sample of dwellings |
| Unit of assessment | Household (people living together and sharing income and expenses) |
| Coverage | Permanent residents, people living in institutions are excluded |
| Sample size | 21,343 individuals; 7,923 households (total sample including the panel element) |
| Response rate for household grid | 80% (60% in Moscow and St-Petersburg) |
| Final sample used in the model | 16,867 individuals; 6,323 households |
| Weighting | The weights must be used in order to adjust the sample for design factors (sampling probabilities and non-response) and deviations from the census characteristics. In addition, the weights provided with the original data were scaled up to the overall population |
Model validation: simulation of taxes and benefits in the original and calibrated scenarios, 2010.
| Taxes and social benefits: | Original data | Simulation scenarios: | External source | |
|---|---|---|---|---|
| original | calibrated | FSSS | ||
| Social insurance contributions | ||||
| recepients, % of population | n/a | 42.8 | 42.8 | n/a |
| mean size, Rubles | n/a | 3,999 | 3,999 | n/a |
| expenditure, mln Rubles | n/a | 2 820,000 | 2 820,000 | 2 562,974 |
| Personal Income Tax | ||||
| recepients, % of population | n/a | 44.7 | 44.7 | n/a |
| mean size, Rubles | n/a | 2,413 | 2,413 | n/a |
| expenditure, mln Rubles | n/a | 1 776,000 | 1 776,000 | 1 789,600 |
| Maternity leave allowance | ||||
| recepients, % of population | n/a | 0.1 | 0.1 | 0.7 |
| mean size, Rubles | n/a | 13,676 | 13,676 | n/a |
| expenditure, mln Rubles | n/a | 33,000 | 33,000 | 67,317 |
| Child care allowance up to 1.5 | ||||
| years | ||||
| recepients, % of population | 1.3 | 1.6 | 1.6 | 2.6 |
| mean size, Rubles | 4,086 | 3,599 | 3,599 | n/a |
| expenditure, mln Rubles | 90,720 | 94,800 | 94,800 | 121,797 |
| Compensation of child care | ||||
| charges | ||||
| recepients, % of population | 2.8* | 2.6 | 2.6 | 3.0 |
| mean size, Rubles | 1,055 | 388 | 388 | n/a |
| expenditure, mln Rubles | 49,440 | 16,680 | 16,680 | n/a |
| Child allowance up to 16(18) | ||||
| years | ||||
| recepients, % of population | 4.4 | 7.0 | 4.6 | 4.7 |
| mean size, Rubles | 962 | 583 | 622 | n/a |
| expenditure, mln Rubles | 70,440 | 66,960 | 46,680 | 43,081 |
| State social assistance | ||||
| recepients, % of households | 1.0 | 3.7 | 1.0 | 1.0 |
| mean size, Rubles | 2,233 | 1,713 | 1,437 | 796 |
| expenditure, mln Rubles | 15,000 | 41,520 | 9,264 | n/a |
| Housing subsidy | ||||
| recepients, % of households | 8.5 | 24.4 | 7.1 | 7.3 |
| mean size, Rubles | 1,018 | 1,040 | 822 | 896 |
| expenditure, mln Rubles | 56,280 | 165,600 | 38,280 | 55,719 |
-
Notes:
-
*
children attending pre-school institutions and actual fees.
Model validation: simulation of income inequality and poverty in the original and calibrated scenarios, 2010.
| Simulation scenarios: | External source | |||||
|---|---|---|---|---|---|---|
| Original | Calibrated | HBS 2010 | FSSS 2010 | |||
| RLMS-HSE | RUSMOD | RLMS-HSE | RUSMOD | |||
| Mean disposable income, | 12,625 | 12,641 | 15,720 | 15,723 | 12,898 | 22,140 |
| Rubles | ||||||
| Gini coefficient | 0.421 | 0.416 | 0.422 | 0.421 | 0.421 | |
| Decile ratio (9th to 1th), times | 6.0 | 5.6 | 5.1 | 5.0 | 7.4 | |
| Income distribution: | ||||||
| 1st quintile | 5.3 | 5.6 | 6.2 | 6.3 | 6.9 | 5.2 |
| 2nd quintile | 10.7 | 10.8 | 10.7 | 10.7 | 11.0 | 9.8 |
| 3rd quintile | 15.1 | 15.1 | 14.3 | 14.3 | 15.5 | 14.8 |
| 4th quintile | 21.0 | 20.9 | 19.7 | 19.7 | 23.8 | 22.5 |
| 5th quintile | 47.8 | 47.6 | 49.1 | 49.1 | 42.8 | 47.7 |
| 10th decile | 33.4 | 33.2 | 35.1 | 35.0 | 26.0 | 30.9 |
| Poverty headcount, % of the population: | 23.8 | 22.2 | 12.9 | 12.4 | 12.6 | |
| Children under 16 years | 37.5 | 35.0 | 20.3 | 19.3 | 18.5 | |
| Young people aged 16–30 years | 27.7 | 26.5 | 15.0 | 14.7 | 14.4 | |
| People over 30 years and below state pension age | 26.3 | 24.4 | 14.1 | 13.5 | 11.5 | |
| People over state pension age | 7.7 | 6.9 | 4.3 | 4.2 | 9.8 | |
| Poverty gap, % of total income of the population | 6.0 | 5.2 | 2.1 | 2.0 | 1.2 | |
-
Notes: All indicators are calculated using per capita disposable income because the Russian official statistics does not apply any equivalence scale; the poor are those whose per capita disposable income is below the Minimum Subsistence Level.
Policy impact of means-tested benefits, baseline policies, 2010.
| Child allowance up to 16(18) years | State social assistance | Housing subsidy | All means-tested programs | |
|---|---|---|---|---|
| Policy characteristics: | ||||
| Beneficiaries, % of households | 11.5% | 1.0% | 7.1% | 6.8% |
| Mean size per household, % of MSL | 10.9% | 24.4% | 13.9% | 14.2% |
| Expenditure, % of GDP | 0.09% | 0.02% | 0.07% | 0.17% |
| Vertical efficiency, % of the poor among beneficiaries | 35.3% | 93.1% | 39.8% | 43.6% |
| Policy impact (% change in the indicator due to the program): | ||||
| Gini coefficient | −0.2% | 0.0% | −0.2% | −0.7% |
| National poverty headcount | −2.4% | −0.8% | −1.6% | −5.6% |
| National poverty gap | −1.8% | −1.1% | −1.8% | −4.6% |
| Poverty headcount, children under 18 years | −3.7% | −1.6% | −1.6% | −6.9% |
| Poverty gap, children under 18 years | −3.1% | −1.0% | −2.4% | −6.1% |
| Poverty headcount, couples with 3+ children | 0.0% | 0.0% | −2.2% | −2.0% |
| Poverty gap, couples with 3+ children | −7.4% | −2.7% | 0.0% | −10.0% |
-
Source: Own calculations based on RUSMOD.
Simulated reforms of child allowances.
| Size of allowance | |||
|---|---|---|---|
| Eligibility: | Scenario 1 – regionally set amounts | Scenario 2 – federally set nominal amounts | Scenario 3 – federally set amounts adjusted for regional PPPs |
| Option 1 – parents income below the poverty line | Baseline/Reform 1.1 | Reform 2.1 | Reform 3.1 |
| Option 2 – household income below the poverty line | Reform 1.2 | Reform 2.2 | Reform 3.2 |
| Option 3 – household income below 75% of the poverty line | Reform 1.3 | Reform 2.3 | Reform 3.3 |
Policy impact of the simulated reforms of child allowances under the current budget, 2010.
| Name of scenario: | baseline | reform 1.2 | reform 1.3 | reform 2.1 | reform 2.2 | reform 2.3 | reform 3.1 | reform 3.2 | reform 3.3 |
|---|---|---|---|---|---|---|---|---|---|
| Policy characteristics: | |||||||||
| Beneficiaries, % of households | 17.6%* | 5.5% | 2.7% | 18.1% | 5.4% | 2.7% | 18.1% | 5.4% | 2.7% |
| Mean size, % of MSL | 10.2% | 32.8% | 66.7% | 9.9% | 32.9% | 66.4% | 9.9% | 32.8% | 66.4% |
| Expenditure, % of GDP | 0.12%* | 0.12% | 0.12% | 0.12% | 0.12% | 0.12% | 0.12% | 0.12% | 0.12% |
| Vertical efficiency, % of the poor among beneficiaries | 34.0% | 94.8% | 99.8% | 38.5% | 99.1% | 99.8% | 42.4% | 98.6% | 100.0% |
| Policy impact (% change in the indicator due to the program): | |||||||||
| Gini coefficient | −0.3% | −0.3% | −0.3% | −0.3% | −0.3% | −0.1% | −0.3% | −0.3% | |
| National poverty headcount | −5.1% | 0.8% | 0.8% | −7.9% | 0.8% | 0.8% | −6.3% | −0.4% | |
| National poverty gap | −3.3% | −12.2% | −12.2% | −3.0% | −14.5% | −3.0% | −5.4% | −12.3% | |
| Poverty headcount, children under 18 years | −8.9% | 0.6% | 0.6% | −11.8% | −0.8% | 0.3% | −11.2% | −4.0% | |
| Poverty gap, children under 18 years | −5.0% | −19.7% | −19.7% | −3.7% | −24.6% | −5.4% | −9.7% | −20.3% | |
| Poverty headcount, couples with 3+ children | −8.7% | −6.4% | −2.5% | −21.2% | −15.1% | −5.3% | −33.5% | −31.2% | |
| Poverty gap, couples with 3+ children | −7.2% | −21.9% | −2.3% | −9.1% | −41.6% | −10.2% | −20.0% | −39.6% | |
-
Notes:
-
*
The number of beneficiaries and total expenditure on the program is higher than those in Table 6 because the take up correction is switched off.
Source: Own calculations based on RUSMOD.
Policy impact of the simulated reforms of child allowances under the increased budget, 2010.
| Name of scenario: | reform 1.1 | reform 1.2 | reform 1.3 | reform 2.1 | reform 2.2 | reform 2.3 | reform 3.1 | reform 3.2 | reform 3.3 |
|---|---|---|---|---|---|---|---|---|---|
| Policy characteristics: | |||||||||
| Beneficiaries, % of households | 17.6% | 5.5% | 2.8% | 18.1% | 5.4% | 2.7% | 18.1% | 5.4% | 2.7% |
| Mean size, % of MSL | 18.5% | 59.5% | 114.7% | 18.0% | 59.6% | 120.3% | 18.0% | 59.6% | 120.4% |
| Expenditure, % of GDP | 0.22% | 0.22% | 0.22% | 0.22% | 0.22% | 0.22% | 0.22% | 0.22% | 0.22% |
| Vertical efficiency, % of the poor among beneficiaries | 34.2% | 94.7% | 92.4% | 38.5% | 97.8% | 100.0% | 42.4% | 98.5% | 100.0% |
| Policy impact (% change in the indicator due to the program) : | |||||||||
| Gini coefficient | 0.0% | −0.4% | −0.4% | 0.3% | −0.5% | −0.6% | −0.2% | −0.5% | −0.6% |
| National poverty headcount | −2.9% | −13.0% | −3.3% | 6.0% | −14.6% | −4.5% | −2.8% | −14.9% | −4.4% |
| National poverty gap | −1.2% | −4.9% | −15.3% | −4.2% | −6.5% | −20.4% | −5.5% | −6.5% | −16.8% |
| Poverty headcount, children under 18 years | −5.2% | −19.8% | −7.8% | 1.9% | −20.9% | −12.4% | −6.1% | −25.5% | −11.3% |
| Poverty gap, children under 18 years | −1.4% | −9.4% | −24.6% | −7.2% | −10.3% | −32.4% | −10.8% | −12.0% | −27.2% |
| Poverty headcount, couples with 3+ children | −5.3% | −22.1% | −22.5% | −6.2% | −36.9% | −45.1% | −20.3% | −54.4% | −51.8% |
| Poverty gap, couples with 3+ children | 1.1% | −15.1% | −26.6% | −12.9% | −20.1% | −54.6% | −20.6% | −38.7% | −53.7% |
-
Source: Own calculations based on RUSMOD.