Improving work incentives in Serbia: Evaluation of a tax policy reform using SRMOD
- Foundation for the Advancement of Economics, Serbia
Cite this article
as: S. Ranđelović, J. Žarković Rakić; 2013; Improving work incentives in Serbia: Evaluation of a tax policy reform using SRMOD; International Journal of Microsimulation; 6(1); 157-176.
doi: 10.34196/ijm.00080
- Article
- Figures and data
- Jump to
Figures
Figure 1

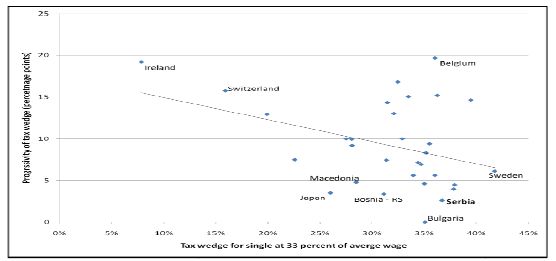
Progressivity of the labour taxation system.
Note: Scatter plot of tax wedge for a single at 33% of average wage (percent) versus progressivity of tax wedge (percentage point change) for selected European countries (2008).
Source: World Bank (2010, p. 12).
Figure 2

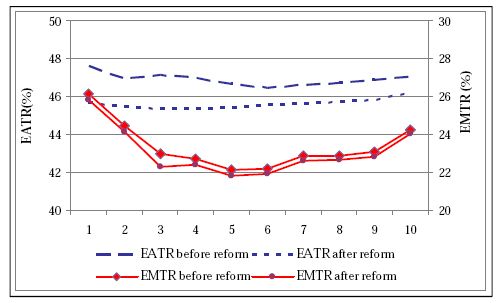
Mean EMTRs and EATRs by deciles, before and after the reform.
Source: Own calculations using SRMOD.
Tables
Table 1
Inactivity and unemployment rates by education and gender (%).
| Level of education | Inactivity rate | Unemployment rate | ||
|---|---|---|---|---|
| Men | Women | Men | Women | |
| Primary | 32.4 | 64.4 | 21.5 | 25.1 |
| Secondary | 24.5 | 40.9 | 22.4 | 26.5 |
| Tertiary | 18.0 | 22.4 | 15.5 | 14.2 |
-
Source: Labour Force Survey, 2011, age: 25–64.
Table 2
Proportion of unemployed and inactive without work experience by education and gender (%).
| Level of education | Unemployed | Inactive | ||
|---|---|---|---|---|
| Men | Women | Men | Women | |
| Primary | 35.1 | 42.3 | 14.9 | 55.0 |
| Secondary | 18.8 | 26.0 | 12.3 | 22.0 |
| Tertiary | 30.0 | 38.2 | 6.3 | 14.7 |
-
Source: Labour Force Survey, 2011, age: 25–64.
Table 3
Comparison of tax wedge in Western Balkan countries and EU.
| Earnings as a % of the average wage | 50% | 67% | 100% | 167% | |
|---|---|---|---|---|---|
| Country | year | ||||
| Serbia | 2006 | 42.3% | 42.3% | 42.3% | 42.3% |
| 2007 | 37.6% | 38.4% | 39.2% | 39.7% | |
| Albania | 2006 | 34.1% | 27.9% | 28.9% | 29.8% |
| Montenegro | 2007 | 36.3% | 38.6% | 40.9% | 42.8% |
| BiH Federation | 2006 | 30.6% | 29.3% | 32.3% | 35.3% |
| R. of Srpska | 2007 | 31.7% | 31.6% | 32.5% | 33.2% |
| Macedonia | 2007 | 41.2% | 37.8% | 38.6% | 39.2% |
| EU-27 | 2008 | 37% | 40.6% | 45.1% | |
| EU-15 | 2008 | 38.1% | 42.4% | 47.6% | |
| NMS-12 | 2008 | 35.6% | 38.5% | 42% | |
-
Note: Tax wedge for a single person as a percent of total labour costs.
-
Source: Data for Macedonia, Serbia, Albania, Montenegro and Bosnia (Leibfritz, 2008).
Other data: from Eurostat
Table 4
SRMOD macro-validation results: income tax and social contributions.
| Administrative records | SRMOD | Ratio (SRMOD/Administrative data) | |
|---|---|---|---|
| Average wage (in RSD) | 37,668 | 34,659 | 0.92 |
| Personal income tax | 8,284,791 | 6,649,044 | 0.80 |
| • salary/wage tax | 6,966,756 | 5,693,117 | 0.82 |
| Social security contributions - on full time employment income and unemployment | |||
| benefits | 20,901,550 | 19,944,627 | 0.95 |
-
Source: Own calculations using SRMOD.
Table 5
SRMOD macro-validation results: benefits.
| SRMOD | Administrative records | Ratio (SRMOD/Administrative records) | |
|---|---|---|---|
| Recipients (HHs) | |||
| Monetary social assistance | 53,444 | 50,848 | 1.05 |
| Child allowance | 229,221 | 199,323 | 1.15 |
| Expenditures (in RSD) | |||
| Monetary social assistance | 274,347,719 | 253,897,376 | 1.08 |
| Child allowance | 667,811,936 | 580,706,031 | 1.15 |
-
Source: Own calculations using SRMOD.
Table 6
Gini coefficient, before and after tax and benefit policy in Serbia.
| Baseline | Reform scenario | |
|---|---|---|
| Gini coefficient - original income | 44.75 | 44.75 |
| Gini coefficient - disposable income | 38.63 | 38.59 |
-
Source: own calculation using SMROD.
Table 7
Number of gainers from the reform per deciles.
| % of individuals whose disposable income, after the reform, is increased by | ||
|---|---|---|
| Deciles | More than 2% | More than 5% |
| 1 | 3.1 | 1.3 |
| 2 | 5.8 | 2.9 |
| 3 | 4.0 | 2.7 |
| 4 | 3.3 | 2.2 |
| 5 | 2.5 | 1.4 |
| 6 | 1.5 | 0.7 |
| 7 | 1.3 | 0.5 |
| 8 | 1.1 | 0.7 |
| 9 | 1.3 | 0.8 |
| 10 | 0.2 | 0.2 |
-
Source: own calculation using SMROD.
Download links
A two-part list of links to download the article, or parts of the article, in various formats.