The COMPARE microsimulation model and the U.S. Affordable Care Act
- RAND Corporation, United States
- Centre for Health Research, University of Western Sydney, Australia
- U.S. Department of Health and Human Services, United States
Cite this article
as: A. Cordova, F. Girosi, S. Nowak, C. Eibner, K. Finegold; 2013; The COMPARE microsimulation model and the U.S. Affordable Care Act; International Journal of Microsimulation; 6(3); 78-117.
doi: 10.34196/ijm.00089
- Article
- Figures and data
- Jump to
Figures
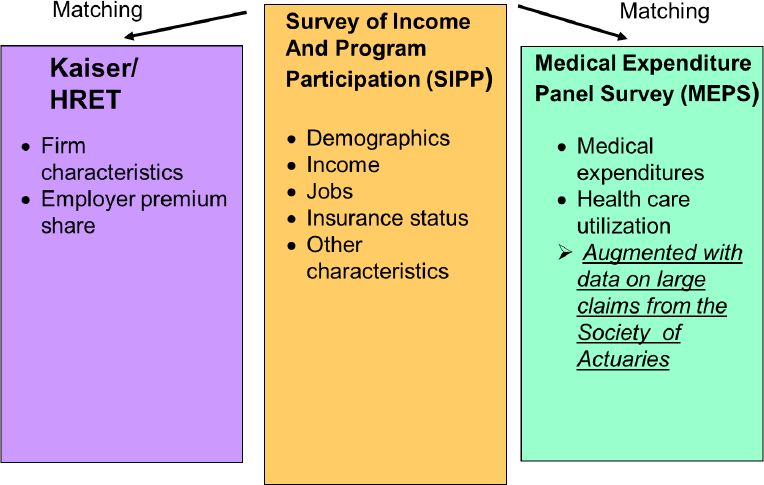
Figure 1

How COMPARE creates a synthetic representation of the U.S. from its data sources.
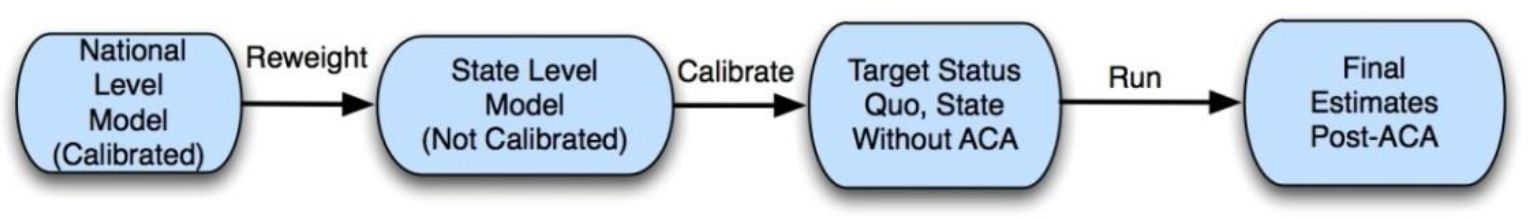
Figure 2

Schematic representation of the reweight-calibrate-run or RCR procedure.
Tables
Table 1
U.S. Health insurance coverage in 2012.
| Type of coverage | Who is covered | Funding source | Number (in millions) | Percentage of the population |
|---|---|---|---|---|
| Employer-sponsored insurance | Employees of offering firms and their family members | Employer and employee contributions | 170.9 | 54.9% |
| Private Nongroup (also known as “individual market”) | Individuals and families purchasing coverage | Individual premiums | 30.6 | 9.8% |
| Medicaid/CHIP | Low-income children, parents, elderly, and disabled; childless nondisabled adults are eligible in some states | Federal government and states; counties share financial responsibility in some states | 50.9 | 16.4% |
| Medicare | Elderly and disabled | Federal government | 48.9 | 15.7% |
| Military | Current members of the armed forces and their families, veterans | Federal government | 13.7 | 4.4% |
| Uninsured | N/A | N/A | 48.0 | 15.4% |
| TOTAL | 311.1 | 116.7% |
-
Note: Percentages total more than 100.0% because some Current Population Survey Annual Social and Economic Supplement (CPS-ASEC) respondents reported more than one type of coverage during Calendar Year 2012.
Source: Carmen DeNavas-Walt, Bernadette D. Proctor, and Jessica C. Smith, U.S. Census Bureau, Current Population Reports, P60–245, Income, Poverty, and Health Insurance Coverage in the United States: 2012, U.S. Government Printing Office, Washington, DC, 2013, p. 67.
Table 2
Medical loss ratio assumptions in compare.
| Pre-Reform, Grandfathered, and Large Group Plans | Post-Reform, Regulated market | |
|---|---|---|
| Group Market | ||
| < 25 | 0.80 | 0.88 |
| 26–100 | 0.87 | 0.88 |
| 101 + | 0.92 | NA |
| Non-group market | 0.70 | 0.80 |
-
Note: NA means not applicable, since the MLRs of firms with 101+ employees are not modified by the Affordable Care Act.
Table 3
Comparison of compare and CBO national-level coverage estimates for the non-elderly U.S. population in the year 2016 (in millions).
| Insurance Coverage | CBO (no ACA) | CBO (ACA) | CBO (change due to ACA) | COMPARE (no ACA) | COMPARE (ACA) | COMPARE (Change due to ACA) |
|---|---|---|---|---|---|---|
| Medicaid and CHIP | 33 | 45 | 12 | 46 | 62 | 16 |
| Employer sponsored | 161 | 155 | −6 | 154 | 154 | 0 |
| Non-group and Other | 26 | 22 | −4 | 24 | 12 | −12 |
| Individual Exchanges | NA | 22 | 22 | NA | 26 | 26 |
| Uninsured | 56 | 31 | −25 | 52 | 23 | −29 |
-
Note: ACA=Affordable Care Act.
Download links
A two-part list of links to download the article, or parts of the article, in various formats.