Microsimulation model projecting small area populations using contextual variables: An application to the Montreal metropolitan area, 2006–2031
- INRS – Centre Urbanisation Culture Société, Canada
Cite this article
as: G. Marois, A. Bélanger; 2014; Microsimulation model projecting small area populations using contextual variables: An application to the Montreal metropolitan area, 2006–2031; International Journal of Microsimulation; 7(1); 158-193.
doi: 10.34196/ijm.00097
- Article
- Figures and data
- Jump to
Figures
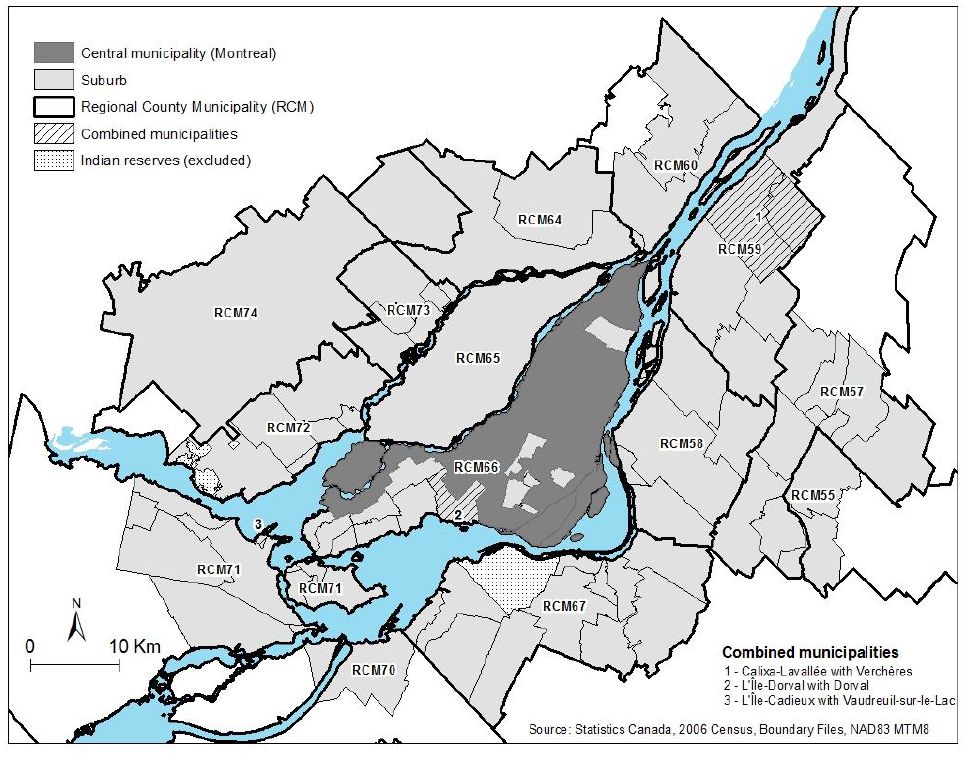
Figure 1

The central municipality of the MMC and municipalities included in the suburb.
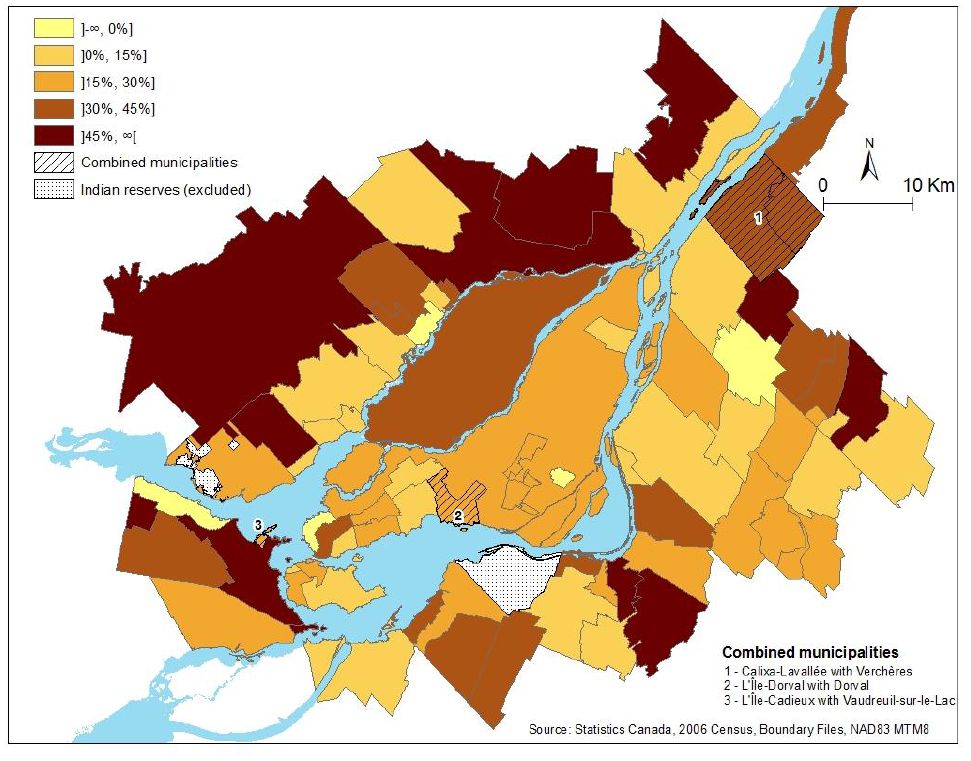
Figure 2

Projected population growth rates by municipality, MMC, 2006 to 2031.
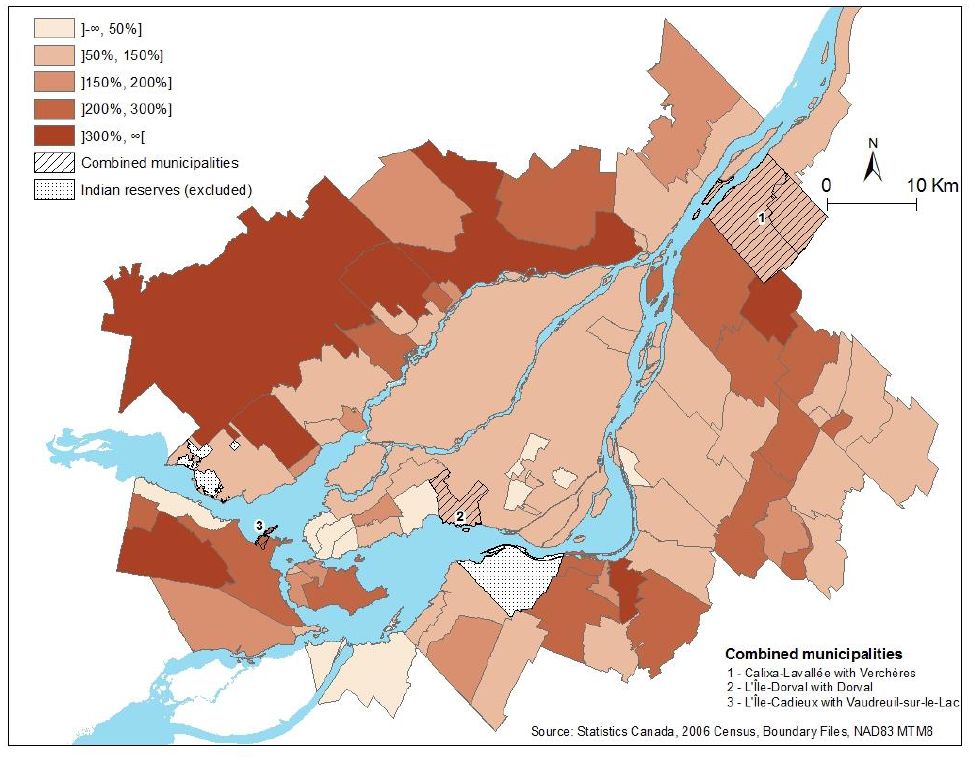
Figure 3

Projected growth of the population aged 65 and over by municipality, MMC, 2006 to 2031.
Tables
Table 1
Summary of events.
| Events | Population at risk | Outcome | Independent variables | ||||||||
|---|---|---|---|---|---|---|---|---|---|---|---|
| Age | Sex | Place of birth | Number of years since arrival | Age at immigra-tion | RCM | Munici-pality | Type of municipality | Language spoken at home | |||
| Death | Everyone | If the event occurs, the individual is removed from the simulation. Otherwise, time variables (age, duration of residence for immigrants) are incremented by one | x | x | x | x | |||||
| Fertility | Women aged between 15 and 49 years old | A new individual is added to the simulation. Child characteristics are determined in the birth module | x | x | x | x | x | ||||
| International emigration | Everyone, except births of the year | The individual is removed from the simulation | x | x | |||||||
| Interprovincial out-migration | Everyone, except births of the year | The individual is removed from the simulation | x | x | x | x | x | ||||
| Intraprovincial out-migration | Everyone, except births of the year | The individual is removed from the simulation | x | x | x | x | |||||
| Migration from the central municipality to the suburb | People living in the central municipality, except births of the year | The individual is identified as a migrant from the central municipality to the suburb. The municipality of residence is determined in the residential location module | x | x | |||||||
| Migration from the suburb to the central municipality | People living in the suburb, except births of the year | The municipality of residence becomes the central municipality (Montreal) | x | x | x | ||||||
| Migration within the suburb | People living in the suburb, except births of the year | The individual is identified as a migrant within the suburb. The municipality of residence is determined in the residential location module | x | x | x | x | |||||
| Language shift toward French | Allophones | The language spoken at home is changed to French | x | x | x | x | |||||
| Language shift toward English | Allophones | The language spoken at home is changed to English | x | x | x | x | |||||
Table 2
Estimated emigration rates of immigrants by years since arrival.
| Number of years since arrival | Emigration rate |
|---|---|
| 1 | 4.40% |
| 2 | 4.40% |
| 3 | 2.95% |
| 4 | 1.50% |
| 5 | 1.50% |
| 6 | 1.50% |
| 7 | 1.50% |
| 8 | 1.40% |
| 9 | 1.30% |
| 10 | 1.30% |
| 11 | 1.30% |
| 12 | 1.30% |
| 13 | 0.65% |
-
Source: Termote, Payeur et al. 2011. Annualized by authors.
Table 3
Parameters of interprovincial and intraprovincial outmigration, Montreal metropolitan community, 2001 and 2006 census.
| Interprovincial out-migration (n=1,292,224) | Intraprovincial out-migration (n=1,292,224) | |
|---|---|---|
| Intercept | −5.796*** | −3.652*** |
| Age groups (ref=30–34) | ||
| 0–4 | −0.063 | −0.173*** |
| 5–9 | −0.268*** | −0.632*** |
| 10–14 | −0.718*** | −0.955*** |
| 15–19 | −0.696*** | −0.707*** |
| 20–24 | 0.322*** | 0.263*** |
| 25–29 | 0.419*** | 0.305*** |
| 35–39 | −0.338*** | −0.387*** |
| 40–44 | −0.619*** | −0.688*** |
| 45–49 | −0.812*** | −0.789*** |
| 50–54 | −0.956*** | −0.651*** |
| 55–59 | −0.993*** | −0.534*** |
| 60–64 | −0.874*** | −0.638*** |
| 65–69 | −1.285*** | −0.896*** |
| 70–74 | −1.461*** | −1.357*** |
| 75+ | −1.024*** | −1.381*** |
| Language spoken at home (ref = French) | ||
| English | 2.206*** | −1.680*** |
| Other(s) | 1.421*** | −1.856*** |
| Place of birth (ref = born in Canada) | ||
| Foreign-born | −0.883*** | |
| Number of years since arrival (ref = Born in Canada) | ||
| 0–4 | 1.074*** | |
| 5–9 | 0.602*** | |
| 10–14 | 0.189** | |
| 15+ | −0.291*** | |
| RCM of residence (ref = RCM66) | ||
| RCM55 and RCM57 | −0.581*** | 0.326*** |
| RCM58 | −0.420*** | −0.067* |
| RCM59 | −0.228 | 0.086 |
| RCM60 | −1.113*** | 0.163*** |
| RCM64 | −0.817*** | −0.009 |
| RCM65 | −0.870*** | −0.252*** |
| RCM67 and RCM70 | −0.393*** | 0.060 |
| RCM71 | −0.205** | 0.388*** |
| RCM72 | −0.698*** | −0.199** |
| RCM73 and RCM74 | −0.546*** | 0.236*** |
-
*
p<0.05.
-
**
p<0.01.
-
***
p<0.0001.
Table 4
Parameters of logistic regressions modeling internal outmigration between municipalities of the Montreal metropolitan community, 2001 and 2006.
| From the central municipality to the suburb (n=586,151) | From the suburb to the central municipality (n=682,659) | Within the suburb (n=682,659) | |
|---|---|---|---|
| Intercept | −3.024 *** | −3.741 *** | −3.004 *** |
| Age groups (ref=30–34) | |||
| 0–4 | −0.089 * | −0.836 *** | −0.199 *** |
| 5–9 | −0.501 *** | −1.092 *** | −0.558 *** |
| 10–14 | −0.753 *** | −1.479 *** | −0.935 *** |
| 15–19 | −1.065 *** | −0.518 *** | −0.892 *** |
| 20–24 | −0.490 *** | 0.787 *** | 0.064 * |
| 25–29 | 0.058 | 0.711 *** | 0.485 *** |
| 35–39 | −0.321 *** | −0.502 *** | −0.443 *** |
| 40–44 | −0.743 *** | −0.804 *** | −0.810 *** |
| 45–49 | −1.030 *** | −0.871 *** | −1.095 *** |
| 50–54 | −1.253 *** | −0.976 *** | −1.184 *** |
| 55–59 | −1.281 *** | −1.263¨*** | −1.264 *** |
| 60–64 | −1.397 *** | −1.521 *** | −1.412 *** |
| 65–69 | −1.517 *** | −1.512 *** | −1.518 *** |
| 70–74 | −1.748 *** | −1.469 *** | −1.529 *** |
| 75+ | −1.658 *** | −1.226 *** | −1.308 *** |
| Language spoken at home (ref = French) | |||
| English | −0.353 *** | −0.361 *** | |
| Other(s) | −0.631 *** | −0.662 *** | |
| Place of birth (ref = born in Canada) | |||
| Foreign-born | 0.170 *** | −0.200 *** | |
| RCM of residence (ref = RCM66) | |||
| RCM55 and RCM57 | −0.477 *** | 0.386 *** | |
| RCM58 | −0.127 ** | 0.126 ** | |
| RCM59 | −0.456 *** | 0.091 | |
| RCM60 | 0.120 * | −0.278 *** | |
| RCM64 | −0.288 *** | 0.083 * | |
| RCM65 | −0.133 ** | −0.208 *** | |
| RCM67 and RCM70 | −0.295 *** | 0.224 *** | |
| RCM71 | −0.277 *** | 0.232 *** | |
| RCM72 | −0.429 *** | 0.593 *** | |
| RCM73 and RCM74 | −0.556 *** | 0.430 *** |
-
*
p<0.05.
-
**
p<0.01.
-
***
p<0.0001.
Table 5
Parameters of conditional logistic regressions modeling the municipality of destination for internal and external migrants, Montreal metropolitan community, 2001 and 2006 censuses.
| Intraprovincial in-migrants (n=14528) | Interprovincial in-migrants (n=4613) | International immigrants (n=14993) | Migrants from the central municipality (n=12565) | Migrants from another suburb (n=18080) | |
|---|---|---|---|---|---|
| Distance to downtown (km) | −0.014 *** | −0.007 ** | |||
| Population size | 1.894E-06 *** | 2.301E-06 *** | 2.444E-06 *** | 8.848E-06 *** | 7.864E-06 *** |
| Kind of municipality (ref = City) | |||||
| Village | −2.159 *** | −1.966 *** | −2.148 *** | −2.220 *** | −1.757 *** |
| Town | −1.233 *** | −0.997 *** | −0.971 *** | −1.155 *** | −0.831 *** |
| New housings | 5.230E-05 ** | 2.900E-04 *** | 2.097E-04 *** | ||
| Majority of Francophones | 3.224 *** | 0.937 *** | 1.490 *** | 0.544 *** | 0.754 *** |
| * anglophone migrant | −3.034 *** | −1.412 *** | −1.914 *** | −2.550 *** | −3.518 *** |
| * allophone migrant | −2.258 *** | −0.713 *** | −0.815 *** | −1.433 *** | −2.740 *** |
| RCM of residence (ref = RCM65 and RCM66) | |||||
| RCM55 and RCM57 | −0.773 *** | −1.438 *** | −2.455 *** | −0.007 | 1.527 *** |
| RCM58 | −0.117 * | −0.102 | −0.170 ** | 0.655 *** | 1.525 *** |
| RCM59 | −1.093 *** | −1.554 *** | −2.681 *** | 0.007 | 1.199 *** |
| RCM60 | −0.493*** | −1.475 *** | −2.459 *** | 1.115 *** | 1.315 *** |
| RCM64 | −0.386 *** | −0.927 *** | −2.363 *** | 1.057 *** | 1.994 *** |
| RCM67 and RCM70 | −0.988 *** | −1.855 *** | −2.995 *** | 0.530 *** | 1.324*** |
| RCM 71 | −0.893 *** | −0.282 * | −1.587 *** | 0.966 *** | 1.274 *** |
| RCM72 | −0.988 *** | −1.600 *** | −2.257 *** | 0.473 *** | 1.777 *** |
| RCM73 and RCM74 | −0.474 *** | −0.967 *** | −2.113 *** | 0.325 *** | 1.867 *** |
-
*
p<0.05.
-
**
p<0.01.
-
***
p<0.0001.
Table 6
Distribution of municipalities according to the absolute percent error.
| [10%, ∞[ | 4 |
| [5%, 10%[ | 15 |
| [2.5%, 5%[ | 21 |
| [0, 2.5%[ | 39 |
Table 7
Mean absolute percent error between population estimates in 2011 and the simulation by population size and growth rate of the municipality.
| Total population | Population by age groups (16)a | |
|---|---|---|
| Overallb | 3.4% | 12.3% |
| Population size | ||
| [50,000, ∞[ | 1.2% | 5.6% |
| [15,000, 50,000[ | 2.3% | 9.3% |
| [5,000, 15,000[ | 4.0% | 12.5% |
| [0, 5,000[ | 5.7% | 21.4% |
| Population growth rate 2006–2011 | ||
| [10%, ∞[ | 4.3% | 10.7% |
| [5%, 10%[ | 2.9% | 10.7% |
| [0%, 5%[ | 3.0% | 13.1% |
| ]-∞, 0%[ | 4.1% | 15.1% |
-
a
This is the arithmetic mean of the MAPE of 16 age groups.
-
b
This is the arithmetic mean of the MAPE of the 79 municipalities.
Table 8
Synthesis of population projection results, MMC, 2006–2031.
| Distribution of municipalities by population growth between 2006–2031 | |
| [50%, ∞[ | 10 |
| [25%, 50%[ | 23 |
| [10%, 25%[ | 28 |
| [0%, 10%[ | 13 |
| ]-∞, 0%[ | 5 |
| Mean relative growth by initial municipality’s population size | |
| [50,000, ∞[ | 33.4% |
| [15,000, 50,000[ | 25.9% |
| [5,000, 15,000[ | 23.5% |
| [0, 5,000[ | 26.2% |
Table 9
Distribution of municipalities according to the relative rate change in the proportion of francophones (percentage points), 2006 to 2031.
| [0, ∞[ | 14 |
| [−5, 0[ | 12 |
| [−10, −5[ | 11 |
| [−15, −10[ | 33 |
| ]-∞, −15[ | 9 |
Table
Table Results from simulations and population estimates.
| Population estimates | Results from 2006–2011 pre-simulations | |||||
|---|---|---|---|---|---|---|
| 2006 | 2011 | No adjustment | Out-migration assumption adjusted | Fertility assumption adjusted | Results from 2011–2031 simulation | |
| (1) | (2) | (3) | (4) | (5) | (6) | |
| Montréal | 3,570,100 | 3,791,100 | 3,758,132 | 3,781,745 | 3,783,223 | 4,553,217 |
| Baie-D’Urfé | 3,900 | 3,930 | 3,828 | 3,620 | 3,850 | 4,151 |
| Beaconsfield | 19,255 | 20,330 | 19,557 | 20,269 | 20,332 | 24,016 |
| Beauharnois | 12,000 | 12,235 | 11,117 | 11,145 | 11,186 | 12,523 |
| Beloeil | 19,135 | 20,465 | 20,944 | 20,852 | 20,581 | 25,210 |
| Blainville | 47,025 | 53,165 | 52,059 | 51,757 | 51,568 | 63,538 |
| Boisbriand | 26,700 | 26,485 | 26,791 | 26,823 | 26,855 | 29,541 |
| Bois-des-Filion | 8,455 | 9,450 | 9,591 | 9,540 | 9,321 | 12,165 |
| Boucherville | 39,275 | 41,570 | 41,073 | 41,176 | 41,254 | 46,811 |
| Brossard | 71,765 | 80,235 | 79,763 | 80,580 | 79,432 | 95,579 |
| Candiac | 16,145 | 19,575 | 18,691 | 18,739 | 19,259 | 28,188 |
| Carignan | 7,545 | 8,020 | 7,989 | 7,637 | 8,009 | 9,414 |
| Chambly | 22,880 | 25,440 | 23,549 | 23,677 | 23,673 | 27,527 |
| Charlemagne | 5,670 | 5,775 | 5,621 | 5,697 | 5,965 | 6,480 |
| Châteauguay | 43,140 | 46,330 | 45,417 | 46,167 | 45,391 | 55,330 |
| Contrecoeur | 5,740 | 6,290 | 6,081 | 6,190 | 6,050 | 7,531 |
| Côte-Saint-Luc | 31,450 | 33,550 | 31,945 | 32,539 | 32,228 | 36,989 |
| Delson | 7,410 | 7,555 | 7,591 | 7,828 | 7,942 | 9,348 |
| Deux-Montagnes | 17,615 | 17,545 | 18,025 | 17,946 | 17,902 | 19,191 |
| Dollard-Des Ormeaux | 49,240 | 50,825 | 47,372 | 48,929 | 49,166 | 50,313 |
| Dorval and L’Île-Dorval | 18,185 | 19,250 | 19,197 | 19,253 | 18,999 | 23,112 |
| Hampstead | 6,995 | 7,500 | 7,382 | 7,179 | 7,531 | 8,585 |
| Hudson | 5,120 | 4,890 | 4,532 | 4,882 | 5,411 | 3,169 |
| Kirkland | 20,575 | 21,215 | 21,043 | 21,251 | 20,973 | 23,788 |
| La Prairie | 22,040 | 23,975 | 23,569 | 23,364 | 23,098 | 28,357 |
| L’Assomption | 16,940 | 19,755 | 19,531 | 20,132 | 19,993 | 29,545 |
| Laval | 372,415 | 404,110 | 403,016 | 400,079 | 401,717 | 521,664 |
| Léry | 2,420 | 2,325 | 2,622 | 2,456 | 2,793 | 3,265 |
| Les Cèdres | 5,810 | 5,960 | 5,959 | 6,009 | 5,546 | 6,765 |
| L’Île-Perrot | 10,105 | 10,595 | 10,774 | 10,460 | 10,708 | 13,003 |
| Longueuil | 231,585 | 236,755 | 236,858 | 235,889 | 235,395 | 249,684 |
| Lorraine | 9,685 | 9,420 | 9,437 | 9,461 | 9,439 | 9,780 |
| Mascouche | 34,305 | 40,960 | 41,288 | 40,776 | 41,969 | 59,383 |
| McMasterville | 5,290 | 5,520 | 5,459 | 5,784 | 5,429 | 6,656 |
| Mercier | 10,250 | 11,585 | 10,346 | 10,309 | 10,201 | 13,789 |
| Mirabel | 35,310 | 41,165 | 41,083 | 40,087 | 41,053 | 56,790 |
| Montréal | 1,638,870 | 1,723,940 | 1,704,182 | 1,734,634 | 1,733,374 | 2,070,328 |
| Montréal-Est | 3,865 | 4,010 | 3,963 | 3,910 | 3,903 | 4,088 |
| Montréal-Ouest | 5,225 | 5,395 | 5,095 | 5,171 | 5,250 | 6,143 |
| Mont-Royal | 18,995 | 20,225 | 20,156 | 20,462 | 19,720 | 21,950 |
| Mont-Saint-Hilaire | 15,865 | 17,410 | 18,671 | 18,438 | 18,194 | 23,341 |
| Notre-Dame-de-l’Île-Perrot | 10,030 | 10,430 | 9,826 | 10,153 | 10,099 | 10,910 |
| Oka | 3,310 | 3,700 | 3,373 | 3,510 | 3,252 | 4,031 |
| Otterburn Park | 8,580 | 8,470 | 8,613 | 8,502 | 8,260 | 9,527 |
| Pincourt | 11,375 | 13,690 | 12,928 | 12,456 | 12,793 | 13,812 |
| Pointe-Calumet | 6,645 | 6,455 | 7,148 | 6,425 | 6,754 | 7,386 |
| Pointe-Claire | 30,275 | 31,875 | 30,383 | 30,974 | 29,832 | 34,251 |
| Pointe-des-Cascades | 1,045 | 1,195 | 1,204 | 1,200 | 1,240 | 1,745 |
| Repentigny | 77,035 | 81,275 | 82,040 | 80,413 | 80,882 | 88,566 |
| Richelieu | 5,240 | 5,335 | 5,477 | 5,359 | 5,617 | 6,336 |
| Rosemère | 14,290 | 14,070 | 14,244 | 13,741 | 13,989 | 13,993 |
| Saint-Amable | 8,510 | 10,620 | 9,799 | 9,531 | 9,968 | 14,756 |
| Saint-Basile-le-Grand | 15,825 | 16,550 | 17,025 | 16,027 | 16,511 | 19,267 |
| Saint-Bruno-de-Montarville | 24,515 | 25,965 | 25,842 | 25,518 | 24,908 | 27,933 |
| Saint-Constant | 24,250 | 24,990 | 25,173 | 24,929 | 25,065 | 27,644 |
| Sainte-Anne-de-Bellevue | 5,235 | 5,425 | 5,415 | 5,743 | 5,408 | 7,110 |
| Sainte-Anne-des-Plaines | 13,165 | 13,730 | 12,769 | 12,909 | 12,888 | 13,204 |
| Sainte-Catherine | 16,405 | 16,885 | 17,435 | 17,620 | 17,383 | 22,110 |
| Sainte-Julie | 29,380 | 29,095 | 28,180 | 28,296 | 28,318 | 27,663 |
| Sainte-Marthe-sur-le-Lac | 11,485 | 14,840 | 13,341 | 12,841 | 13,595 | 12,816 |
| Sainte-Thérèse | 25,490 | 26,140 | 27,346 | 27,774 | 27,067 | 34,930 |
| Saint-Eustache | 42,610 | 43,525 | 44,060 | 42,886 | 43,773 | 48,375 |
| Saint-Isidore | 2,520 | 2,640 | 2,765 | 2,662 | 2,821 | 3,332 |
| Saint-Jean-Baptiste | 3,060 | 3,090 | 3,017 | 3,127 | 3,047 | 3,286 |
| Saint-Joseph-du-Lac | 5,035 | 6,245 | 6,437 | 6,730 | 6,490 | 9,209 |
| Saint-Lambert | 21,660 | 22,015 | 23,242 | 23,040 | 22,953 | 22,794 |
| Saint-Lazare | 17,260 | 18,980 | 19,040 | 19,279 | 19,452 | 24,881 |
| Saint-Mathias-sur-Richelieu | 4,570 | 4,465 | 4,376 | 4,579 | 4,523 | 4,691 |
| Saint-Mathieu | 1,890 | 1,990 | 1,929 | 1,823 | 1,827 | 2,173 |
| Saint-Mathieu-de-Beloeil | 2,315 | 2,545 | 2,398 | 2,524 | 2,763 | 3,327 |
| Saint-Philippe | 5,180 | 5,630 | 6,015 | 6,073 | 5,921 | 8,717 |
| Saint-Sulpice | 3,355 | 3,290 | 3,441 | 3,414 | 3,244 | 3,818 |
| Senneville | 980 | 985 | 897 | 1,107 | 974 | 967 |
| Terrasse-Vaudreuil | 2,000 | 1,925 | 2,034 | 1,895 | 1,958 | 2,031 |
| Terrebonne | 96,175 | 106,310 | 106,699 | 104,761 | 106,534 | 171,084 |
| Varennes | 21,175 | 20,680 | 22,028 | 21,518 | 21,476 | 23,841 |
| Vaudreuil-Dorion | 26,195 | 32,555 | 32,178 | 32,107 | 32,080 | 47,454 |
| Vaudreuil-sur-le-Lac and L’Île-Cadieux | 1,425 | 1,490 | 1,551 | 1,630 | 1,426 | 1,768 |
| Verchères and Calixa-Lavallée | 5,835 | 5,995 | 6,161 | 6,332 | 6,313 | 8,022 |
| Westmount | 20,580 | 21,280 | 21,136 | 21,240 | 21,159 | 18,427 |
-
Source: Institut de la statistique du Québec (2006 and 2011 population estimates); Authors calculation (simulations).
Download links
A two-part list of links to download the article, or parts of the article, in various formats.