A geospatial dynamic microsimulation model for household population projections
- Research Triangle Institute, United States
Cite this article
as: S. M. Rogers, J. Rineer, M. D. Scruggs, W. D. Wheaton, P. C. Cooley, D. J. Roberts, D. K. Wagener; 2014; A geospatial dynamic microsimulation model for household population projections; International Journal of Microsimulation; 7(2); 119-146.
doi: 10.34196/ijm.00102
- Article
- Figures and data
- Jump to
Figures
Figure 1
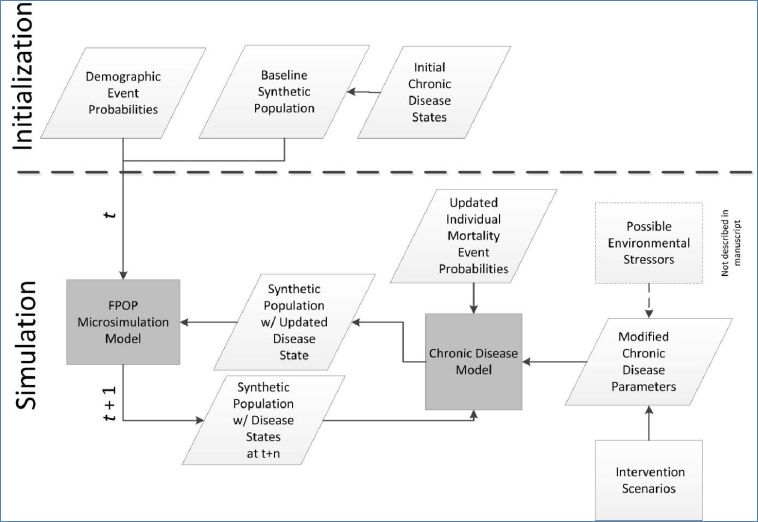
A model framework showing FPOP as the demographic core for a chronic disease scenario.
Figure 2
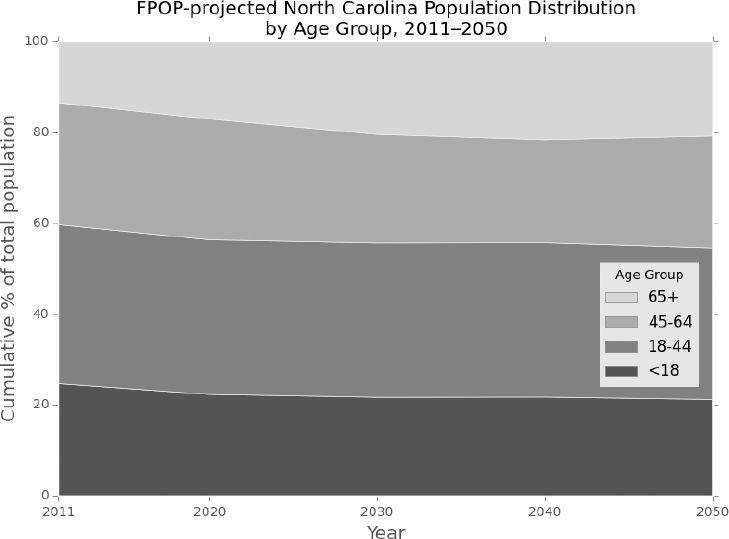
Projected age distribution of North Carolina, 2011–2050: FPOP.
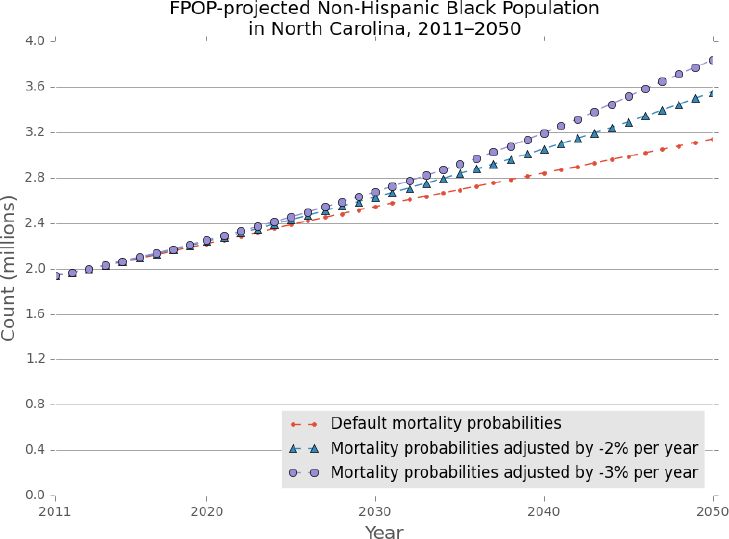
Figure 3

Projected non-Hispanic Black population, North Carolina 2011–2050 with default and adjusted mortality probabilities.
Figure 4
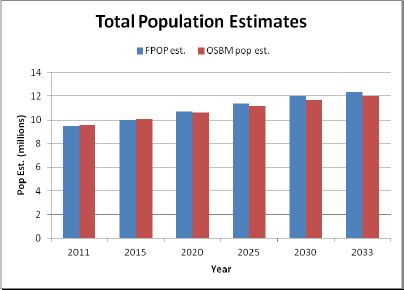
Population projections, North Carolina 2011–2033: FPOP and NC OSBM.
Figure 5

Trends in age structure by age groups, North Carolina 2011–2033: FPOP and NC OSBM.
Figure 6
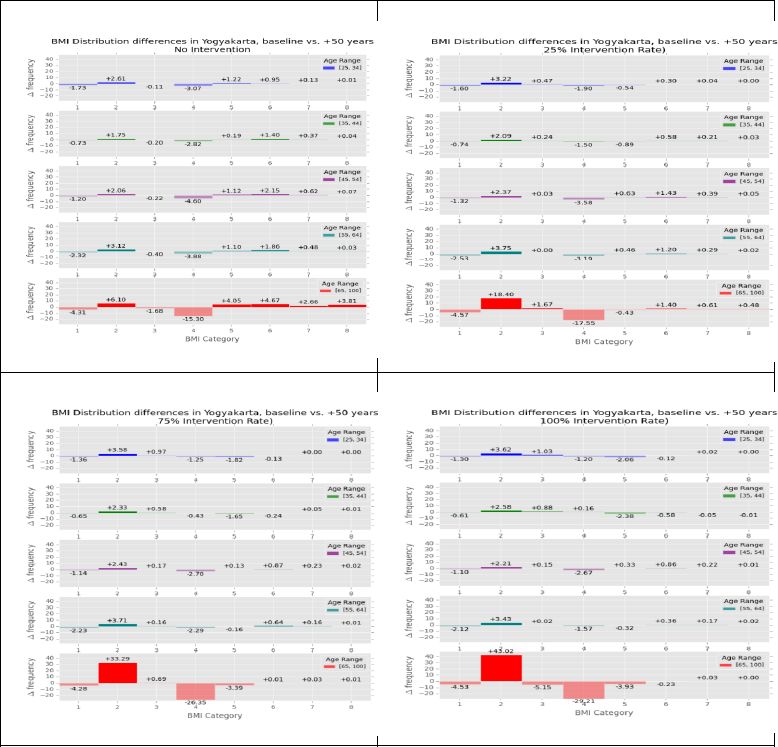

Estimated change in body mass index (BMI) for men and women in urban and rural settings by different participation rates in intervention programs.
Tables
Table 1
Initial demographic parameters applied to FPOP for a U.S. population.
| Parameter | Source of estimate | Geospatial level of estimate | Statistical model | Explanatory variables |
|---|---|---|---|---|
| Aging | 2007–2011 ACS | Time t -> t+1 | ||
| Mortality | NCHS/NVSS | National | Lifetable | Age, sex, race, Hispanic origin |
| Fertility | NCHS/NVSS | State | Age-race-parity specific probability | Age, race, parity Hispanic origin |
| Union | ||||
| Formation | ACS 2009 | State | Logistic regression | Age, sex, race Hispanic origin, education, employment, |
| Dissolution | ACS 2009 | State | Logistic regression | Age, sex, race, Hispanic origin, education, employment |
| Migration | ACS 2009; 2008–10 | State | Logistic regression | Age, sex, race, Hispanic origin |
-
ACS is the American Community Survey; NCHS NVSS is the National Center for Health Statistics / National Vital Statistics System.
Table 2
Components of population growth, North Carolina 2011–2033: FPOP and NC OSBM.
| Base Pop (2011 FPOP, 2010OSBM | Nat. Incr. | Net in-migration | Projected 2020 Pop | Nat. Incr. | Net in-migration | Projected 2030 Pop | Nat. Incr. | Net inmigration | Projected 2033 Pop | |
|---|---|---|---|---|---|---|---|---|---|---|
| 2010(1)–2020 | 2020–2030 | 2030–2033 | ||||||||
| FPOP Projections, 2011–2033 | 9,490,337 | 336,507 3.55% | 863,210 9.10% | 10,690,054 | 187,820 1.76% | 1,128,992 10.56% | 12,006,866 | 2,058 0.02% | 363,861 3.03% | 12,372,785 |
| NC OSBM, 2010–2033 | 9,535,471 | 319,121 3.35% | 762,267 7.99% | 10,616,859 | 166,140 1.56% | 899,263 8.47% | 11,682,262 | 16,607 0.14% | 301,691 2.58% | 12,000,560 |
| Ratio: OSBM/FPOP Projections | 1.005 | 0.993 | 0.973 | 0.970 | ||||||
-
Nat. Incr.: Natural Increase=Births-Deaths; NC OSBM projections tabulated for 10-year periods beginning April 2010 and ending July 2033. FPOP estimates tabulated for 10-year periods beginning April 2011 and ending April 2033.
Download links
A two-part list of links to download the article, or parts of the article, in various formats.