Microsimulation of language dynamics in a multilingual region with high immigration
- INRS – Centre Urbanisation Culture Société, Canada
Cite this article
as: P. Sabourin, A. Bélanger; 2015; Microsimulation of language dynamics in a multilingual region with high immigration; International Journal of Microsimulation; 8(1); 67-96.
doi: 10.34196/ijm.00112
- Article
- Figures and data
- Jump to
Figures
Figure 1

Percentage of individuals still using their mother tongue as the language most often spoken at home (Persistency) with respect to (A) age for Canadian-born Allophones, and (B) length of stay in Canada and age at immigration for immigrant Allophones (1991, 1996, 2001 and 2006 censuses).
Figure 2
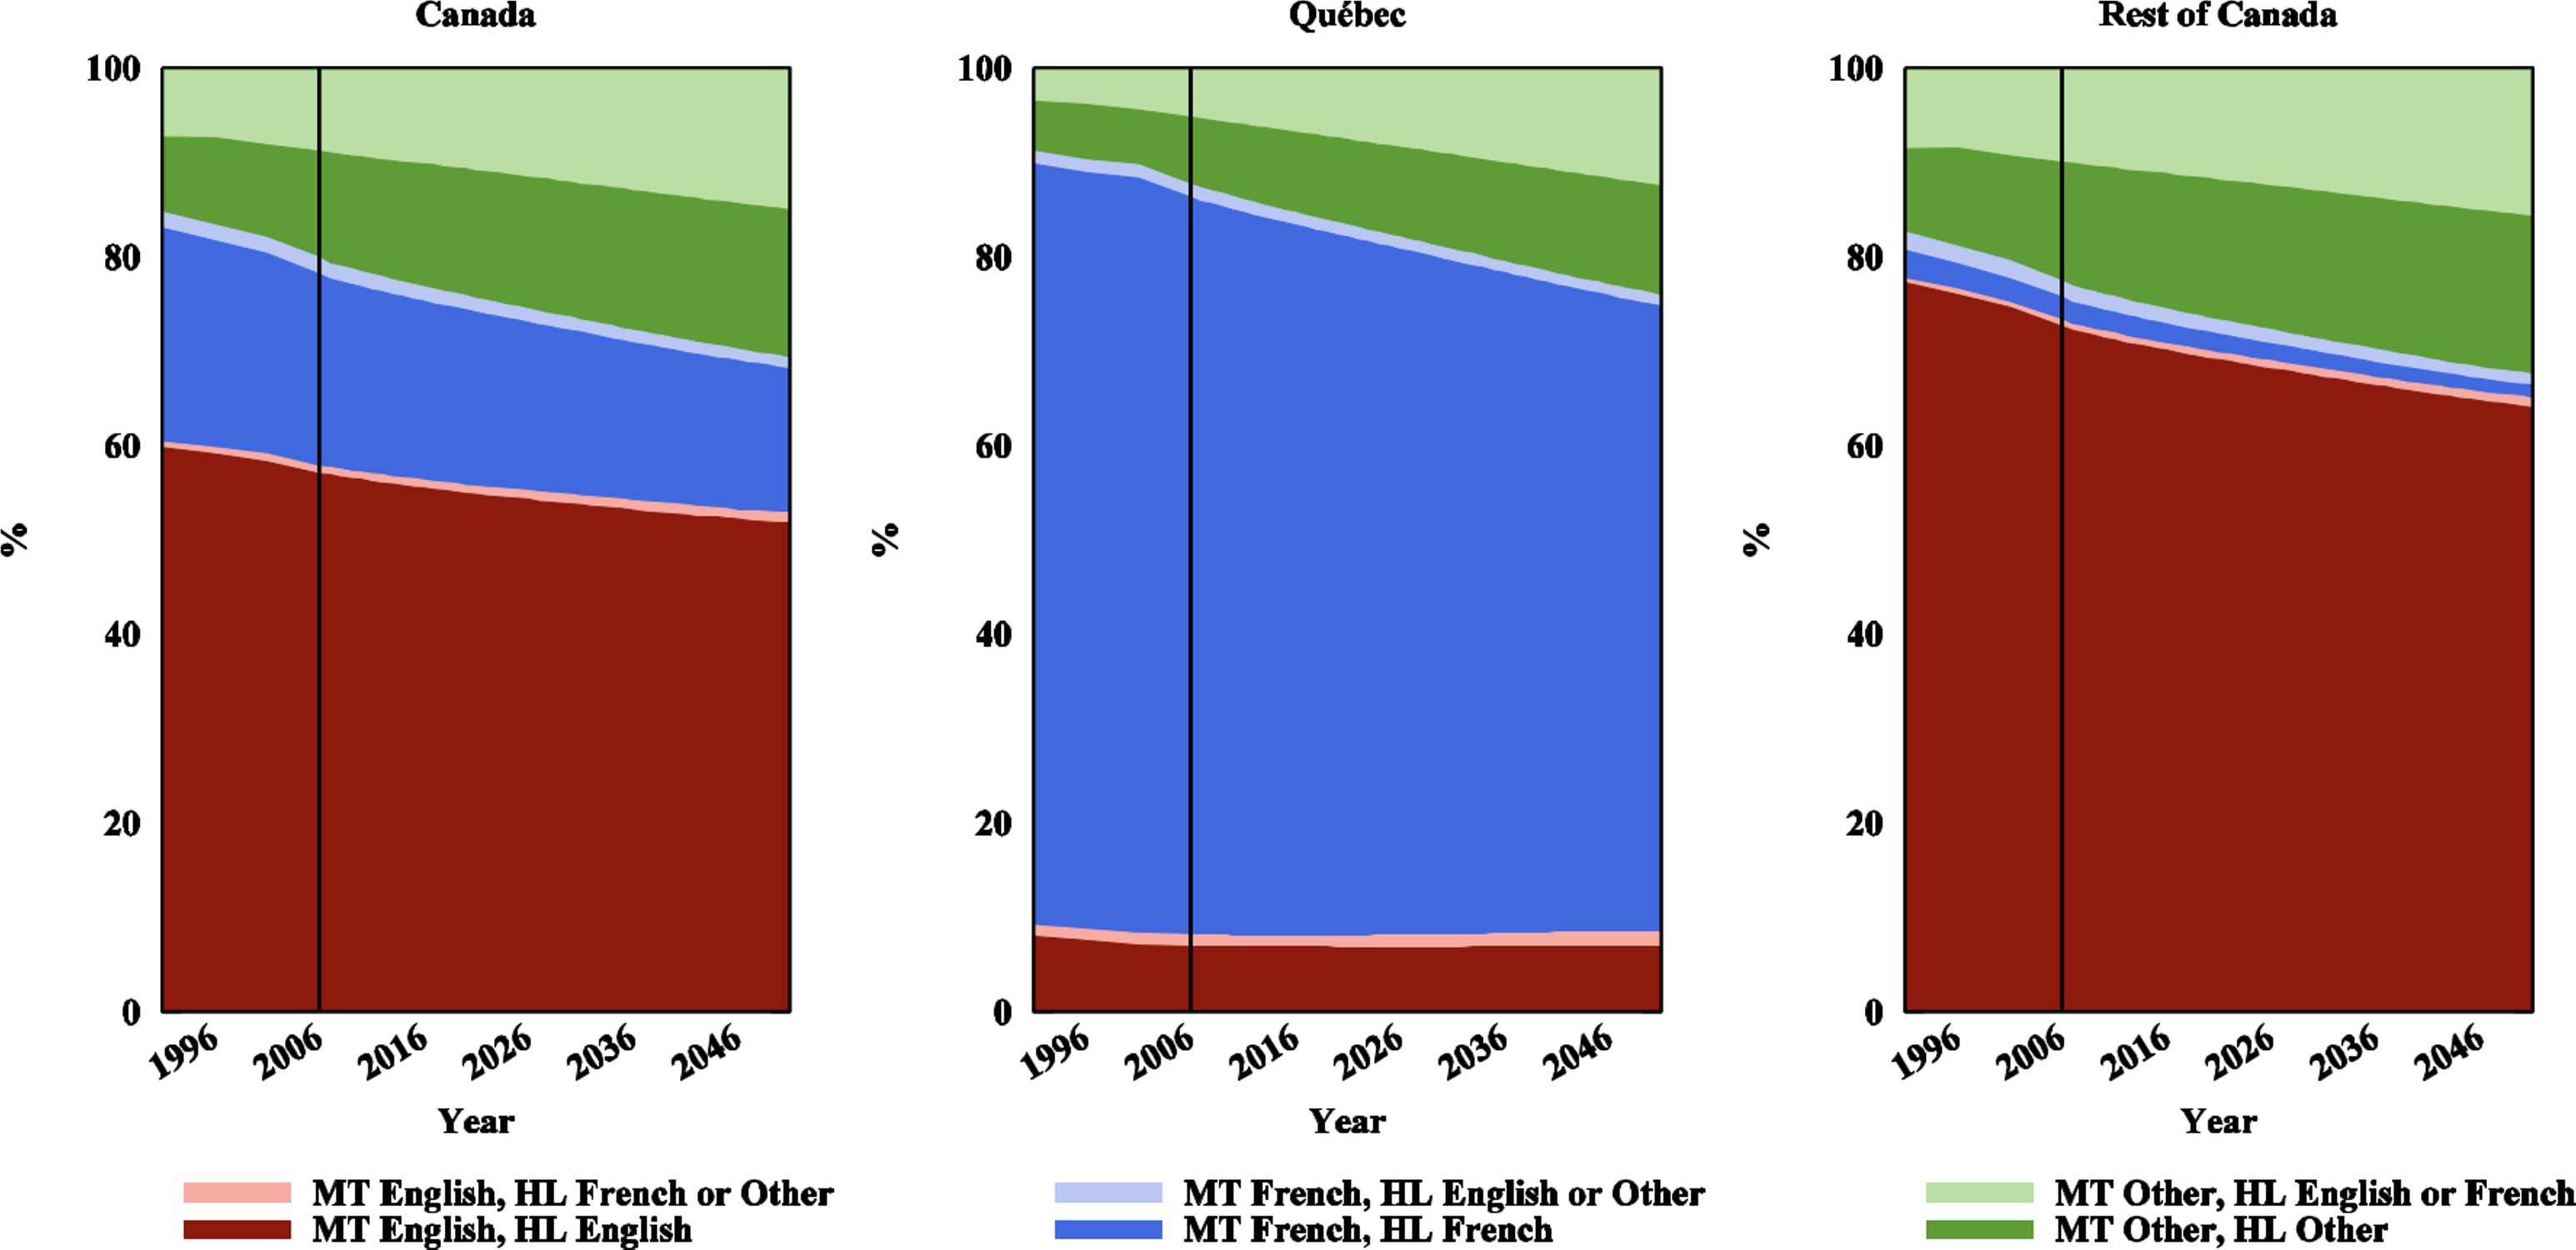
Linguistic composition of Canada as a whole (left panel), Québec (middle panel) and the rest of Canada (right panel), mother tongue (MT) and language spoken most often at home (HL). Light areas show the portion of a mother tongue group having performed a language shift. Census data for 1991 to 2006. Projection results for 2007–2051 (Base scenario).
Figure 3
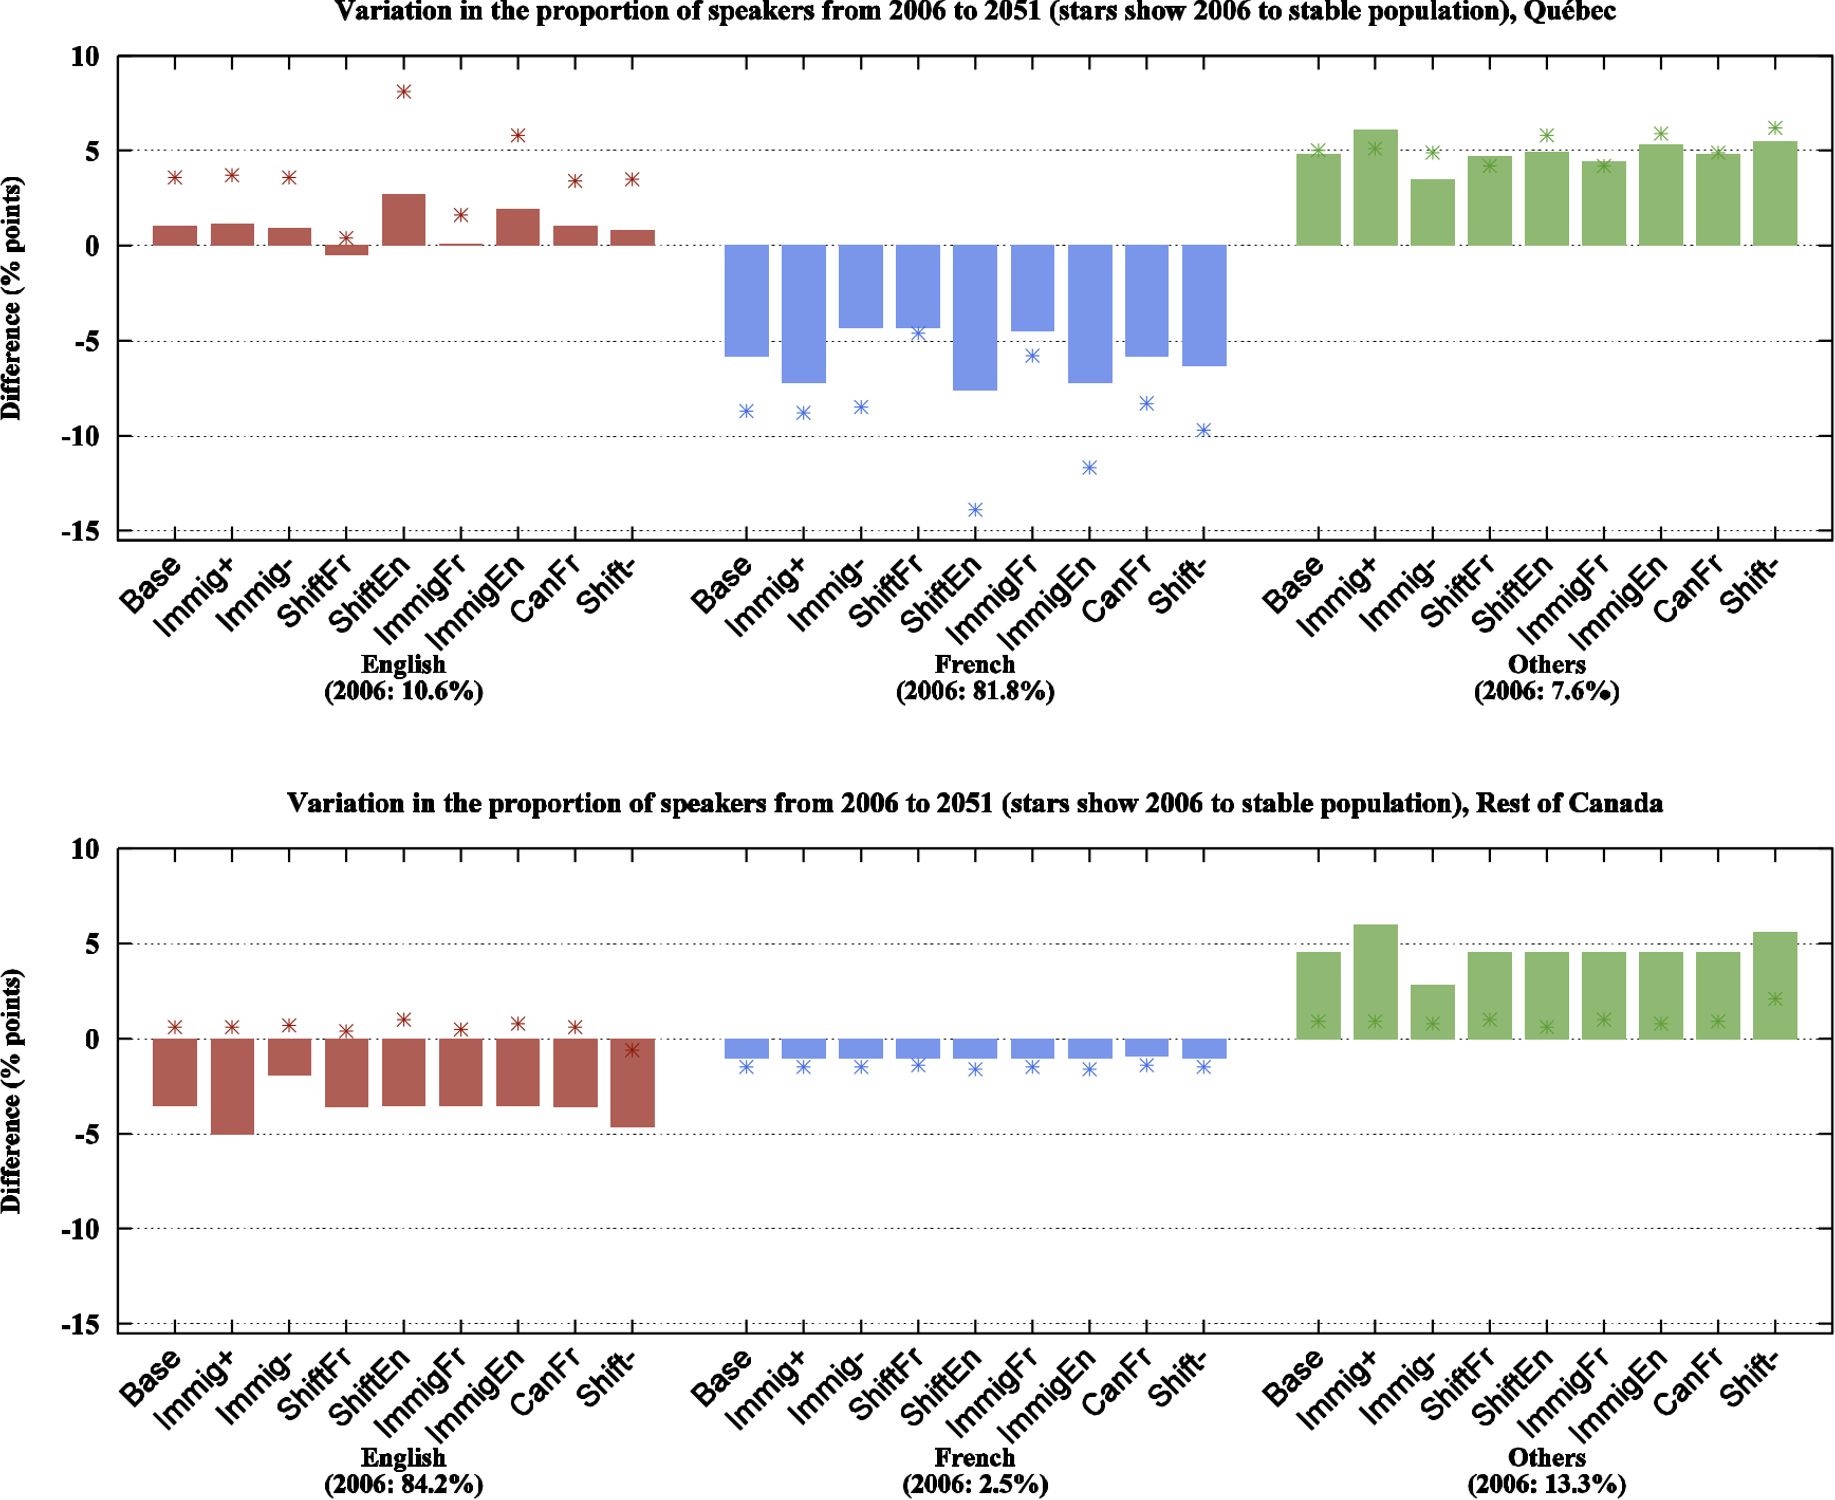
Variations in the linguistic composition of Québec (top panel) and of the rest of Canada (bottom panel) according to language spoken most often at home and projection scenario. English is shown in red, French in blue and other languages in green. Bars show variation from 2006 to 2051, stars show variation from 2006 to stable population. Census data for 2006. Projection results for 2051 and stable population.
Figure 4

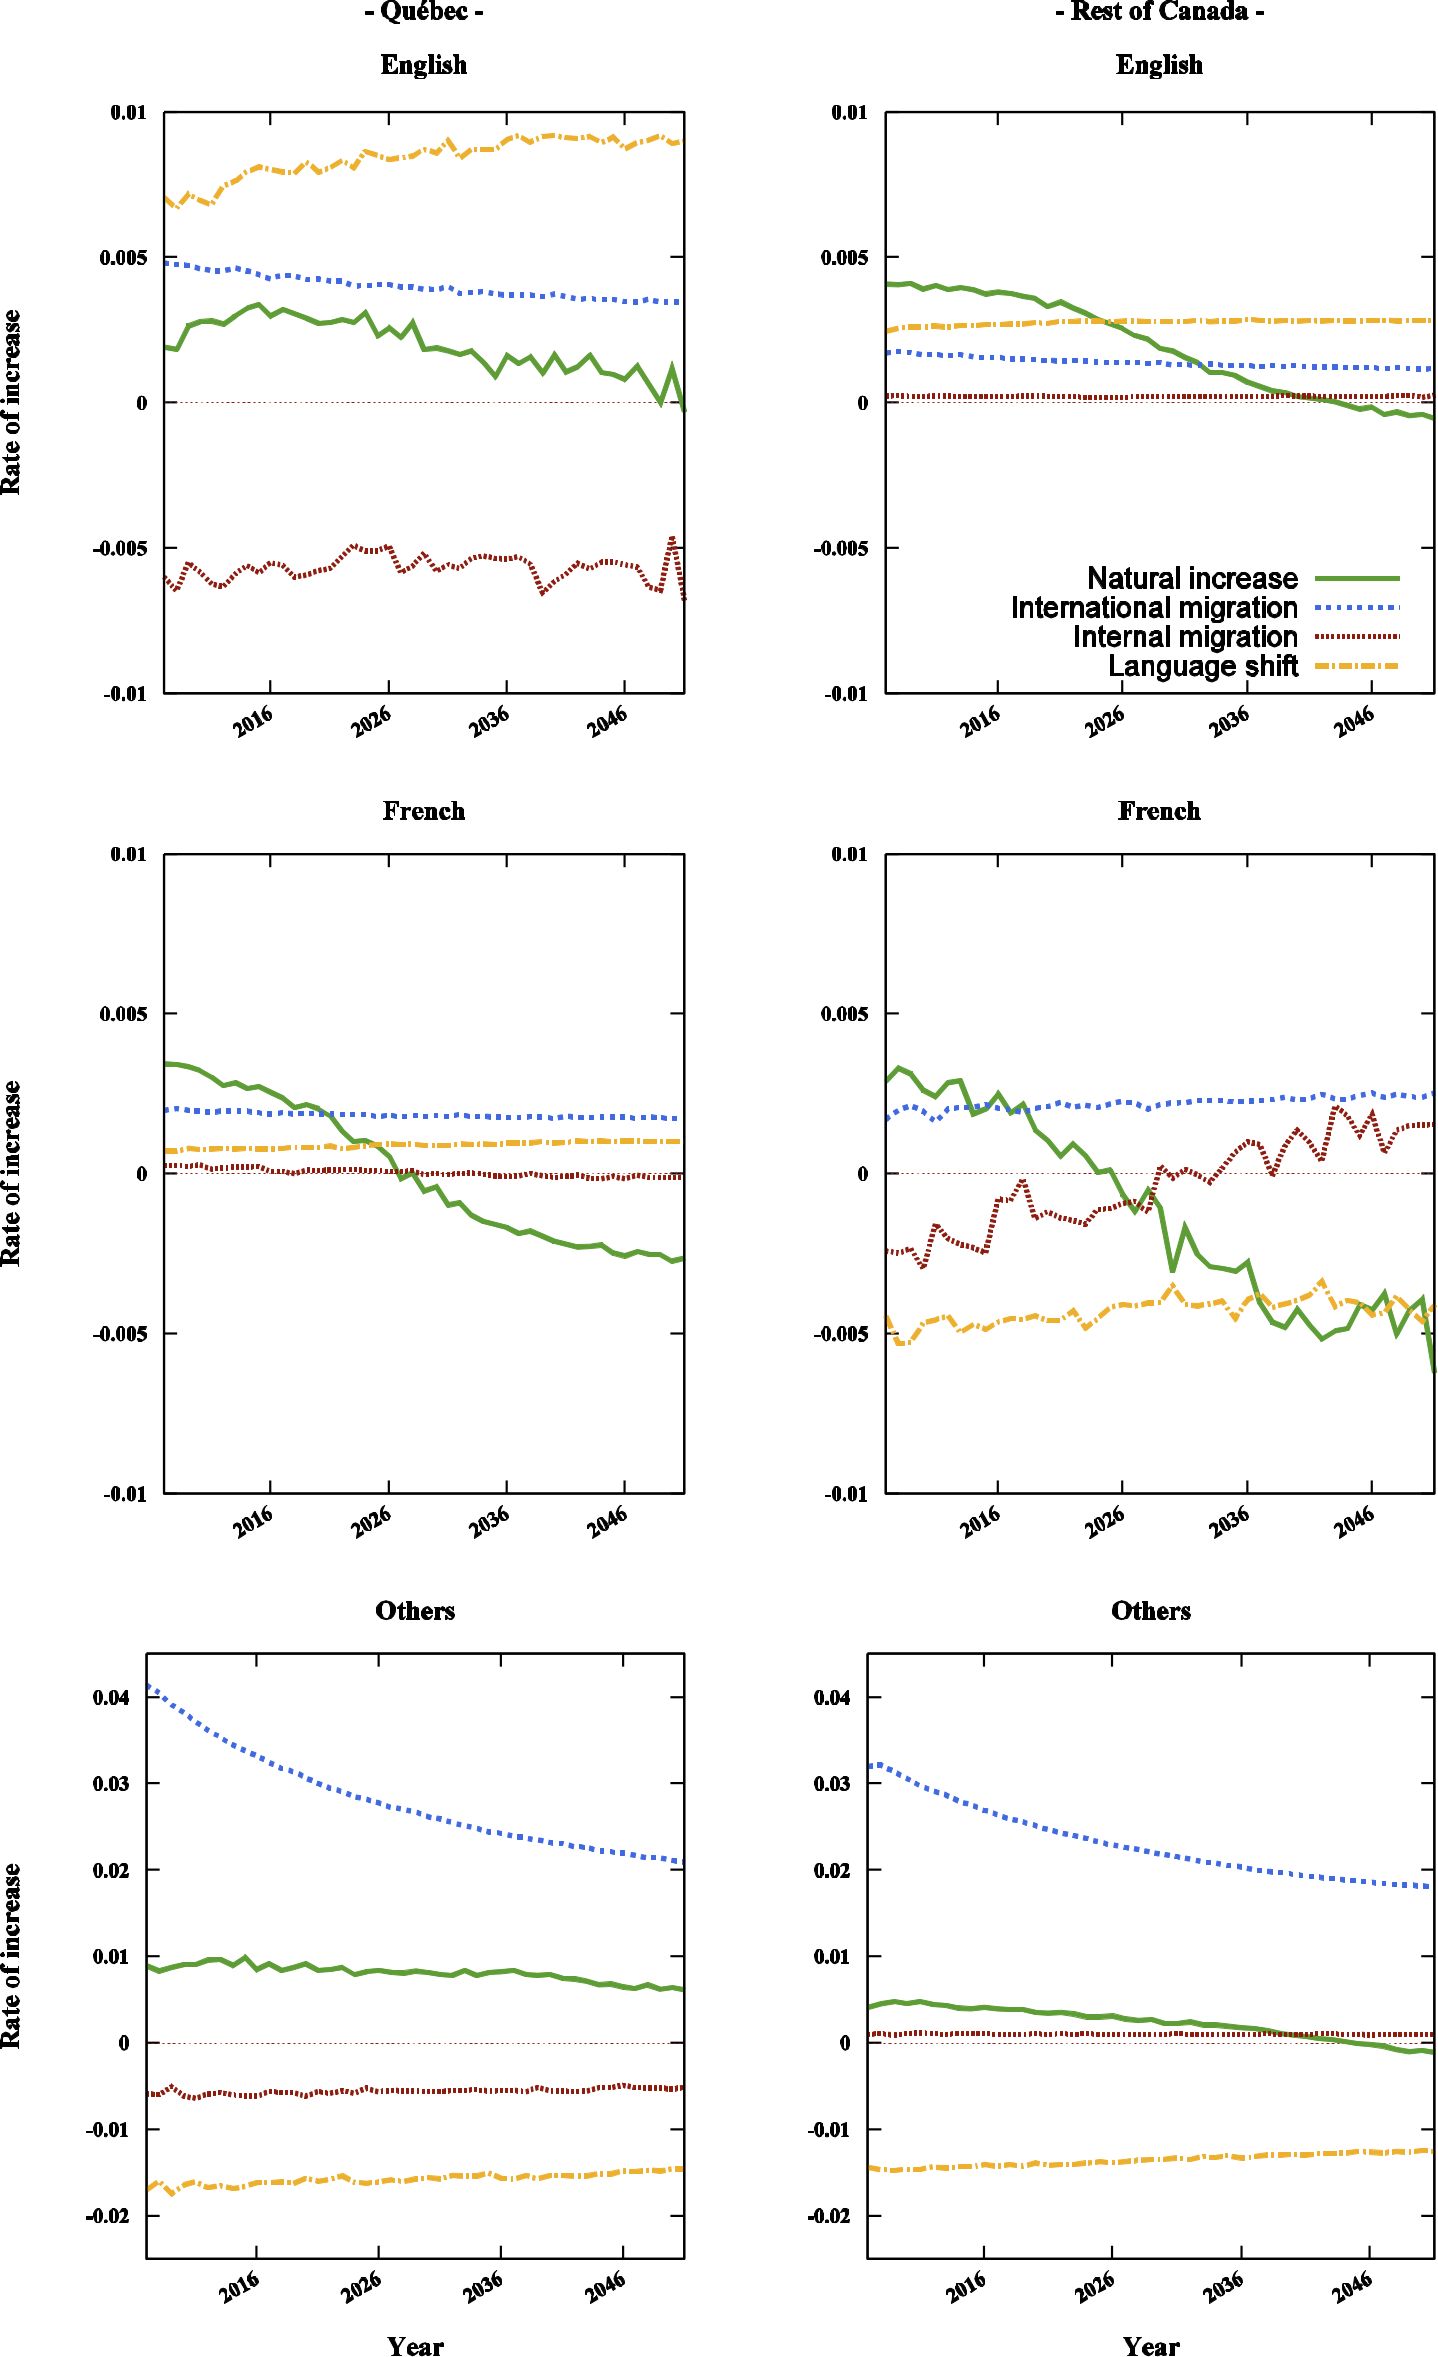
Components of growth for English speakers (first row), French speakers (second row) and third language speakers (third row), Québec (first column) and the rest of Canada (second column). Components of growth include rates of natural increase (mortality rate minus birth rate), international migration (immigration rate minus emigration rate), internal migration (inmigration rate minus outmigration rate) and net language shifts. Projection results from 2007 to 2051, Base scenario.
Tables
Table 1
Example of a transition matrix for intergenerational mother tongue transmission, immigrant mothers speaking French most often at home, Québec (2006 census). Category “Others” includes Anglotropes and Francotropes.
| Mother’s mother tongue | ||||
|---|---|---|---|---|
| English | French | Others | ||
| Child’s mother tongue | English | 16% | 2% | 2% |
| French | 84% | 98% | 74% | |
| Others | 0% | 0% | 24% | |
| 100% | 100% | 100% | ||
Table 2
Example of a transition matrix for intragenerational language shifts, individuals aged less than forty and born in Canada, Québec (2006 census).
| Mother tongue | |||||
|---|---|---|---|---|---|
| English | French | Others – A | Others – F | ||
| Home language | English | – | 81% | 84% | 20% |
| French | 89% | – | 16% | 80% | |
| Others | 11% | 19% | – | – | |
| 100% | 100% | 100% | 100% | ||
Table 3
Geographical distribution of immigrants arrived in Canada between 2000 and 2006 (2006 census).
| Region | % of total immigration |
|---|---|
| Atlantic provinces | 1.2% |
| Ontario | 53.7% |
| Prairies | 12.7% |
| British Columbia | 15.8% |
| Québec | 16.7% |
| Montréal Island | 69.9% |
| Rest of Québec | 30.1% |
Table 4
Distribution of immigrants arrived between 2000 and 2006 according to mother tongue (2006 census).
| Canada outside Québec | Québec | |
|---|---|---|
| English | 16.4% | 4.8% |
| French | 1.0% | 19.8% |
| Others-English | 82.6% | 24.3% |
| Others-French | N/A | 51.1% |
Table 5
Summary of all scenarios.
| Scenario | Immigration volume | Linguistic composition of immigration | Language shift |
|---|---|---|---|
| Base | 250.000 | Recent | Recent |
| Imm+ | 300.000 | Recent | Recent |
| Imm- | 200.000 | Recent | Recent |
| ImmFr | 250.000 | 50% less Anglophones and Others- Eng in Qc Recent trend in the rest of Canada | Recent |
| ImmEn | 250.000 | 50% more Anglophones and Others- Eng in Qc Recent trend in the rest of Canada | Recent |
| ShiftFr | 250.000 | Recent | All Allophones in Qc shift like Others-Fr Recent trends in the rest of Canada |
| ShiftEn | 250.000 | Recent | All Allophones in Qc shift like Others-Eng Recent trends in the rest of Canada |
| CanadaFr | 250.000 | Recent trend in Qc Number of Francophone immigrants doubled in the rest ofCanada | Recent |
| Shift- | 250.000 | Recent | Language shift intensity is reduced by 20% |
Download links
A two-part list of links to download the article, or parts of the article, in various formats.