Distributional effects of the forthcoming finnish pension reform – a dynamic microsimulation approach
- Finnish Centre for Pensions, Finland
Cite this article
as: H. Tikanmäki, H. Sihvonen, J. Salonen; 2015; Distributional effects of the forthcoming finnish pension reform – a dynamic microsimulation approach; International Journal of Microsimulation; 8(3); 75-98.
doi: 10.34196/ijm.00122
- Article
- Figures and data
- Jump to
Figures
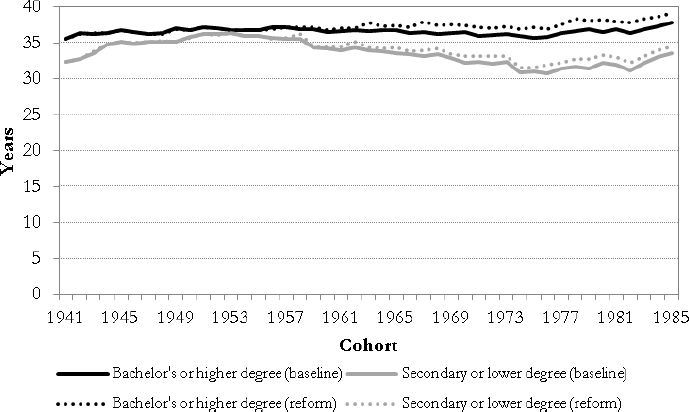
Figure 1

Average working life by education, median length in years.
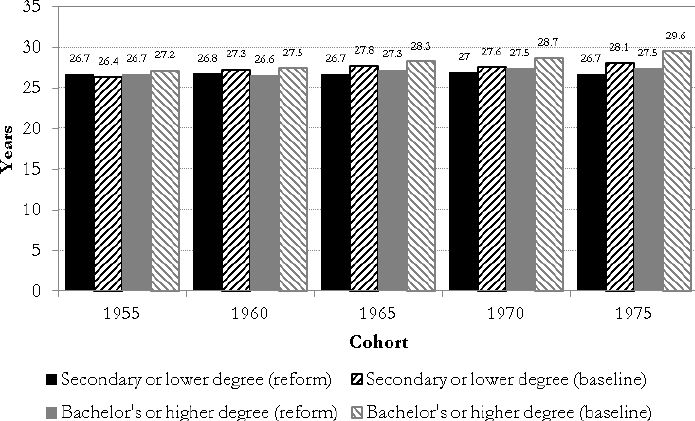
Figure 2

Average time spent in retirement, by education and in years.
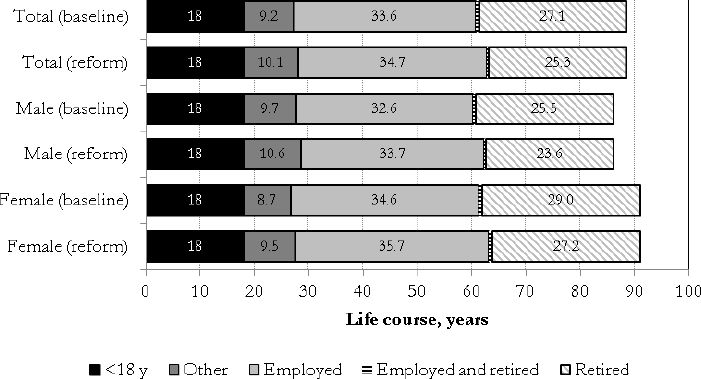
Figure 3

Partition of the life course of the 1988 birth cohort, years on average.
Figure 4

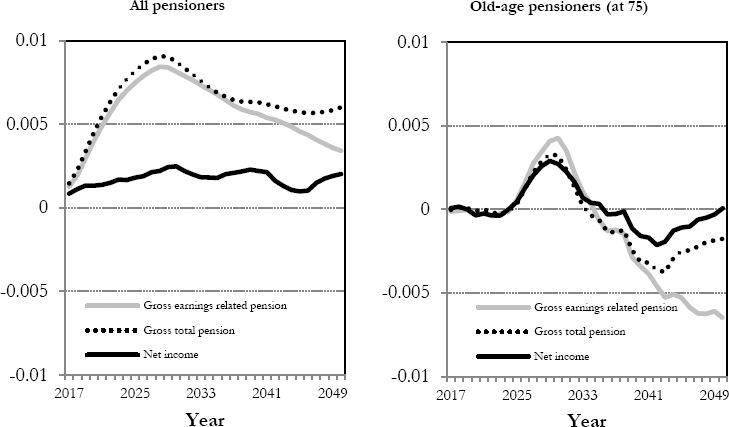
Relative changes of the percentage points of the pension levels of 75-year-olds, by birth cohort and gender.
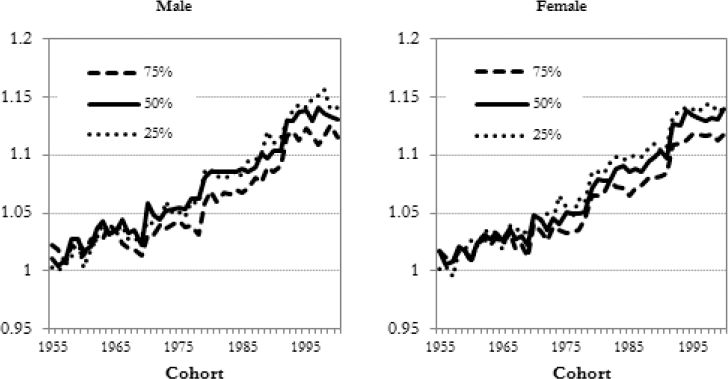
Figure 5

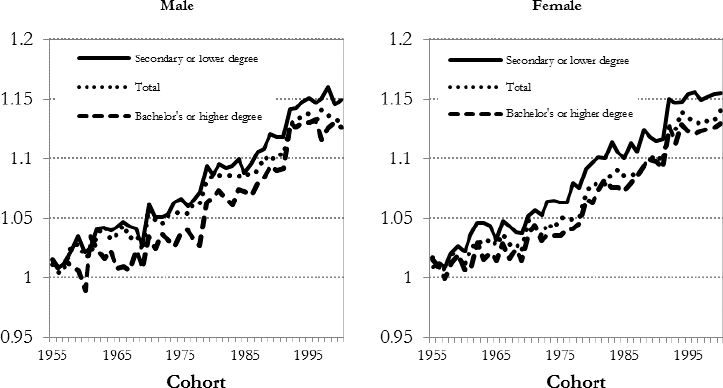
Relative changes of the medians of the earnings-related pensions of 75-year-olds, by gender and educational level.
Figure 6

Replacement rates of the statutory pensions 2017–2060 of people moving directly from work to old-age-pension, in per cent.
Figure 7

Change in Gini coefficient in 2017–2050.
Figure A.1

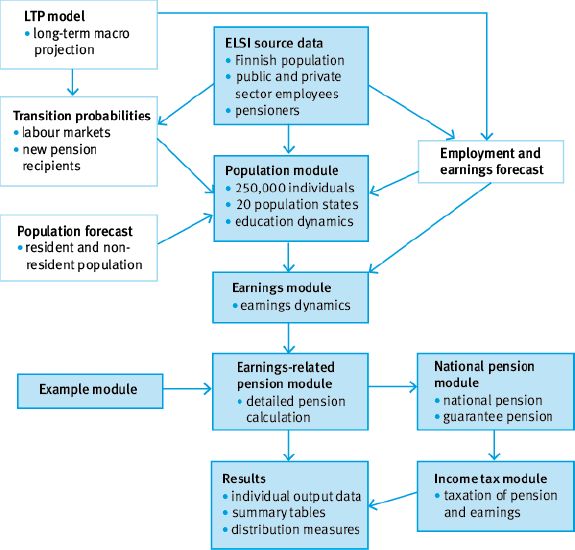
Structure of the ELSI model. Each dark box represents a module of the model. Each white box represents an external source of information.
Tables
Table 1
Average length of expected working life in some European countries, years4.
| Country | Male | Female | Total |
|---|---|---|---|
| EU 28 | 37.7 | 32.5 | 35.2 |
| Denmark | 40.3 | 37.6 | 39.0 |
| Finland | 37.8 | 36.6 | 37.2 |
| Sweden | 42.1 | 39.6 | 40.9 |
| Iceland | 47.2 | 43.8 | 45.5 |
| Norway | 40.6 | 38.3 | 39.5 |
-
Source: Eurostat
Table 2
Difference in working life of 75-year-olds by gender Difference of reform to baseline in years.
| Gender/Cohort | P25% | P50% | P75% | Mean |
|---|---|---|---|---|
| Male 1960 | −0.1 | 0.2 | 0.3 | 0.1 |
| Male 1970 | 0.5 | 0.8 | 1.7 | 0.9 |
| Male 1980 | 1.0 | 0.9 | 1.2 | 1.2 |
| Male 1990 | 1.0 | 1.0 | 1.0 | 1.2 |
| Male 2000 | 1.0 | 2.0 | 2.0 | 1.4 |
| Female 1960 | 0.3 | 0.4 | 0.7 | 0.5 |
| Female 1970 | 0.9 | 0.9 | 1.1 | 1.0 |
| Female 1980 | 1.1 | 1.4 | 1.8 | 1.5 |
| Female 1990 | 1.0 | 1.0 | 2.0 | 1.6 |
| Female 2000 | 1.0 | 1.0 | 2.0 | 1.5 |
Table A.3
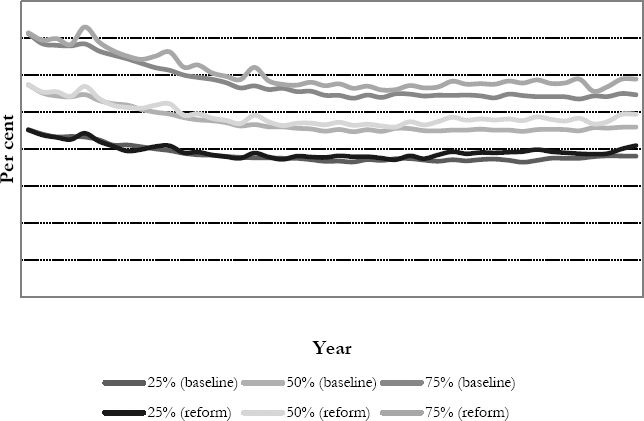
Earnings related pension by education, median EUR/month at 2014 prices*.
| Cohort | Male | Female | ||||
|---|---|---|---|---|---|---|
| 25% (baseline) | 50% (baseline) | 75% (baseline) | 25% (baseline) | 50% (baseline) | 75% (baseline) | |
| 1960 | 1,240 | 1,790 | 2,470 | 1,050 | 1,500 | 1,960 |
| 1970 | 1,440 | 1,960 | 2,650 | 1,220 | 1,640 | 2,140 |
| 1980 | 1,640 | 2,180 | 2,900 | 1,470 | 1,950 | 2,610 |
| 1990 | 1,930 | 2,510 | 3,350 | 1,700 | 2,210 | 2,880 |
| 2000 | 2,350 | 3,010 | 3,960 | 2,050 | 2,610 | 3,400 |
| 25% (reform) | 50% (reform) | 75% (reform) | 25% (reform) | 50% (reform) | 75% (reform) | |
| 1960 | 1,250 | 1,820 | 2,500 | 1,080 | 1,520 | 1,970 |
| 1970 | 1,490 | 2,070 | 2,740 | 1,270 | 1,720 | 2,230 |
| 1980 | 1,780 | 2,370 | 3,110 | 1,590 | 2,110 | 2,780 |
| 1990 | 2,150 | 2,770 | 3,640 | 1,880 | 2,430 | 3,110 |
| 2000 | 2,680 | 3,410 | 4,420 | 2,330 | 2,980 | 3,800 |
| Low (baseline) | High (baseline) | Total (baseline) | Low (baseline) | High (baseline) | Total (baseline) | |
| 1960 | 1,550 | 2,610 | 1,790 | 1,230 | 1,890 | 1,500 |
| 1970 | 1,670 | 2,780 | 1,960 | 1,270 | 2,000 | 1,640 |
| 1980 | 1,960 | 3,170 | 2,180 | 1,550 | 2,500 | 1,950 |
| 1990 | 2,250 | 3,670 | 2,510 | 1,820 | 2,720 | 2,210 |
| 2000 | 2,740 | 4,340 | 3,010 | 2,190 | 3,250 | 2,610 |
| Low (reform) | High (reform) | Total (reform) | Low (reform) | High (reform) | Total (reform) | |
| 1960 | 1,590 | 2,590 | 1,820 | 1,250 | 1,900 | 1,520 |
| 1970 | 1,780 | 2,870 | 2,070 | 1,340 | 2,080 | 1,720 |
| 1980 | 2,130 | 3,390 | 2,370 | 1,700 | 2,660 | 2,110 |
| 1990 | 2,520 | 4,002 | 2,770 | 2,030 | 2,980 | 2,430 |
| 2000 | 3,150 | 4,880 | 3,410 | 2,530 | 3,680 | 2,980 |
-
*
Low=Secondary or lower degree, High=Bachelor’s or higher degree.
Download links
A two-part list of links to download the article, or parts of the article, in various formats.