Accounting for tax evasion profiles and tax expenditures in microsimulation modelling. The Betamod model for personal income taxes in Italy
- Ca’ Foscari University, Italy
- Article
- Figures and data
- Jump to
Figures

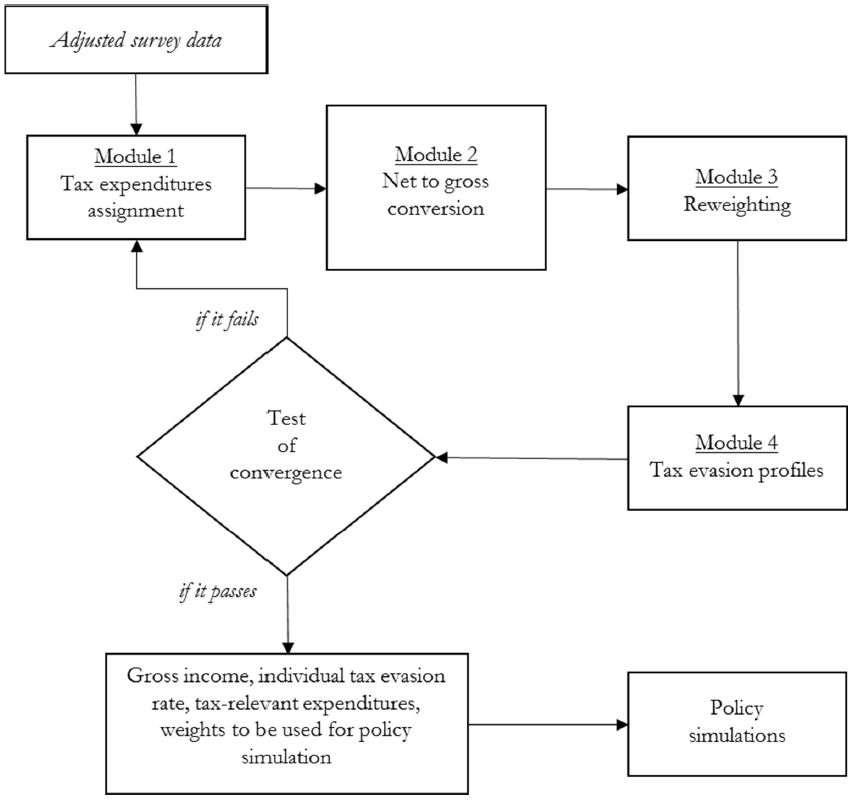
The construction of Betamod.
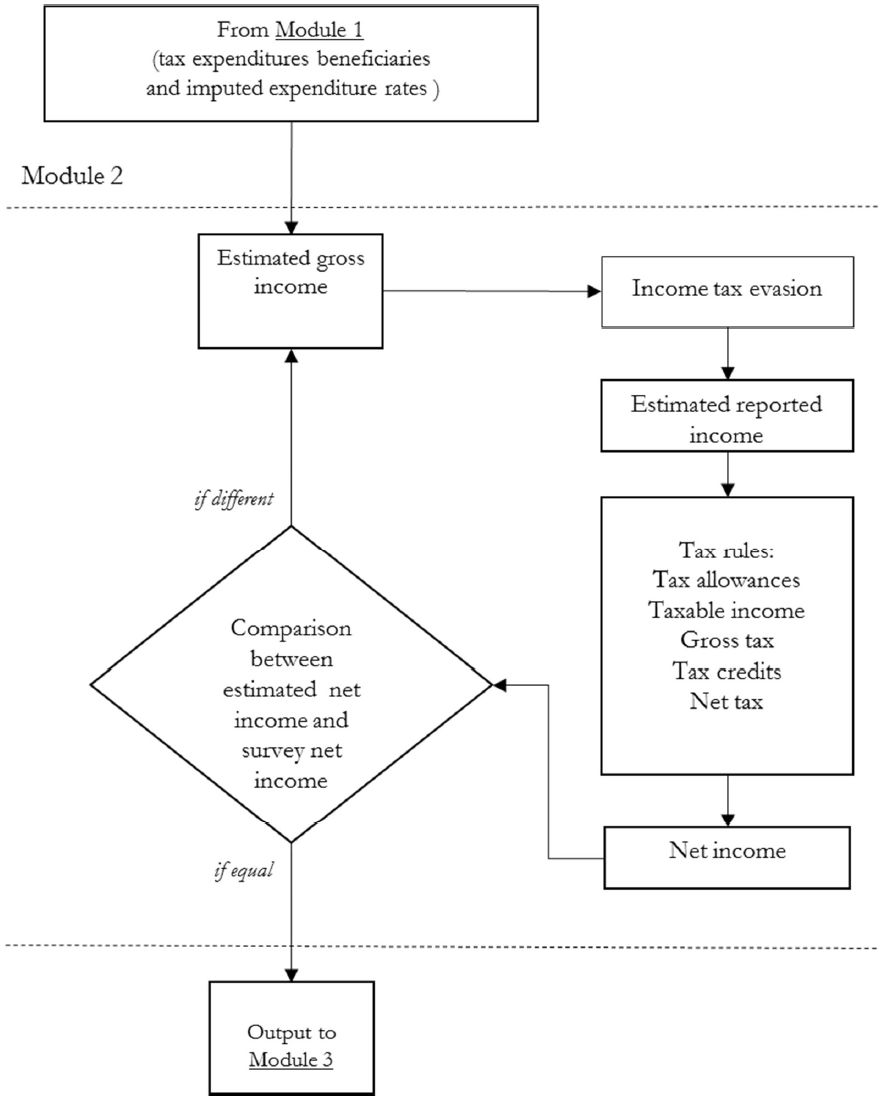
Net-to-gross conversion (Module 2).

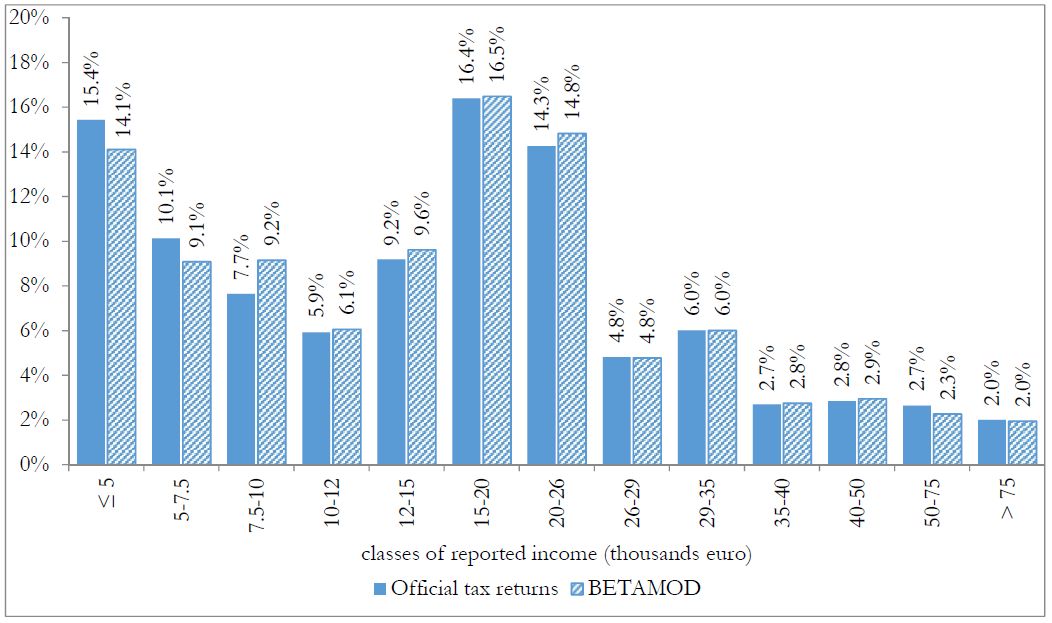
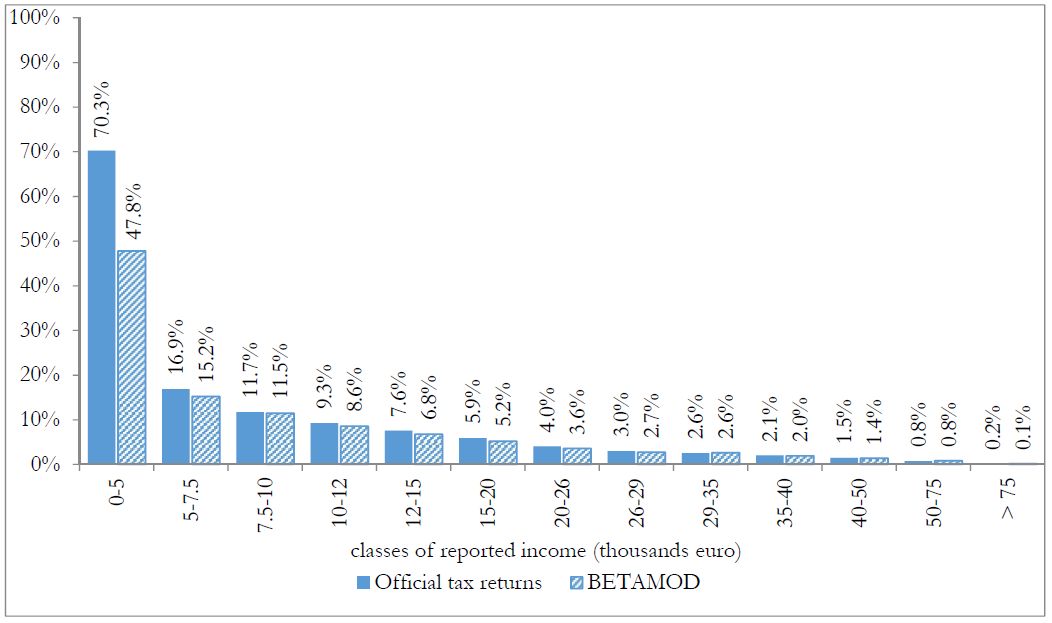
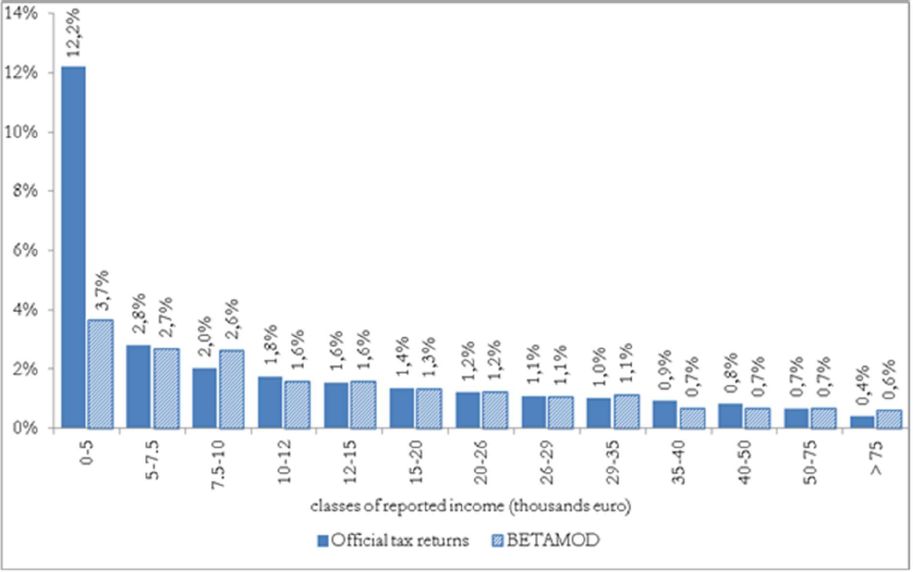
Distribution of taxpayers by classes of reported income.

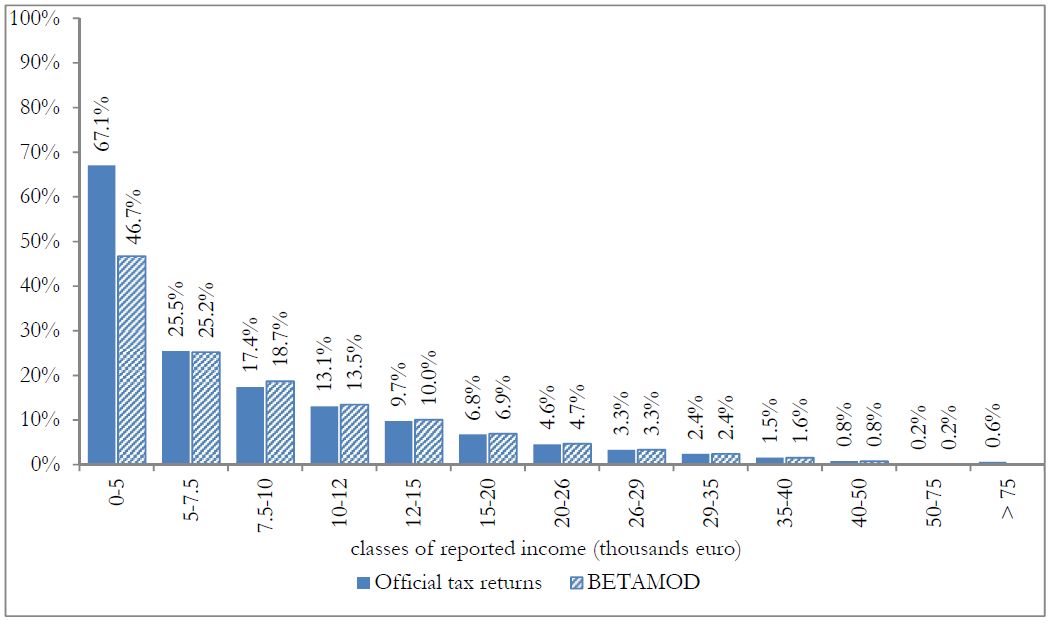
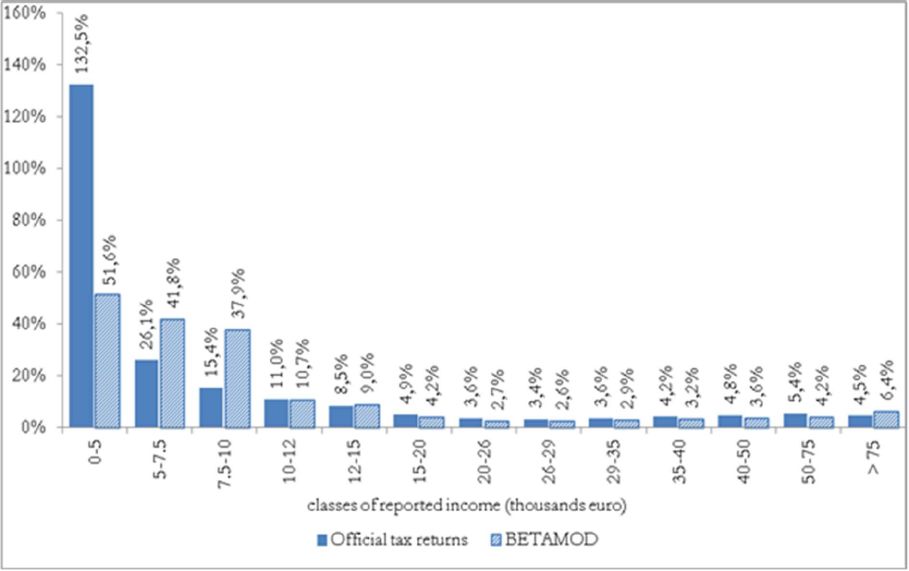
Distribution of reported income by classes of reported income.

Income source tax credit as a proportion of reported income (%).
Tax credit for dependent family members as a proportion of reported income.

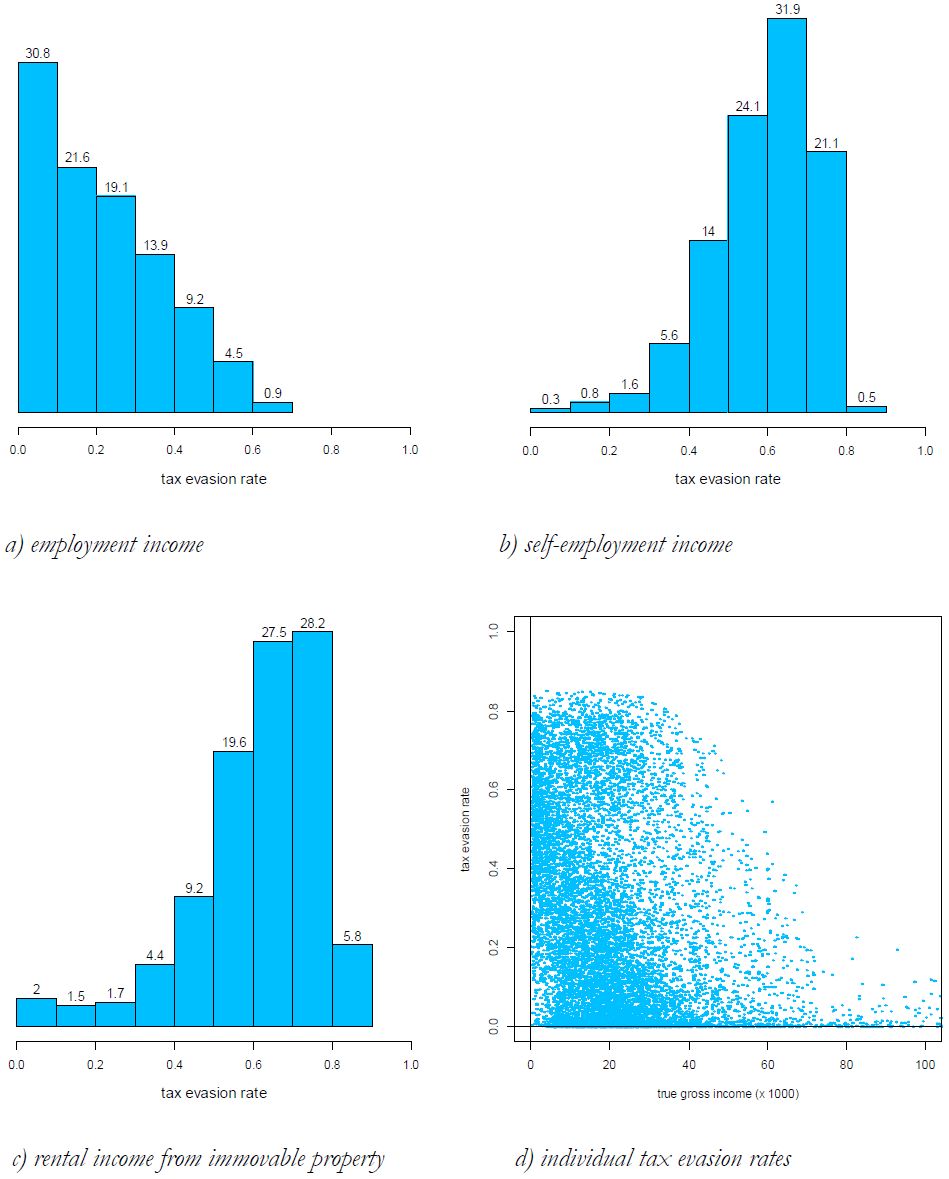
Distribution of tax evasion rates by type of income (tax evaders only, in percentage).

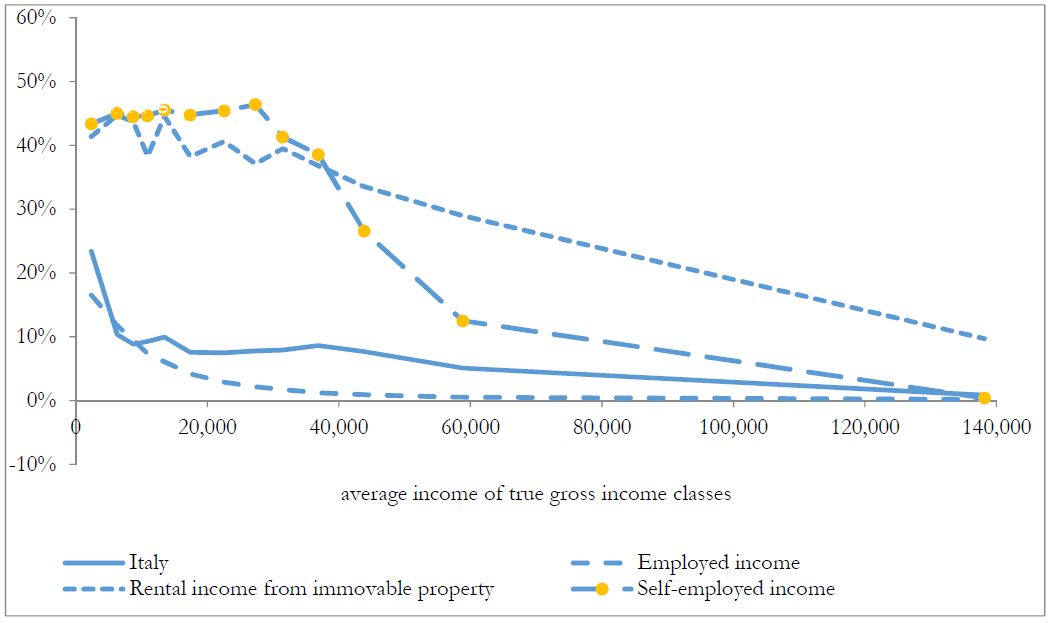
Average tax evasion rates by type of income and by true gross income classes.

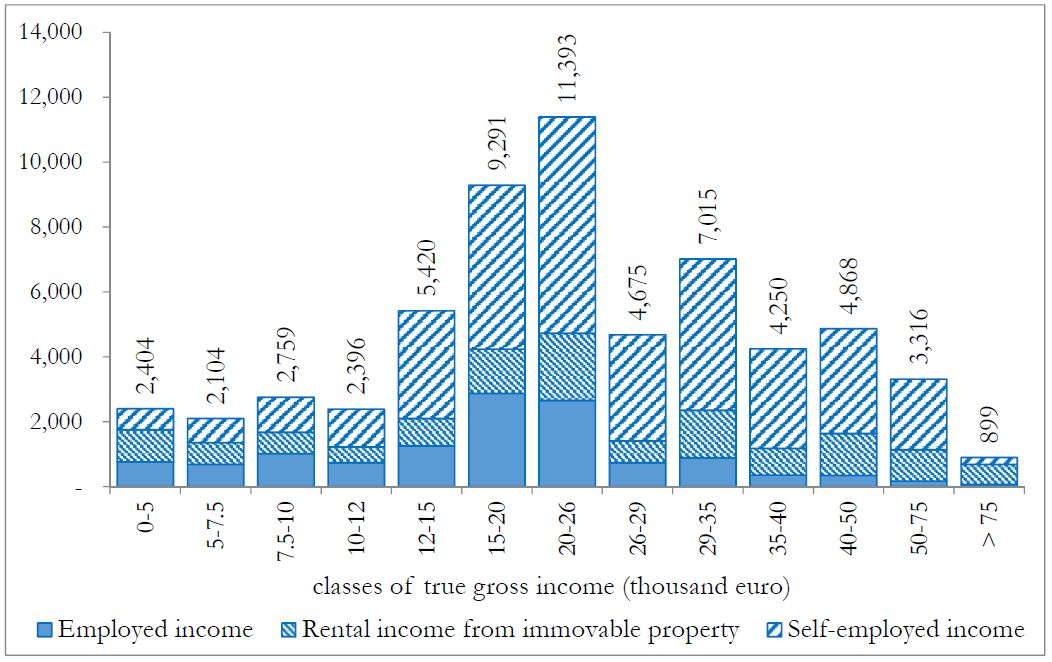
Unreported income by classes of true gross income (millions of euros).
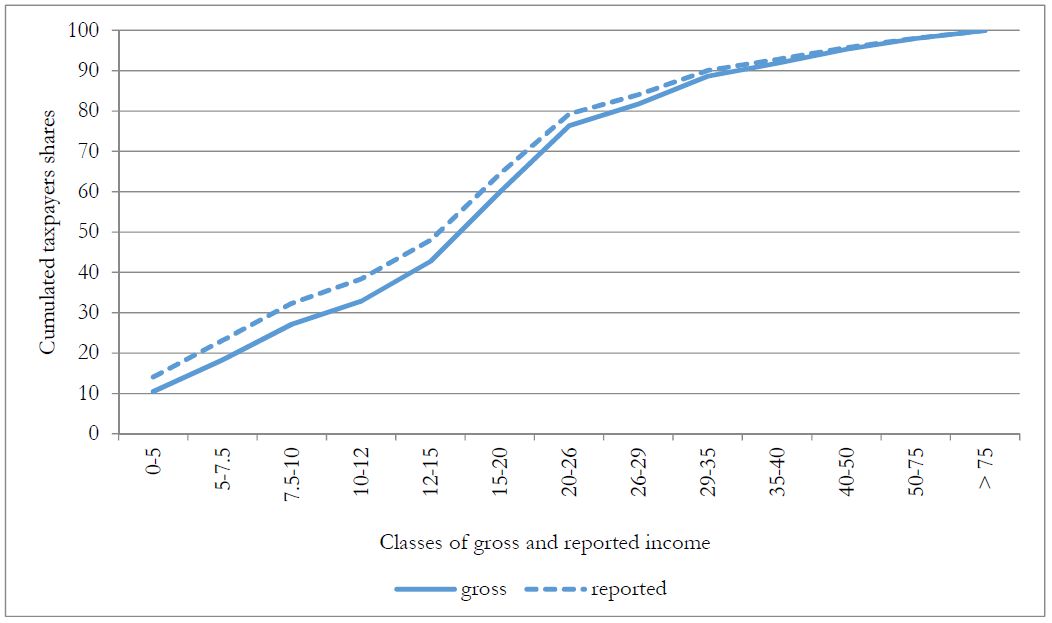
Cumulative distributions of taxpayers by (true) gross and reported income classes (thousands of euros).

Total tax deductions as a proportion of reported income (%).

The 19% tax credits as a proportion of reported income (%).

Social insurance contributions paid by self-employed individuals as a proportion of reported income (%).
The 19% tax credit for healthcare expenses as a proportion of reported income (%).
Tables
The largest PIT deductions and tax credits (fiscal year 2010).
| Description | (Value millions of Euros) | Number of beneficiaries (thousands of persons) | percent of Gdp |
|---|---|---|---|
| Deductions | |||
| Social insurance contributions paid by selfemployed individuals | 17,603 | 11,991 | 1.13 |
| Cadastral value of the main residence | 8,283 | 17,166 | 0.53 |
| Voluntary contributions to private pension plans | 1,905 | 822 | 0.12 |
| Tax credits | |||
| Tax credit for specific income sources | 41,887 | 36,426 | 2.70 |
| Tax credit for dependent family members | 11,375 | 12,624 | 0.73 |
| Tax credit for healthcare expenditures | 2,585 | 15,002 | 0.17 |
-
Source: Ministry of Economy and Finance, http://www1.finanze.gov.it/analisi_stat/index.php?tree=2011
Deductions: identification of potential beneficiaries.
| Deductions | Potentially beneficiaries | Data source |
|---|---|---|
| Social insurance contributions paid by self-employed individuals | having self-employed income | It-Silc |
| Cadastral value of the main residence | be the owner’s of main residence | It-Silc |
| Voluntary contributions to private pension plans | those who reported to pay contributions to private pension plans | It-Silc |
| Legal alimony payments for spouse | those who reported to pay alimony | It-Silc |
| Personal care services and disability aids | identified by the estimated probability of healthcare spending | Multiscopo |
| Social insurance contributions paid for domestic help | i) presence of children
ii) having health care expenses |
It-Silc |
| Donations to religious institutions | (*) | It-Silc |
| Others | (*) | It-Silc |
-
Note: (*) Due to lack of information in the data, beneficiaries are mainly identified among the taxpayers with the higher probability of receiving other tax advantage; this is motivated by anecdotal evidence that the probability of claiming specific tax reliefs increases in the number of other tax reliefs claimed. In order to increase variance some beneficiaries have been randomly chosen
Tax credits: identification of potential beneficiaries.
| Deductions | Potentially beneficiaries | Data source |
|---|---|---|
| 19% tax credits | ||
| Healthcare expenses | identified by the estimated probability of healthcare spending | Multiscopo |
| Mortgage interest payments on main residence | i) be the homeowner’s of main residence
ii) have a mortgage loans for the purchase of the main residence |
It-Silc |
| Life insurance premium | he/she have life insurance expenses | Shiw |
| Secondary and tertiary education | i) he/she is studying
ii) have children attending high school or university |
It-Silc |
| Funeral expenses | (*) | It-Silc |
| Mortgage interest payments on other properties | i) be the homeowner’s of main residence and other properties | It-Silc |
| Annual enrollment to sports facilities | i) he/she is doing sport
ii) have children between 6 and 18 |
It-Silc |
| Rent for resident students | have children attending university and not living within the same residence as the referent individual | It-Silc |
| Social/community/home care expenses | identified by the estimated probability of healthcare spending | Multiscopo |
| Charitable donations | (*) | |
| Real estate brokerage expenses | i) be the homeowner’s of main residence
ii) have a mortgage loans for the purchase of the main residence or others properties |
It-Silc |
| Others | (*) | |
| 55% tax credits | ||
| For energy conservation’s interventions | i) be the homeowner’s of main residence
ii) have expenses for energy conservation’s interventions |
It-Silc Shiw |
| 41%-36% tax credits | ||
| House refurbishments | i) be the homeowner’s of main residence
ii) have expenses for the refurbishment of buildings |
It-Silc |
| 20% tax credits | (*) | |
| Lump sum tax credit | ||
| For tenants subject to controlled rent and for employees relocating closer to work | i) be for rent
ii) have gross income less than € 30,987.41 iii) having age between 20 and 30 years old and gross income less than € 15,493.71 |
It-Silc |
| Security sector tax credit | i) be employee
ii) have employment reported income less than € 35,000 |
It-Silc |
| Others | (*) |
-
Note: (*)Due to lack of information in the data, beneficiaries are mainly identified among the taxpayers with the higher probability of receiving other tax advantage; this is motivated by anecdotal evidence that the probability of claiming specific tax reliefs increases in the number of other tax reliefs claimed. In order to increase variance some beneficiaries have been randomly chosen.
Components of gross income: Betamod and It-Silc.
| Individuals | Households | |||||||
|---|---|---|---|---|---|---|---|---|
| Number of individualsa | Average gross incomeb | Number of householdsa | Average gross incomeb | |||||
| BETAMOD | IT-SILC | BETAMOD | IT-SILC | BETAMOD | IT-SILC | BETAMOD | IT-SILC | |
| Employment income | 21,179 | 21,382 | 20,229 | 20,110 | 15,133 | 14,887 | 29,237 | 28,884 |
| Pensions | 15,181 | 15,130 | 15,271 | 16,505 | 12,257 | 11,696 | 19,031 | 21,351 |
| Self-employment income | 6,728 | 6,882 | 21,876 | 22,095 | 5,955 | 5,762 | 26,098 | 26,384 |
-
Notes
-
a
thousands of persons
-
b
millions of euros
The grossing-up results.
| Variable | It-Silc weight | Official tax returns | Betamod weight | Difference |
|---|---|---|---|---|
| Total Population | 60,683,909 | - | 60,683,909 | 0 |
| Males | 29,499,829 | - | 29,499,827 | −2 |
| Females | 31,184,080 | - | 31,184,081 | 1 |
| North West | 16,131,196 | - | 16,131,196 | 0 |
| North East | 11,647,123 | - | 11,647,123 | 0 |
| Center | 11,943,354 | - | 11,943,354 | 0 |
| South | 20,962,237 | - | 20,962,237 | 0 |
| Age 0 – 14 | 8,841,850 | - | 8,841,850 | 0 |
| Age 15 – 24 | 6,041,469 | - | 6,041,468 | −1 |
| Age 25 – 44 | 17,172,717 | - | 17,172,717 | 0 |
| Age 45 – 64 | 16,394,019 | - | 16,394,019 | 0 |
| Age over 65 | 12,233,854 | - | 12,233,855 | 1 |
| Total households | 25,217,462 | - | 25,217,462 | 0 |
| North West | 7,186,593 | - | 7,186,593 | 0 |
| North East | 4,993,636 | - | 4,993,636 | 0 |
| Center | 5,007,637 | - | 5,007,637 | 0 |
| South | 8,029,596 | - | 8,029,596 | 0 |
| Total Taxpayers | - | 41,168,189 | 41,168,317 | 128 |
| Males | - | 21,622,165 | 21,622,249 | 84 |
| Females | - | 19,546,024 | 19,546,068 | 44 |
| North West | - | 11,653,491 | 11,653,533 | 42 |
| North East | - | 8,710,500 | 8,710,532 | 32 |
| Center | - | 8,317,613 | 8,317,638 | 25 |
| South | - | 12,486,585 | 12,486,613 | 28 |
| Reported income classes | ||||
| 1st quintile | - | 8,359,593 | 8,357,026 | −2,567 |
| 2nd quintile | - | 7,753,926 | 7,754,008 | 82 |
| 3rd quintile | - | 10,526,834 | 10,527,087 | 253 |
| 4th quintile | - | 7,851,917 | 7,852,371 | 454 |
| 5th quintile | - | 6,675,919 | 6,677,825 | 1,906 |
| Taxpayers by main income | ||||
| Employment income | - | 20,228,316 | 20,228,944 | 628 |
| Pensions | - | 14,165,864 | 14,166,862 | 998 |
| Self-employment income | - | 4,708,272 | 4,706,768 | −1,504 |
| Rental income from immovable property | - | 2,065,737 | 2,065,744 | 7 |
| Number of taxpayers with dependent family members | - | 12,624,414 | 12,624,454 | 40 |
Aggregate validation: main components of personal income tax and local taxes.
| Number of taxpayersa | Valueb | |||||
|---|---|---|---|---|---|---|
| Totals | Betamod | Official tax returns | Diff. % | Betamod | Value ² Official tax returns | Diff. % |
| Gross income | 41,168 | - | - | 853,891 | - | - |
| Evaded income | 14,778 | - | - | 60,789 | - | - |
| Reported income | 41,168 | 41,168 | 0.0 | 793,102 | 792,520 | 0.1 |
| Deductions | 13,794 | 13,374 | 3.1 | 21,736 | 21,746 | 0.0 |
| Taxable income | 41,097 | 39,894 | 3.0 | 763,086 | 762,185 | 0.1 |
| Gross tax liability | 41,097 | 39,078 | 5.2 | 205,213 | 205,613 | −0.2 |
| Tax credits | 39,977 | 39,088 | 2.3 | 64,604 | 62,482 | 3.4 |
| Net tax liability | 31,178 | 30,897 | 0.9 | 147,904 | 149,443 | −1.0 |
| Regional income tax | 31,035 | 30,653 | 1.2 | 8,655 | 8,633 | 0.3 |
| Municipal income tax | 25,251 | 25,265 | −0.1 | 3,023 | 3,021 | 0.1 |
-
Notes
-
a
thousands of persons
-
b
millions of euros
Aggregate validation: deductions.
| Number of taxpayersa | Valueb | |||||
|---|---|---|---|---|---|---|
| Deductions | Betamod | Official tax returns | Diff. % | Betamod | Value ² Official tax returns | Diff. % |
| Social insurance contributions paid by self-employed individuals | 11,922 | 11,991 | −0.6 | 17,601 | 17,603 | 0.0 |
| Cadastral value of the main residence | 16,873 | 17,166 | −1.7 | 8,279 | 8,283 | 0.0 |
| Voluntary contributions to private pension plans | 803 | 822 | −2.3 | 1,897 | 1,905 | −0.4 |
| Legal alimony payments for spouse | 109 | 120 | −9.5 | 742 | 745 | −0.4 |
| Personal care services and disability aids | 147 | 143 | 2.8 | 537 | 531 | 1.2 |
| Social insurance contributions paid for domestic help | 522 | 537 | −2.8 | 415 | 419 | −0.9 |
| Donations to religious institutions | 95 | 104 | −8.7 | 27 | 27 | −1.8 |
| Others | 1,800 | 1,816 | −0.9 | 517 | 516 | 0.1 |
-
Notes
-
a
thousands of persons
-
b
millions of euros
Aggregate validation: tax credits.
| Number of taxpayersa | Valueb | |||||
|---|---|---|---|---|---|---|
| Deductions | Betamod | Official tax returns | Diff. % | Betamod | Value ² Official tax returns | Diff. % |
| Income source tax credit | 37,852 | 36,426 | 3.9 | 44,475 | 41,887 | 6.2 |
| Dependent family members tax credit | 12,624 | 12,624 | 0.0 | 10,914 | 11,375 | −4.0 |
| 19% tax credits | ||||||
| Healthcare expenses | 14,855 | 15,002 | −1.0 | 2,588 | 2,585 | 0.1 |
| Mortgage interest payments on main residence | 3,817 | 3,841 | −0.6 | 1,146 | 1,147 | 0.0 |
| Life insurance premium 6,437 | 6,520 | −1.3 | 750 | 751 | −0.1 | |
| Secondary and tertiary education | 2,102 | 2,095 | 0.3 | 318 | 318 | 0.0 |
| Funeral expenses | 413 | 428 | −3.6 | 119 | 119 | −0.4 |
| Mortgage interest payments on other properties | 281 | 296 | −5.1 | 80 | 77 | 3.2 |
| Annual enrollment to sports facilities | 1,506 | 1,522 | −1.1 | 60 | 60 | 0.1 |
| Rent for resident students | 159 | 169 | −6.2 | 51 | 50 | 1.0 |
| Social/community/home care expenses | 113 | 108 | 4.0 | 38 | 38 | 0.6 |
| Charitable donations | 899 | 915 | −1.8 | 36 | 36 | 0.3 |
| Real estate brokerage expenses | 95 | 100 | −4.1 | 16 | 15 | 1.5 |
| Others | 1,080 | 1,101 | −1.9 | 83 | 83 | −0.1 |
| 55% tax credits | ||||||
| For energy conservation's interventions | 1,038 | 1,052 | −1.4 | 1,351 | 1,349 | 0.1 |
| 41%-36% tax credits | ||||||
| House refurbishments | 5,175 | 5,267 | −1.8 | 2,242 | 2,243 | 0.0 |
| 20% tax credit | 539 | 540 | −0.1 | 65 | 65 | −0.1 |
| Others tax credits | ||||||
| For tenants subject to controlled rent and for employees relocating closer to work | 708 | 713 | −0.7 | 138 | 136 | 1.5 |
| Security sector tax credit | 375 | 349 | 7.5 | 50 | 50 | 0.0 |
| Others | 158 | 137 | 15.3 | 84 | 83 | 1.6 |
-
Notes
-
a
thousands of persons
-
b
millions of euros
Gross and net tax distribution by classes of reported income (mean values in euros).
| Classes of reported income | Gross tax liability | Net tax liability | ||
|---|---|---|---|---|
| Betamod | Official tax returns | Betamod | Official tax returns | |
| under 5,000 | 442 | 453 | 281 | 229 |
| 5,000 – 7,500 | 1,317 | 1,394 | 613 | 460 |
| 7,500 – 10,000 | 1,851 | 1,938 | 415 | 492 |
| 10,000 – 12,000 | 2,437 | 2,417 | 826 | 867 |
| 12,000 – 15,000 | 2,998 | 2,993 | 1,384 | 1,426 |
| 15,000 – 20,000 | 4,005 | 3,988 | 2,373 | 2,336 |
| 20,000 – 26,000 | 5,363 | 5,359 | 3,745 | 3,673 |
| 26,000 – 29,000 | 6,612 | 6,584 | 5,026 | 4,952 |
| 29,000 – 35,000 | 7,979 | 7,966 | 6,403 | 6,401 |
| 35,000 – 40,000 | 10,077 | 9,962 | 8,763 | 8,513 |
| 40,000 – 50,000 | 12,634 | 12,439 | 11,452 | 11,169 |
| 50,000 – 75,000 | 18,111 | 18,244 | 17,134 | 17,228 |
| above 75,000 | 45,707 | 46,799 | 44,166 | 45,551 |
| Average | 4,993 | 5,262 | 4,744 | 4,837 |
Inequality and redistributive indices.
| Individuals | Equivalent households | |||
|---|---|---|---|---|
| Gini | Concentration | Gini | Concentration | |
| Gross income | 0.4155 | 0.4155 | 0.3885 | 0.3885 |
| Reported income | 0.4417 | 0.4264 | 0.4060 | 0.3954 |
| Taxable income | 0.4478 | 0.4262 | 0.4102 | 0.3950 |
| Gross tax liability | 0.5107 | 0.4909 | 0.4702 | 0.4552 |
| Net tax liability | 0.6784 | 0.6508 | 0.6315 | 0.6104 |
| Net income | 0.3678 | 0.3662 | 0.3428 | 0.3415 |
| Reynolds-Smolensky index | 0.0493 | 0.0469 | ||
| Kakwani index | 0.2353 | 0.2220 | ||
| Average tax rate | 0.1732 | 0.1745 | ||
| Reranking effect | 0.0015 | 0.0013 | ||
Kakwani indices of Personal Income Tax components.
| Equivalent households | ||||||
|---|---|---|---|---|---|---|
| Average rate of tax components | Weight of the decomposition | Kakwani index | ||||
| Evasion | ev | 0.0686 | ev/(1-ev-e-d) | 0.0765 | πkEV | 0.0945 |
| Exemptions | e | 0.0104 | e/(1-ev-e-d) | 0.0116 | πkE | 0.0389 |
| Deductions | d | 0.0245 | d/(1-ev-e-d) | 0.0273 | πkD | −0.0393 |
| Tax rate schedule | πkR | 0.0602 | ||||
| Gross tax liability | tg | 0.2408 | tg/tn | 1.3797 | πkTg | 0.0668 |
| Tax credits | k | 0.0663 | k/tn | 0.3797 | πkK | 0.3419 |
| Tax credits for income source | kis | 0.0486 | kis/tn | 0.2782 | πkKis | 0.3989 |
| Tax credits for dependent family members | kdf | 0.0077 | kdf/tn | 0.0444 | πkKdf | 0.5329 |
| k19 | 0.0056 | k19/tn | 0.0323 | πkK19 | −0.0196 | |
| 19% tax credits | ko | 0.0043 | ko/tn | 0.0249 | πkKo | −0.1684 |
| Other tax credits | tn | 0.1745 | tn/(1-tn) | 0.2115 | πkTn | 0.2220 |
| Net tax liability | ev | 0.0686 | ev/(1-ev-e-d) | 0.0765 | πkEV | 0.0945 |
Average tax evasion rates by income source and geographical area (%).
| Average tax evasion rate | NW | NE | C | S | ITALY |
|---|---|---|---|---|---|
| Employment income | 2.7 | 3.1 | 2.8 | 3.3 | 2.9 |
| Pensions | 0.0 | 0.0 | 0.0 | 0.0 | 0.0 |
| Self-employment income | 22.2 | 25.1 | 22.3 | 27.2 | 24.0 |
| Rental income from immovable property | 30.6 | 35.5 | 31.3 | 38.2 | 33.6 |
| Total income | 6.9 | 7.5 | 6.8 | 7.7 | 7.2 |
Transition matrix of taxpayers from (true) gross income to reported income (%).
| Classes of true gross income (thousands of euros) | |||||||||||||||
| 0–5 | 5–7.5 | 7.5–10 | 10–12 | 12–15 | 15–20 | 20–26 | 26–29 | 29–35 | 35–40 | 45–50 | 50–75 | >75 | Total | ||
| Classes of reported income (thousands of euros) | 0–5 | 10.47 | 1.51 | 0.79 | 0.33 | 0.57 | 0.33 | 0.11 | 0.01 | 14.11 | |||||
| 5–7.5 | 6.37 | 0.91 | 0.43 | 0.42 | 0.52 | 0.32 | 0.07 | 0.04 | 9.08 | ||||||
| 7.5–10 | 7.13 | 0.60 | 0.49 | 0.34 | 0.39 | 0.11 | 0.08 | 0.02 | 9.15 | ||||||
| 10–12 | 4.38 | 0.71 | 0.50 | 0.25 | 0.06 | 0.11 | 0.04 | 0.01 | 6.06 | ||||||
| 12–15 | 7.66 | 1.25 | 0.31 | 0.08 | 0.17 | 0.09 | 0.04 | 9.61 | |||||||
| 15–20 | 14.26 | 1.64 | 0.24 | 0.19 | 0.09 | 0.05 | 16.50 | ||||||||
| 20–26 | 13.43 | 0.72 | 0.43 | 0.12 | 0.11 | 0.01 | 14.82 | ||||||||
| 26–29 | 4.06 | 0.51 | 0.12 | 0.08 | 0.01 | 4.78 | |||||||||
| 29–35 | 5.34 | 0.37 | 0.23 | 0.06 | 6.01 | ||||||||||
| 35–40 | 2.38 | 0.31 | 0.05 | 2.75 | |||||||||||
| 40–50 | 2.64 | 0.30 | 2.94 | ||||||||||||
| 50–75 | 2.25 | 0.02 | 2.26 | ||||||||||||
| > 75 | 1.95 | 1.95 | |||||||||||||
| Total | 10.47 | 7.88 | 8.83 | 5.74 | 9.85 | 17.21 | 16.45 | 5.36 | 6.86 | 3.23 | 3.48 | 2.67 | 1.96 | 100 | |
Balancing test.
| Property | Region | ||||||||||
|---|---|---|---|---|---|---|---|---|---|---|---|
| 1st | 2nd | N-W | N-E | C | S | Sample | Psuedo R2 | LR test | p-values | Median bias | % reduction in median bias |
| ✓ | ✓ | ✓ | Before matching After matching |
0.013 0.000 |
99.72 0.38 |
0.000 0.996 |
6.4 0.2 |
0.969 | |||
| ✓ | ✓ | Before matching After matching |
0.012 0.000 |
42.77 1.23 |
0.000 0.942 |
5.0 0.1 |
0.980 | ||||
| ✓ | ✓ | Before matching After matching |
0.019 0.000 |
102.27 1.30 |
0.000 0.935 |
5.8 0.4 |
0.931 | ||||
| ✓ | ✓ | ✓ | Before matching After matching |
0.007 0.000 |
11.84 0.07 |
0.037 1.000 |
6.7 0.3 |
0.955 | |||
| ✓ | ✓ | ✓ | Before matching After matching |
0.001 0.001 |
2.50 2.27 |
0.776 0.810 |
4.2 0.3 |
0.929 | |||
| ✓ | ✓ | ✓ | Before matching After matching |
0.007 0.000 |
14.36 0.20 |
0.013 0.999 |
6.0 0.4 |
0.933 | |||
| ✓ | ✓ | ✓ | Before matching After matching |
0.004 0.000 |
9.31 0.63 |
0.097 0.987 |
7.0 0.2 |
0.971 | |||
| ✓ | ✓ | ✓ | ✓ | ✓ | Before matching After matching |
0.004 0.001 |
4.14 1.46 |
0.529 0.917 |
4.6 0.8 |
0.824 | |
| ✓ | ✓ | Before matching After matching |
0.042 0.000 |
136.58 1.95 |
0.000 0.857 |
6.1 0.1 |
0.984 | ||||
| ✓ | ✓ | Before matching After matching |
0.029 0.000 |
122.41 0.51 |
0.000 0.992 |
10.0 0.2 |
0.980 | ||||