Assessing the impacts of a major tax reform: A CGE-microsimulation analysis for Uruguay
- Centro de Investigaciones Económicas (CINVE), Montevideo-Uruguay
Cite this article
as: C. Llambi, S. Laens, M. Perera; 2016; Assessing the impacts of a major tax reform: A CGE-microsimulation analysis for Uruguay; International Journal of Microsimulation; 9(1); 134-166.
doi: 10.34196/ijm.00131
- Article
- Figures and data
- Jump to
Figures
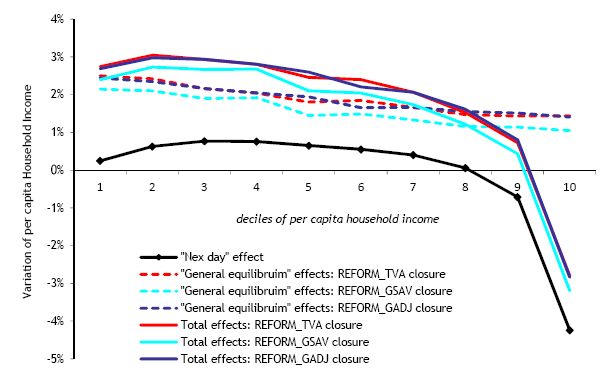
Figure 1

After-tax per capita household income by decile and type of microsimulation. Full reform (variation w.r.t base).
Tables
Table 1
Direct tax on labor and pension income: pre- and post-reform.
| Post-reform direct personal tax on labor and pension income | Pre –Reform tax on wages and pensions | ||||
|---|---|---|---|---|---|
| Monthly income* | Tax rate | Income | Monthly income* | Tax rate | Income |
| Up to 5 BPC | Exempt | Wages, Pensions | Up to 3 BPC | Exempt | Wages |
| Between 5 and 10 BPC | 10% | and non-wage | Between 3 and 6 BPC | 2% | |
| Between 10 and 15 BPC | 15% | remunerations | Above 6 BPC | 6% | |
| Between 15 and 50 BPC | 20% | Up to 6 BPC | Exempt | Pensions | |
| Between 50 and 100 BPC | 22% | Above 6 BPC | 2% | ||
| Above 100 BPC | 25% | ||||
-
Source: Authors’ elaboration based on data from the Ministry of Economics and Finance.
Table 2
Bases and rates of personal income tax on capital: post-reform.
| Concept | Tax rate | Income |
|---|---|---|
| Interest on deposits over one year in financial institution | 3% | |
| Interest on deposits, under a year in financial institutions | 5% | |
| Interest on bonds and other debt securities, longer than three year maturity | 3% | Pure revenues from capital |
| Distributed profits | 7% | |
| Other capital revenues | 12% |
-
Source: Authors’ elaboration based on data from the Ministry of Economics and Finance.
Table 3
Employer contribution to social security and value added tax rates: pre- and post-reform.
| Sectors | Employer contribution to social security | Value added tax | ||
|---|---|---|---|---|
| Pre reform | Reform | Pre reform | Reform | |
| Primary except livestock | ----- | ----- | 9.8% | 15.4% |
| Livestock | ----- | ----- | 0.0% | 0.0% |
| Meat, fruit & veg. | 5.0% | 12.5% | 23.0% | 22.0% |
| Mills, sugar & vegetable oils | 5.0% | 12.5% | 14.0% | 10.0% |
| Dairy | 5.0% | 12.5% | 8.6% | 12.4% |
| Other food industry | 5.0% | 12.5% | 21.5% | 20.0% |
| Press | 5.0% | 12.5% | 0.0% | 0.0% |
| Petroleum refining | 6.5% | 7.5% | 5.9% | 4.2% |
| Pharmaceutical industry | 5.0% | 12.5% | 14.0% | 10.0% |
| Metal products and machinery | 5.0% | 12.5% | 22.3% | 21.4% |
| Other manufacturing | 5.0% | 12.5% | 23.0% | 22.0% |
| Electricity and gas | 6.5% | 7.5% | 22.0% | |
| Water | 24.5% | 7.5% | 0.0% | 0.0% |
| Construction | 32.6% | 23.3% | 0.0% | 0.0% |
| Commerce | 17.5% | 12.5% | 16.0% | 15.8% |
| Hotels | 17.5% | 12.5% | 14.0% | 10.0% |
| Passenger transport | 0.0% | 0.0% | 14.0% | 10.0% |
| Communications | 24.5% | 7.5% | 23.0% | 22.0% |
| Financial services | 17.5% | 12.5% | 0.0% | 0.0% |
| Public administration | 19.5% | 19.5% | 0.0% | 0.0% |
| Private education | 0.0% | 0.0% | 0.0% | 0.0% |
| Hospitals | 17.5% | 12.5% | 0.0% | 10.0% |
| Other health services | 17.5% | 12.5% | 0.0% | 22.0% |
| Other services | 17.5% | 12.5% | 23.0% | 22.0% |
-
Source: Authors’ elaboration based on data from the Social Security Bank and the Ministry of Economics and Finance.
Table 4
Share of value added by sector.
| Sectors | Skilled labour | Semiskilled labour | Unskilled labour | Capital |
|---|---|---|---|---|
| Primary except livestock | 1.0% | 1.5% | 4.4% | 1.1% |
| Livestock | 3.4% | 3.6% | 9.2% | 7.5% |
| Meat, fruit & veg. | 0.5% | 1.2% | 2.5% | 2.4% |
| Mills, sugar & vegetable oils | 0.1% | 0.3% | 0.5% | 0.3% |
| Dairy | 0.2% | 0.7% | 0.8% | 0.9% |
| Other food industry | 0.6% | 1.0% | 2.6% | 2.2% |
| Press | 0.8% | 1.0% | 0.7% | 0.4% |
| Petroleum refining | 0.7% | 0.7% | 0.2% | 8.4% |
| Pharmaceutical industry | 1.5% | 1.2% | 0.5% | 0.1% |
| Metal products and machinery | 0.9% | 1.7% | 2.0% | 2.1% |
| Other manufacturing | 2.5% | 4.4% | 6.2% | 6.0% |
| Electricity and gas | 1.8% | 1.5% | 1.0% | 3.6% |
| Water | 0.4% | 0.4% | 1.1% | 0.2% |
| Construction | 1.5% | 2.1% | 7.8% | 7.1% |
| Commerce | 6.5% | 18.5% | 18.3% | 8.9% |
| Hotels | 0.4% | 0.6% | 0.7% | 2.3% |
| Passenger transport | 0.3% | 2.2% | 3.5% | 0.5% |
| Communications | 1.7% | 2.0% | 1.2% | 3.7% |
| Financial services | 6.4% | 8.7% | 2.3% | 11.9% |
| Public administration | 26.7% | 18.8% | 13.8% | 0.0% |
| Private education | 4.2% | 3.2% | 0.6% | 1.1% |
| Hospitals | 11.1% | 4.5% | 2.3% | 1.8% |
| Other health services | 5.0% | 1.5% | 0.7% | 0.5% |
| Other services | 21.9% | 18.7% | 17.2% | 27.0% |
| Total | 100% | 100% | 100% | 100% |
-
Source: SAM 2006.
Table 5
Taxes included in the CGE model (%).
| Taxes | % Tax revenue | % GDP |
|---|---|---|
| Labor income tax (1) | 4.1% | 1.0% |
| Capital income tax | 0.0% | 0.0% |
| Pensions tax | 0.4% | 0.1% |
| Employer contribution to social security | 14.9% | 3.7% |
| Worker contribution to social security | 9.0% | 2.3% |
| Direct tax on firms | 11.5% | 2.6% |
| Sales taxes | 10.8% | 2.5% |
| Tariffs | 4.3% | 1.1% |
| Activity Taxes | 2.9% | 0.7% |
| Value added tax | 39.2% | 10.0% |
| Tax on intermediate consumption of goods | 2.8% | 0.7% |
| Total | 100% | 24.7% |
-
Source: SAM 2006.
-
(1)
Includes taxes on the three types of labour
Table 6
Simulation results.
| Units | Base scenario | Simulations with flexible gov. savings | Simulations with flexible real gov. consumption | Simulations with budget neutral assumption | ||||||||||||
|---|---|---|---|---|---|---|---|---|---|---|---|---|---|---|---|---|
| REFORM_ gsav | VAT_ gsav | INCTAX_ gsav | ECSS_ gsav | FDIRTAX_ gsav | REFORM_ gcons | VAT_ gcons | INCTAX_ gcons | ECSS_ gcons | FDIRTAX_ gcons | REFORM_ vat | INCTAX_ vat | ECSS_ vat | FDIRTAX_ vat | |||
| Gov. financing | ||||||||||||||||
| Gov. Income | %GDP | 25,0 | 25,6 | 23,9 | 27,9 | 24,3 | 24,5 | 25,6 | 23,9 | 27,8 | 24,3 | 24,5 | 25,2 | 25,1 | 25,0 | 25,0 |
| Gov.consumption | %GDP | 11,4 | 11,4 | 11,4 | 11,4 | 11,4 | 11,4 | 11,9 | 10,3 | 14,1 | 10,7 | 10,9 | 11,5 | 11,5 | 11,4 | 11,4 |
| Gov.savings | %GDP | 1,6 | 2,1 | 0,4 | 4,5 | 0,8 | 1,0 | 1,6 | 1,6 | 1,6 | 1,6 | 1,6 | 1,6 | 1,6 | 1,6 | 1,6 |
| Direct taxes | % tot. rev* | 22,3 | 33,4 | 24,2 | 32,5 | 22,4 | 20,1 | 33,4 | 24,1 | 32,7 | 22,4 | 20,1 | 34,5 | 39,2 | 21,3 | 19,4 |
| Indirect taxes | % tot. rev* | 77,7 | 66,6 | 75,8 | 67,5 | 77,6 | 79,9 | 66,6 | 75,9 | 67,3 | 77,6 | 79,9 | 65,5 | 60,8 | 78,7 | 80,6 |
| Macro aggregates | ||||||||||||||||
| Absorption | % change | -- | 0,9 | 0,3 | 0,1 | 0,5 | 0,0 | 1,1 | 0,0 | 0,9 | 0,3 | -0,2 | 1,1 | 1,0 | 0,3 | -0,2 |
| Priv.consumption | % change | -- | 0,3 | 1,7 | -3,4 | 1,6 | 0,5 | 0,6 | 1,2 | -2,0 | 1,2 | 0,3 | 1,1 | 0,9 | 0,5 | -0,3 |
| Investment | % change | -- | 4,5 | -5,6 | 16,2 | -4,1 | -2,5 | 1,2 | 1,4 | -1,3 | 0,3 | 0,6 | 1,8 | 2,0 | -0,4 | 0,1 |
| Gov.consumption | % change | -- | 0,0 | 0,0 | 0,0 | 0,0 | 0,0 | 4,1 | -9,5 | 22,4 | -5,9 | -4,2 | 0,0 | 0,0 | 0,0 | 0,0 |
| Exports | % change | -- | 1,8 | -0,3 | 2,7 | -0,3 | -0,4 | 1,1 | 1,1 | -0,8 | 0,6 | 0,2 | 1,5 | 1,6 | 0,0 | -0,2 |
| Imports | % change | -- | 1,8 | -0,3 | 2,8 | -0,3 | -0,4 | 1,2 | 1,2 | -0,9 | 0,6 | 0,2 | 1,6 | 1,6 | 0,0 | -0,2 |
| GDP mp | % change | -- | 0,9 | 0,3 | 0,1 | 0,5 | 0,0 | 1,1 | 0,0 | 0,9 | 0,3 | -0,2 | 1,1 | 1,0 | 0,3 | -0,2 |
| Net indirect taxes | % change | -- | 1,1 | 0,4 | 0,2 | 0,5 | 0,0 | 0,9 | 0,9 | -0,9 | 0,8 | 0,2 | 1,1 | 1,3 | 0,2 | -0,2 |
| GDPfc | % change | -- | 0,9 | 0,3 | 0,1 | 0,5 | 0,0 | 1,1 | -0,2 | 1,2 | 0,2 | -0,3 | 1,3 | 0,9 | 0,3 | -0,2 |
| HH disp. income | % change | -- | 0,1 | 1,7 | -3,6 | 1,6 | 0,5 | 0,3 | 1,2 | -2,2 | 1,2 | 0,3 | 0,9 | 0,8 | 0,4 | -0,3 |
| Employment | ||||||||||||||||
| Skilled | % change | -- | 1,7 | 0,9 | -0,5 | 1,2 | 0,1 | 2,5 | -1,3 | 3,9 | -0,1 | -0,9 | 2,1 | 1,8 | 0,7 | -0,4 |
| Semiskilled | % change | -- | 1,6 | 0,7 | -0,1 | 1,0 | 0,0 | 1,9 | -0,1 | 1,9 | 0,5 | -0,4 | 1,9 | 1,7 | 0,5 | -0,3 |
| Unskilled | % change | -- | 2,0 | 0,6 | 0,6 | 0,9 | -0,1 | 2,0 | 0,5 | 0,7 | 0,9 | -0,1 | 2,2 | 2,0 | 0,6 | -0,4 |
| Total | % change | -- | 1,9 | 0,7 | 0,3 | 1,0 | 0,0 | 2,0 | 0,2 | 1,3 | 0,7 | -0,3 | 2,1 | 1,9 | 0,6 | -0,4 |
| Unemployment | ||||||||||||||||
| Skilled | % lab. force | 4,4 | 2,9 | 3,4 | 5,4 | 3,1 | 4,3 | 2,2 | 5,4 | 1,3 | 4,3 | 5,2 | 2,5 | 2,8 | 3,8 | 4,7 |
| Semiskilled | % lab. force | 10,1 | 8,7 | 9,4 | 10,4 | 9,2 | 10,0 | 8,4 | 10,1 | 8,6 | 9,6 | 10,4 | 8,4 | 8,6 | 9,6 | 10,4 |
| Unskilled | % lab. force | 12,0 | 10,2 | 11,4 | 11,6 | 11,1 | 12,0 | 10,2 | 11,5 | 11,4 | 11,2 | 12,1 | 9,9 | 10,1 | 11,5 | 12,3 |
| Participation rate | ||||||||||||||||
| Skilled | % pop.age | 81,6 | 81,8 | 81,5 | 82,0 | 81,6 | 81,6 | 81,8 | 81,4 | 82,2 | 81,5 | 81,5 | 81,7 | 81,7 | 81,6 | 81,6 |
| Semiskilled | % pop.age | 74,8 | 74,9 | 74,8 | 75,1 | 74,8 | 74,8 | 74,9 | 74,8 | 75,1 | 74,8 | 74,8 | 74,8 | 74,8 | 74,8 | 74,9 |
| Unskilled | % pop.age | 58,2 | 58,1 | 58,1 | 58,2 | 58,1 | 58,2 | 58,1 | 58,2 | 58,2 | 58,2 | 58,2 | 58,1 | 58,1 | 58,2 | 58,2 |
| Factor payments | ||||||||||||||||
| Skilled | % change | -- | 1,4 | 0,9 | -0,7 | 1,2 | 0,1 | 2,4 | -0,7 | 4,2 | 0,1 | -0,5 | 1,9 | 1,6 | 0,5 | -0,2 |
| Semiskilled | % change | -- | 2,1 | 1,1 | -0,4 | 1,4 | 0,1 | 2,6 | 0,0 | 2,2 | 0,7 | -0,4 | 2,6 | 2,3 | 0,7 | -0,4 |
| Unskilled | % change | -- | 2,4 | 0,7 | 0,5 | 1,1 | -0,1 | 2,4 | 0,6 | 0,8 | 1,0 | -0,1 | 2,8 | 2,5 | 0,6 | -0,4 |
| Capital | % change | -- | 3,2 | 2,1 | 0,3 | 1,0 | -0,1 | 2,8 | 2,9 | -1,9 | 1,5 | 0,3 | 4,3 | 6,2 | -0,5 | -1,1 |
-
*
Total revenue excluding social security contributions and tariffs
Table 7
Household disposable income (% change).
| Decile of HH income | REFORM_ vat | INCTAX_ vat | ECSS_ vat | FDIRTAX_ vat |
|---|---|---|---|---|
| 1 | 3.9 | 3.8 | 0.6 | -0.5 |
| 2 | 4.7 | 4.6 | 0.7 | -0.5 |
| 3 | 4.9 | 4.8 | 0.6 | -0.5 |
| 4 | 4.6 | 4.5 | 0.6 | -0.5 |
| 5 | 4.6 | 4.5 | 0.6 | -0.4 |
| 6 | 4.2 | 4.1 | 0.5 | -0.4 |
| 7 | 3.6 | 3.6 | 0.4 | -0.3 |
| 8 | 2.5 | 2.4 | 0.3 | -0.3 |
| 9 | 1.2 | 1.2 | 0.2 | -0.2 |
| 10 | -2.8 | -2.7 | 0.0 | -0.1 |
-
Source: author’s CGE simulation results.
Table 8
Labor demand by aggregated sector of activity (percentage change with respect to base (%)).
| Simulations with flexible government consumption | Simulations with flexible government savings | Simulations with budget neutral assumption | |||||||||||||
|---|---|---|---|---|---|---|---|---|---|---|---|---|---|---|---|
| REFORM_gsav | INCTAX_gsav | ECSS_gsav | TVA_gsav | FDIRTAX_gsav | REFORM_gcons | INCTAX_gcons | ECSS_gcons | TVA_gcons | FDIRTAX_gcons | REFORM_tva | INCTAX_tva | ECSS_tva | FDIRTAX_tva | ||
| Primary sectors | 3.1 | 2.1 | 1.4 | -0.3 | -0.3 | 2.4 | -1.4 | 2.4 | 1.1 | 0.3 | 3.3 | 3.3 | 1.2 | -0.5 | |
| Manufacturing | 1.6 | 4.6 | -3.2 | 0.9 | -0.7 | 0.5 | -1.5 | -1.7 | 3.4 | 0.4 | 1.2 | 2.5 | -2.6 | -0.3 | |
| Construction | 5.9 | 12.4 | -1.4 | -3.8 | -1.9 | 3.1 | -2.2 | 2.4 | 2.1 | 0.7 | 4.1 | 3.2 | 1.1 | -0.3 | |
| Pub. administration % pub. services | 0.1 | -0.2 | 0.1 | 0.1 | 0.0 | 4.0 | 21.2 | -5.5 | -8.9 | -4.0 | 0.1 | 0.1 | 0.0 | 0.0 | |
| Commerce | 2.1 | -1.6 | 2.3 | 1.2 | 0.3 | 2.0 | -2.1 | 2.5 | 1.4 | 0.3 | 2.8 | 1.9 | 1.4 | -0.4 | |
| Private education and health | 1.9 | -2.8 | 2.0 | 2.4 | 0.5 | 2.1 | -1.6 | 1.7 | 1.9 | 0.3 | 2.6 | 1.2 | 0.9 | -0.3 | |
| Other services | 1.4 | -2.6 | 2.5 | 1.3 | 0.4 | 1.4 | -2.4 | 2.4 | 1.2 | 0.3 | 2.2 | 2.0 | 1.3 | -0.5 | |
| Total | 1.9 | 0.3 | 1.0 | 0.7 | 0.0 | 2.0 | 1.3 | 0.7 | 0.2 | -0.3 | 2.1 | 1.9 | 0.6 | -0.4 | |
-
Source: author’s CGE model results.
Table 9
Microsimulation results of the full reform under different macroeconomic closures of the model on the government: effects on income, poverty and inequality.
| Mean of PCHI | Mean of LI | Extreme | Moderate Poverty: FGT(a) indicators | Inequality | ||||
|---|---|---|---|---|---|---|---|---|
| (after direct taxes) | (after direct taxes) | Poverty (incidence) | Incidence: FGT(0) | Poverty Gap Ratio: FGT(1) | Severity of Poverty: FGT(2) | Gini of PCHI | GINI of LI | |
| Base Indicators | 6.425 | 8.148 | 2,29 | 27,88 | 9,34 | 4,31 | 0,453 | 0,498 |
| Arithmetical Microsimulation (a) | -1,2% | -1,5% | -0,01 | -0,33 | -0,10 | -0,04 | -0,009 | -0,013 |
| Simulations with flexible government savings | ||||||||
| Labor Market Changes (Gen. Equilib. Effects) (b) | 1,5% | 1,8% | -0,16 | -0,65 | -0,32 | -0,18 | -0,001 | 0,001 |
| + Participation Rate Change | 0,0% | 0,0% | 0,00 | 0,00 | 0,00 | 0,00 | 0,000 | 0,000 |
| + Unemployment Rate Change | 0,4% | 0,0% | -0,10 | -0,29 | -0,14 | -0,09 | -0,001 | 0,002 |
| + Employment Structure Change | 0,0% | -0,1% | 0,01 | 0,03 | 0,01 | 0,01 | 0,000 | 0,000 |
| + Wage Structure Change | 0,0% | 0,0% | 0,00 | -0,04 | -0,02 | -0,01 | 0,000 | -0,001 |
| + Wage Rate Change | 0,9% | 1,8% | -0,07 | -0,35 | -0,17 | -0,09 | 0,000 | -0,001 |
| + Capital Price Change | 0,1% | 0,0% | 0,00 | 0,00 | 0,00 | 0,00 | 0,000 | 0,000 |
| Total Microsimulation Effects (c)=(a)+(b) | 0,3% | 0,3% | -0,16 | -0,98 | -0,43 | -0,22 | -0,010 | -0,012 |
| Final Counterfactual Indicators | 6.441 | 8.169 | 2,12 | 26,90 | 8,91 | 4,09 | 0,443 | 0,486 |
| Simulations with flexible government consumption | ||||||||
| Labor Market Changes (Gen. Equilib. Effects) (b) | 1,8% | 2,2% | -0,18 | -0,82 | -0,38 | -0,20 | -0,001 | 0,000 |
| + Participation Rate Change | 0,0% | 0,0% | 0,00 | 0,00 | 0,00 | 0,00 | 0,000 | 0,000 |
| + Unemployment Rate Change | 0,5% | 0,0% | -0,10 | -0,32 | -0,15 | -0,09 | -0,001 | 0,002 |
| + Employment Structure Change | 0,0% | 0,0% | 0,00 | -0,04 | -0,02 | -0,01 | 0,000 | -0,001 |
| + Wage Structure Change | 0,0% | 0,0% | 0,00 | 0,01 | 0,00 | 0,00 | 0,000 | 0,000 |
| + Wage Rate Change | 1,2% | 2,2% | -0,07 | -0,46 | -0,22 | -0,11 | 0,000 | -0,001 |
| + Capital Price Change | 0,1% | 0,0% | 0,00 | 0,00 | 0,00 | 0,00 | 0,000 | 0,000 |
| Total Microsimulation Effects (c)=(a)+(b) | 0,6% | 0,8% | -0,18 | -1,14 | -0,48 | -0,25 | -0,009 | -0,013 |
| Final Counterfactual Indicators | 6.463 | 8.208 | 2,11 | 26,73 | 8,85 | 4,06 | 0,443 | 0,485 |
| Simulations with budget neutral assumption | ||||||||
| Labor Market Changes (Gen. Equilib. Effects) (b) | 1,8% | 2,1% | -0,17 | -0,80 | -0,37 | -0,20 | -0,001 | 0,001 |
| + Participation Rate Change | 0,0% | 0,0% | 0,00 | 0,00 | 0,00 | 0,00 | 0,000 | 0,000 |
| + Unemployment Rate Change | 0,5% | 0,0% | -0,11 | -0,33 | -0,16 | -0,10 | -0,001 | 0,002 |
| + Employment Structure Change | 0,0% | -0,1% | 0,01 | 0,04 | 0,02 | 0,01 | 0,000 | 0,000 |
| + Wage Structure Change | 0,0% | 0,0% | 0,00 | -0,03 | -0,01 | -0,01 | 0,000 | -0,001 |
| + Wage Rate Change | 1,2% | 2,2% | -0,06 | -0,48 | -0,21 | -0,11 | 0,000 | -0,001 |
| + Capital Price Change | 0,1% | 0,0% | 0,00 | 0,00 | 0,00 | 0,00 | 0,000 | 0,000 |
| Total Microsimulation Effects (c)=(a)+(b) | 0,6% | 0,7% | -0,18 | -1,13 | -0,48 | -0,24 | -0,009 | -0,012 |
| Final Counterfactual Indicators | 6.461 | 8.201 | 2,11 | 26,75 | 8,86 | 4,06 | 0,443 | 0,486 |
Table 10
Counterfactual changes in mean per capita household income by decile, due to reforms, by different government closures.
| Decile of HH income | Base Scenario | Arithmetical Microsim | % Arith./Base | Simulations with flexible government savings | Simulations with flexible real government consumption | Simulations with budget neutral assumption | |||||||
|---|---|---|---|---|---|---|---|---|---|---|---|---|---|
| Cumulative Changes (Arith + GE effects) | % Cum./Arith. | Total Variation (%) | Cumulative Changes (Arith + GE effects) | % Cum./Arith. | Total Variation (%) | Cumulative Changes (Arith + GE effects) | % Cum./Arith. | Total Variation (%) | |||||
| 1 | 1.448 | 1.452 | 0,2% | 1.484 | 2,2% | 2,5% | 1.490 | 2,6% | 2,9% | 1.488 | 2,5% | 2,7% | |
| 2 | 2.386 | 2.401 | 0,6% | 2.453 | 2,1% | 2,8% | 2.458 | 2,4% | 3,0% | 2.458 | 2,4% | 3,0% | |
| 3 | 3.216 | 3.241 | 0,8% | 3.301 | 1,9% | 2,7% | 3.311 | 2,2% | 2,9% | 3.311 | 2,2% | 3,0% | |
| 4 | 4.064 | 4.095 | 0,8% | 4.167 | 1,7% | 2,5% | 4.179 | 2,0% | 2,8% | 4.178 | 2,0% | 2,8% | |
| 5 | 4.996 | 5.029 | 0,7% | 5.107 | 1,5% | 2,2% | 5.124 | 1,9% | 2,6% | 5.119 | 1,8% | 2,5% | |
| 6 | 6.091 | 6.125 | 0,6% | 6.210 | 1,4% | 1,9% | 6.231 | 1,7% | 2,3% | 6.228 | 1,7% | 2,2% | |
| 7 | 7.480 | 7.510 | 0,4% | 7.604 | 1,3% | 1,7% | 7.629 | 1,6% | 2,0% | 7.627 | 1,6% | 2,0% | |
| 8 | 9.455 | 9.460 | 0,1% | 9.578 | 1,3% | 1,3% | 9.607 | 1,5% | 1,6% | 9.604 | 1,5% | 1,6% | |
| 9 | 12.883 | 12.792 | -0,7% | 12.933 | 1,1% | 0,4% | 12.974 | 1,4% | 0,7% | 12.965 | 1,4% | 0,6% | |
| 10 | 26.441 | 25.320 | -4,2% | 25.589 | 1,1% | -3,2% | 25.667 | 1,4% | -2,9% | 25.647 | 1,3% | -3,0% | |
Download links
A two-part list of links to download the article, or parts of the article, in various formats.