NCDMod: A microsimulation model projecting chronic disease and risk factors for Australian adults
- University of Sydney, Australia
- Article
- Figures and data
- Jump to
Figures

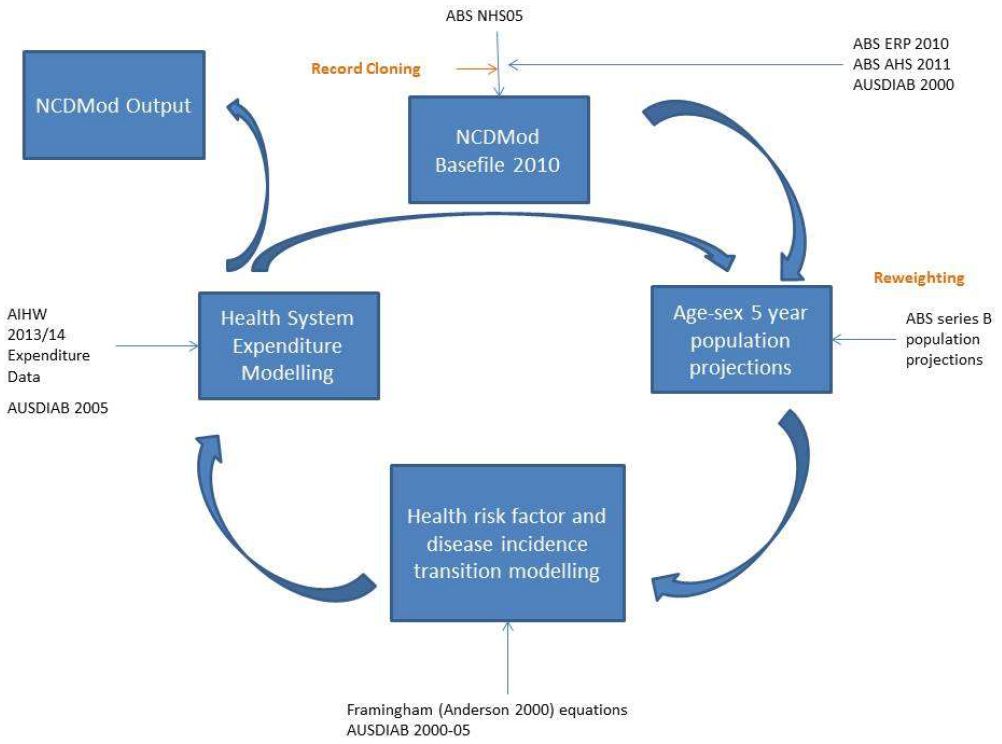
NCDMod – The model’s schematic.

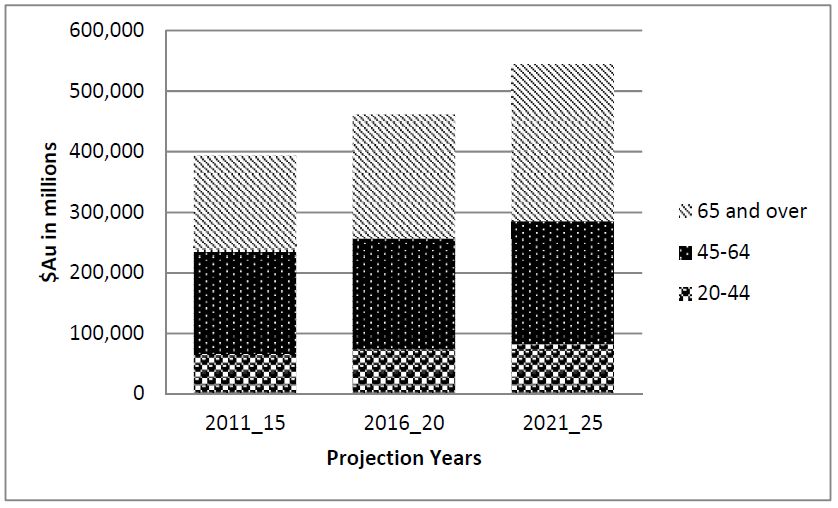
NCDMod projected total Australian health expenditure (in $AU millions 2010), by age group, 2011–2025.
Tables
Summary of NCDMod key variables.
| Model Module | Variable |
|---|---|
| NCDMod Basefile | |
| Demography | Age
Sex Ethnicity Family type Socio-economic status |
| Chronic Illness | Diabetes
Cardiovascular disease Peripheral vascular disease Arthritis Cancer Asthma Renal failure Depression Dementia |
| Risk Factors | BMI category
Reported high cholesterol Reported high blood pressure Reported high blood sugar Smoking status Alcohol consumption Physical activity level |
| Population Projection | |
| Demographics | Age
Sex |
| Health Risk Factor and Disease Transition Modelling | |
| Risk Factors | BMI
Total cholesterol Systolic blood pressure Smoking status |
| Chronic Illness | Diabetes incidence
Heart disease events Stroke events |
| Mortality | CVD deaths |
| Outcomes | |
| Health Outcomes | YLL (Years of life lost)
DALY |
| Expenditure | Intervention costs
Health System costs |
| Scenario Comparator | ICER (Incremental cost effectiveness ratio) |
NCDMod – Estimated Australian Population Baseline Demographic and Disease Characteristics, 20 years and over, 2010.
| 2010 Baseline Characteristics | Gender | ||
|---|---|---|---|
| Obese | |||
| Male (%) | Female (%) | Total (%) | |
| BMI < 30 kg/m2 | 72.0 | 73.6 | 72.8 |
| BMI ≥ 30 kg/m2 | 28.0 | 26.4 | 27.2 |
| Known T2DM | |||
| Known T2DM | 5.7 | 6.7 | 6.3 |
| Not | 94.3 | 93.3 | 93.7 |
| Ever had a heart attack | |||
| Yes | 3.3 | 1.4 | 2.3 |
| No | 96.7 | 98.6 | 97.7 |
| Ever had a stroke | |||
| Yes | 1.6 | 1.4 | 1.5 |
| No | 98.4 | 98.6 | 98.5 |
| Overall | 100.0 | 100.0 | 100.0 |
| Total Population (in thousands) | 8,194 | 8,764 | 16,958 |
-
Source: NCDMod version June 2016.
-
Notes: BMI = Body mass index; T2DM = Type 2 diabetes mellitus.
NCDMod – Estimated Australian Population Baseline Distributional Characteristics, 20 years and over, 2010.
| Baseline Distribution | Gender | ||
|---|---|---|---|
| Male | Female | Total Population | |
| Age 2010 (in years) | |||
| Mean | 46.5 | 48.7 | 47.6 |
| Median | 45.0 | 47.0 | 46.0 |
| Standard Deviation | 77.29 | 82.10 | 79.97 |
| BMI2010 (kg/m2) | |||
| Mean | 27.9 | 26.9 | 26.4 |
| Median | 27.1 | 25.4 | 26.4 |
| Standard Deviation | 25.91 | 29.02 | 27.65 |
| Systolic Blood Pressure 2010 (mmHg) | |||
| Mean | 130.0 | 127.4 | 128.7 |
| Median | 125.8 | 121.0 | 123.7 |
| Standard Deviation | 56.86 | 74.51 | 66.84 |
| Total Cholesterol 2010 (mmol/L) | |||
| Mean | 5.5 | 5.6 | 5.6 |
| Median | 5.4 | 5.5 | 5.4 |
| Standard Deviation | 2.66 | 2.53 | 2.60 |
-
Source: NCDMod version June 2016.
-
Notes: BMI = Body mass index.
Comparison of NCDMod Baseline Characteristics with AHS 2011 values.
| Population Characteristics | NCDMod | AHS | % Difference |
| % 65 years and over | 19.4 | 17.8 | 9.0 |
| % male | 48.3 | 49.4 | -2.2 |
| % type 2 diabetes (self-reported) | 6.3 | 5.8 | 8.6 |
| % obese (BMI ≥ 30 kg/m2) | 27.2 | 28.8 | -5.6 |
| Population Size | 16,957,458 | 16,393,424 | 3.4 |
-
Source: NCDMod version June 2016.
-
Notes: BMI = Body mass index; AHS = Australian Health Survey 2011.
NCDMod Estimated mean Values of Health Indicators 2010–2025.
| Outcome | 2010 | 2015 | 2020 | 2025 |
| BMI (kg/m2) | ||||
| Total | 27.4 | 28.1 | 28.7 | 29.4 |
| Female | 26.9 | 27.7 | 28.4 | 29.2 |
| Male | 27.9 | 28.5 | 29.0 | 29.7 |
| SBP (mmHg) | ||||
| Total | 128.7 | 130.3 | 130.9 | 131.9 |
| Female | 127.4 | 129.0 | 129.9 | 131.2 |
| Male | 130.0 | 131.6 | 132.0 | 132.7 |
| Total Cholesetrol (mmol/L) | ||||
| Total | 5.6 | 5.6 | 5.5 | 5.4 |
| Female | 5.6 | 5.6 | 5.5 | 5.5 |
| Male | 5.5 | 5.5 | 5.5 | 5.4 |
-
Source: NCDMod version June 2016.
-
Notes: BMI = Body mass index; SBP = systolic blood pressure.
NCDMod Projected Health Events and Rates, 2011–2025.
| Variable | 2011–2015 | 2016–2020 | 2021–2025 |
|---|---|---|---|
| New Known Type 2 Diabetes | 261,496 | 288,503 | 325,301 |
| CVD Events (excl. CVD deaths) | 461,566 | 600,715 | 697,050 |
| Years Lived in Disability | 1,380,228 | 1,826,728 | 2,085,673 |
| CVD Deaths | 258,948 | 378,091 | 445,225 |
| Years of Life Lost | 2,527,629 | 3,276,962 | 3,669,757 |
| New Known Type 2 Diabetes Rate (per 100,000 population) | 287.6 | 285.0 | 296.3 |
| CVD Events (excl. CVD deaths) Rate (per 100,000 population) | 507.6 | 593.4 | 635.0 |
| CVD Deaths Rate (per 100,000 population) | 284.8 | 373.5 | 405.6 |
-
Source: NCDMod version June 2016.
-
Notes: CVD = cardiovascular disease.
NCDMod 2015 Outputs Compared to ABS National Health Survey 2014/15.
| Population Characterstics | NCDMod 2015 | NHS 2014/15 | Absolute % point difference | %Difference |
|---|---|---|---|---|
| % Ever Smoke | 20.9 | 17.4 | 3.5 | 20.1 |
| % Obese (BMI ≥ 30 kg/m2) | 26.1 | 27.9 | 1.8 | -6.5 |
| % High Blood Pressure | 18.4 | 21.5 | 3.1 | -14.4 |
| % High Total Cholesterol | 34.3 | 32.8 | 1.5 | 4.6 |
| % T2DM | 5.5 | 5.1 | 0.4 | 7.8 |
| % CVD prevalence | 3.2 | 5.2 | 2.0 | -38.5 |
-
Source: NCDMod version June 2016 and ABS NHS 2014/15 (Australian Bureau of Statistics, 2015b).
-
Notes: Adults aged 18 years and over, aligning with ABS definitions used in reporting. T2DM = Type 2 diabetes mellitus. CVD = Cardiovascular disease.