Microsimulations of demographic changes in England and wales under different EU referendum scenarios
- Averisera Ltd, United Kingdom
- Article
- Figures and data
- Jump to
Figures

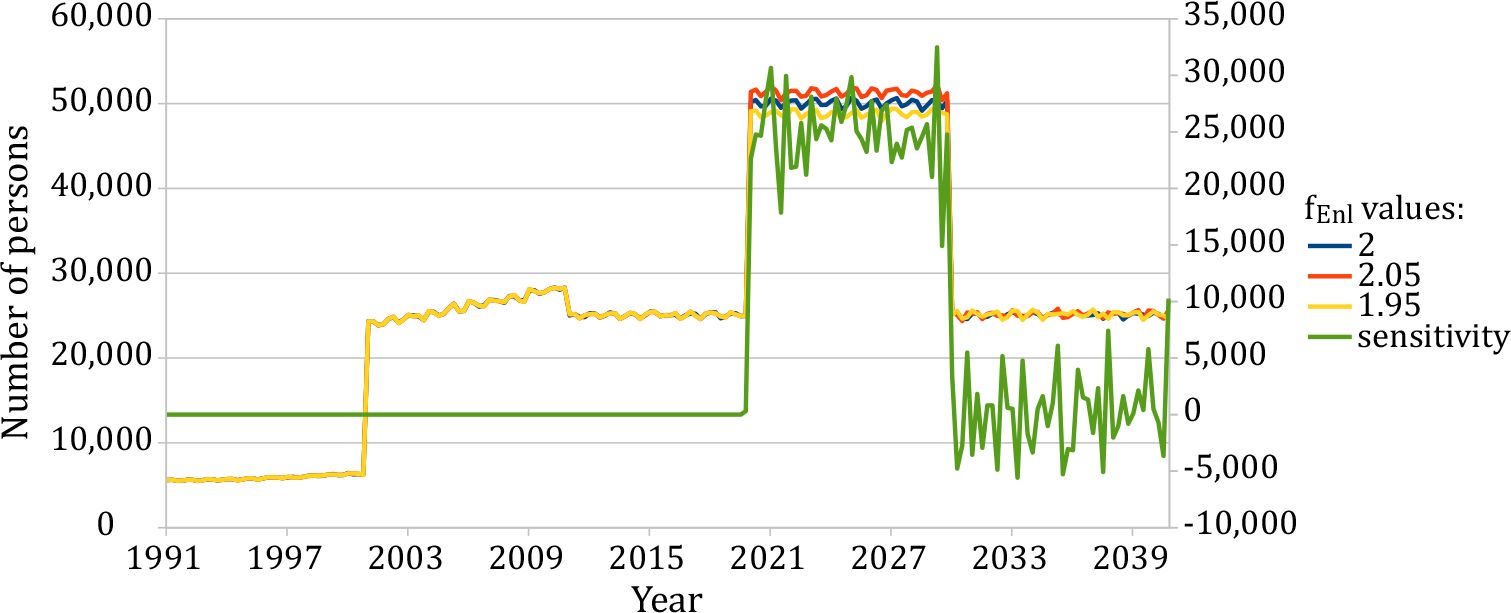
Sensitivity of quarterly immigration flow for Other White ethnic group to fEn parameter in the “2nd enlargement” microsimulation scenario.
Right axis: two-sided numerical derivative for ±5% perturbation. Left axis: quarterly immigration flow. The wiggles result from Monte Carlo sampling error.
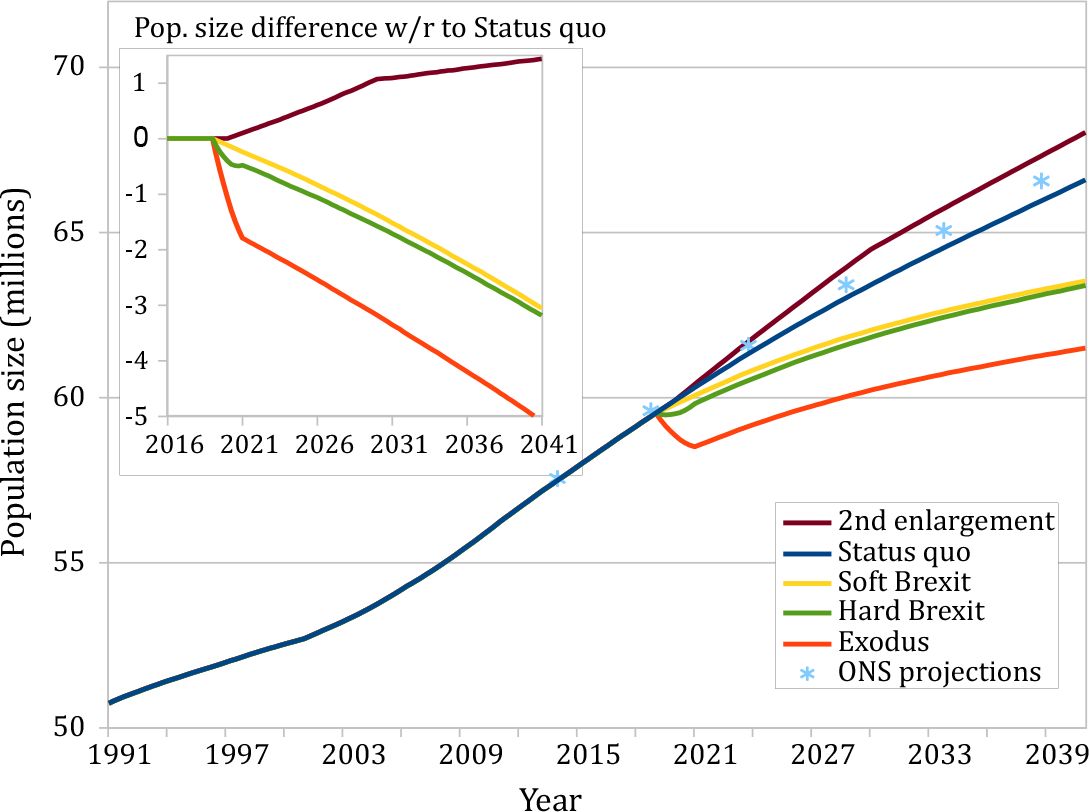
Total size of the E&W population under different EU membership scenarios and the ONS projections.
Inset: differences in the population size between the “Status quo” and other scenarios. The dip after 2019 in the “Exodus” scenario is caused by the large-scale outflow of the EU immigrants.
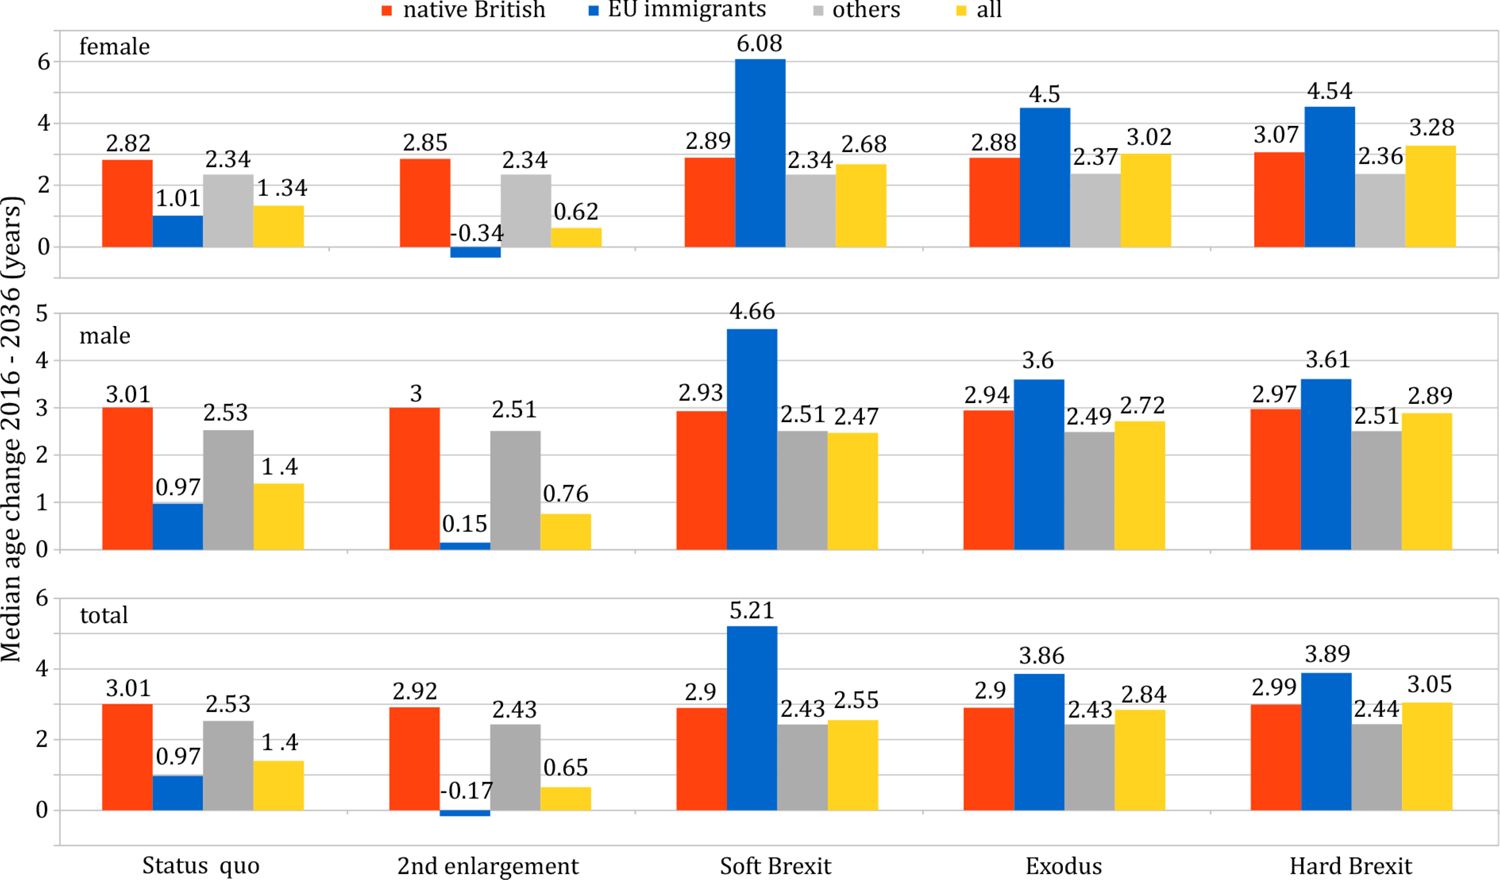
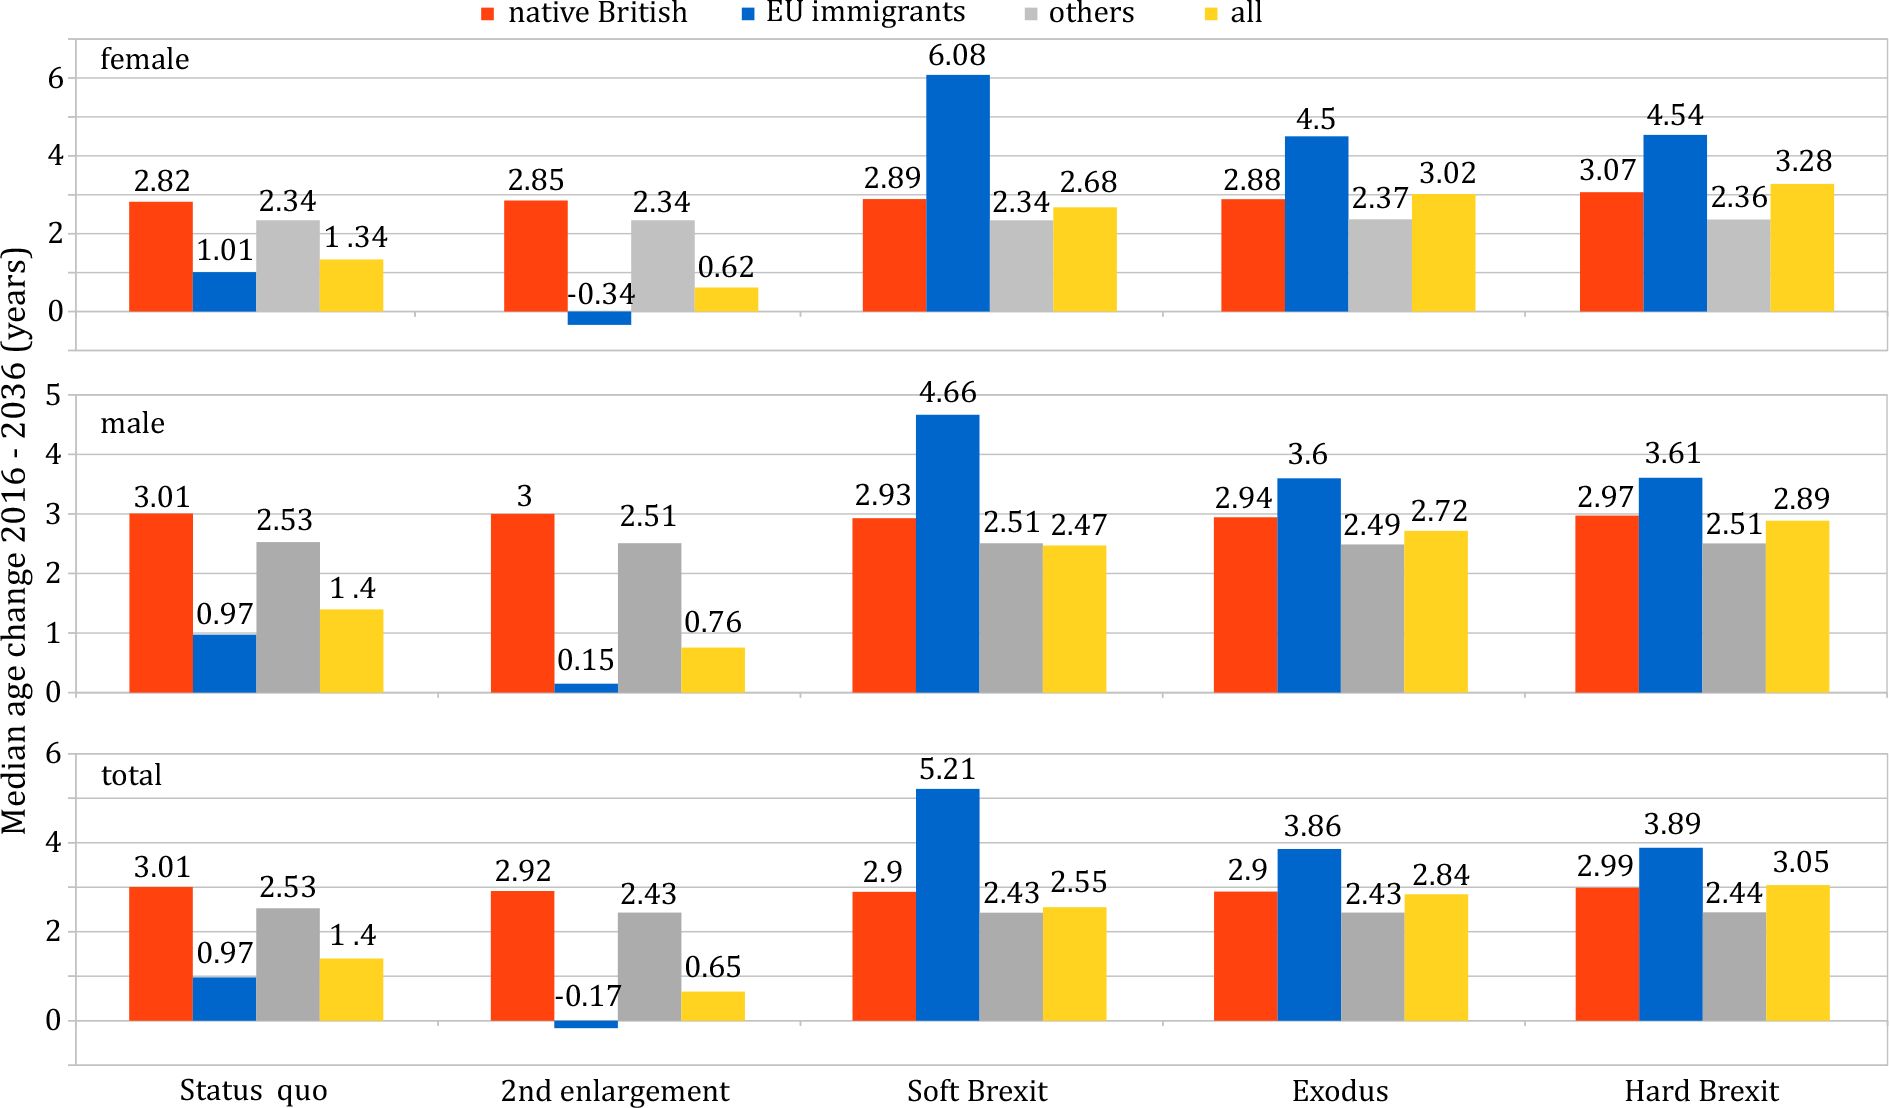
Change in the median age of female, male and total E&W population between 2016 and 2036 under different scenarios for native British, EU immigrants and the remaining ethnic groups (“others”).

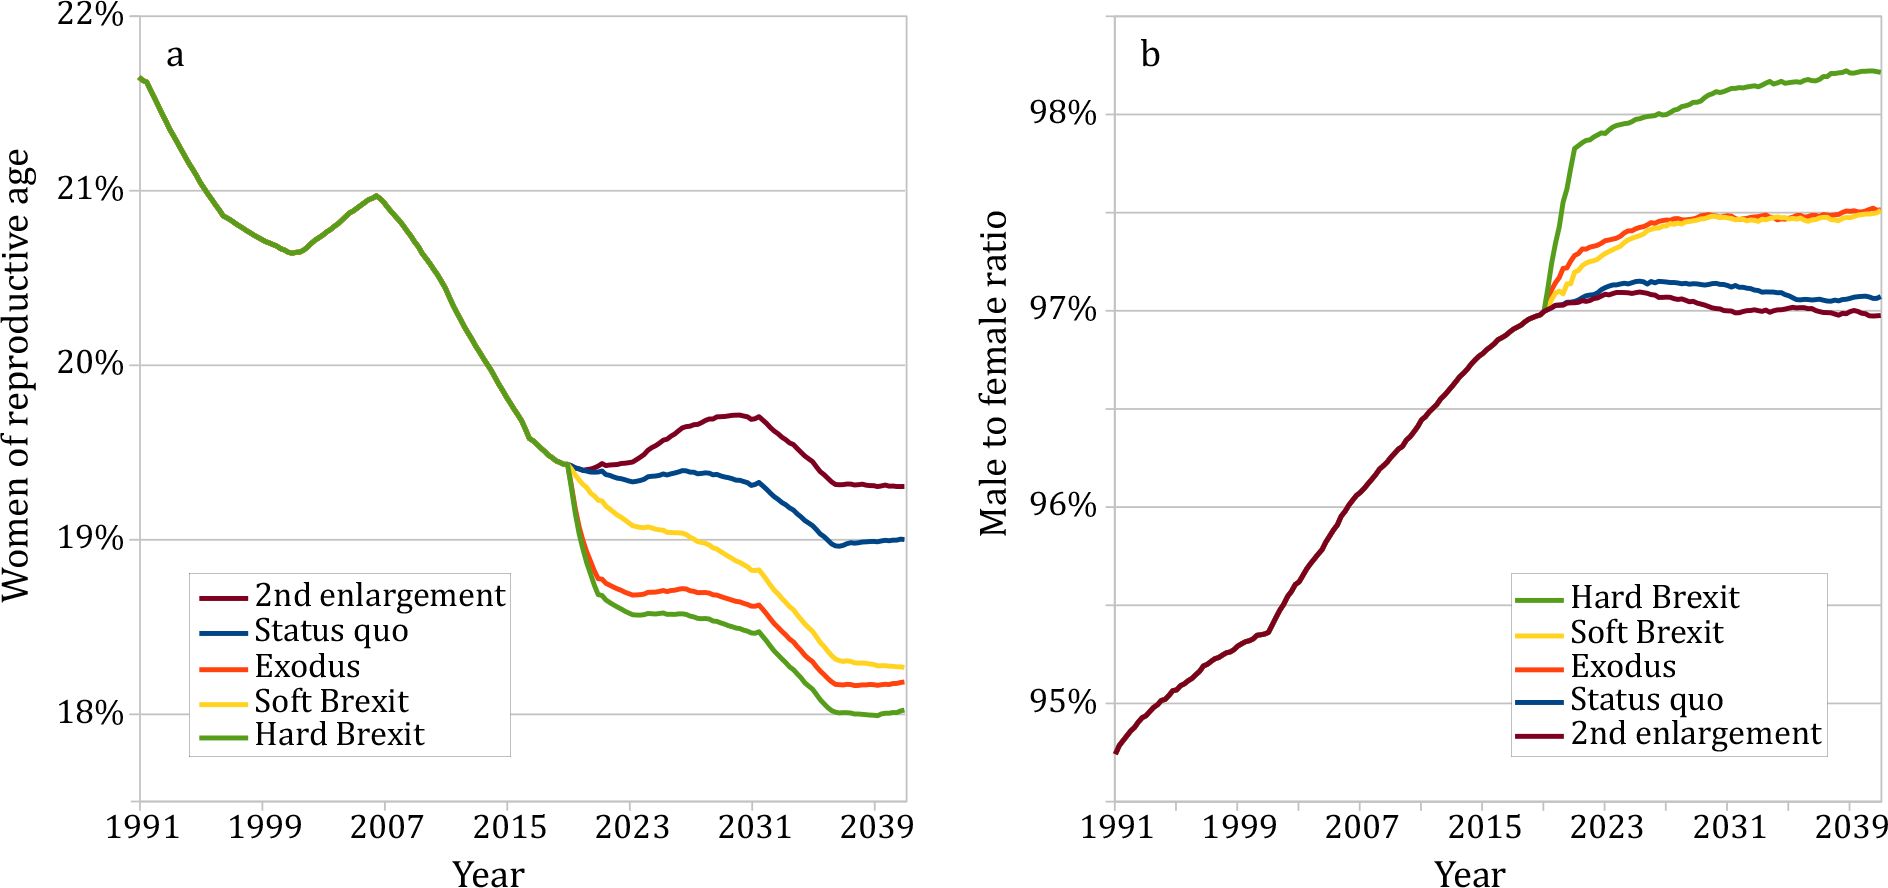
(a) Percentage of women of reproductive age in the total E&W population. (b) Male to female ratio under the considered EU membership scenarios.

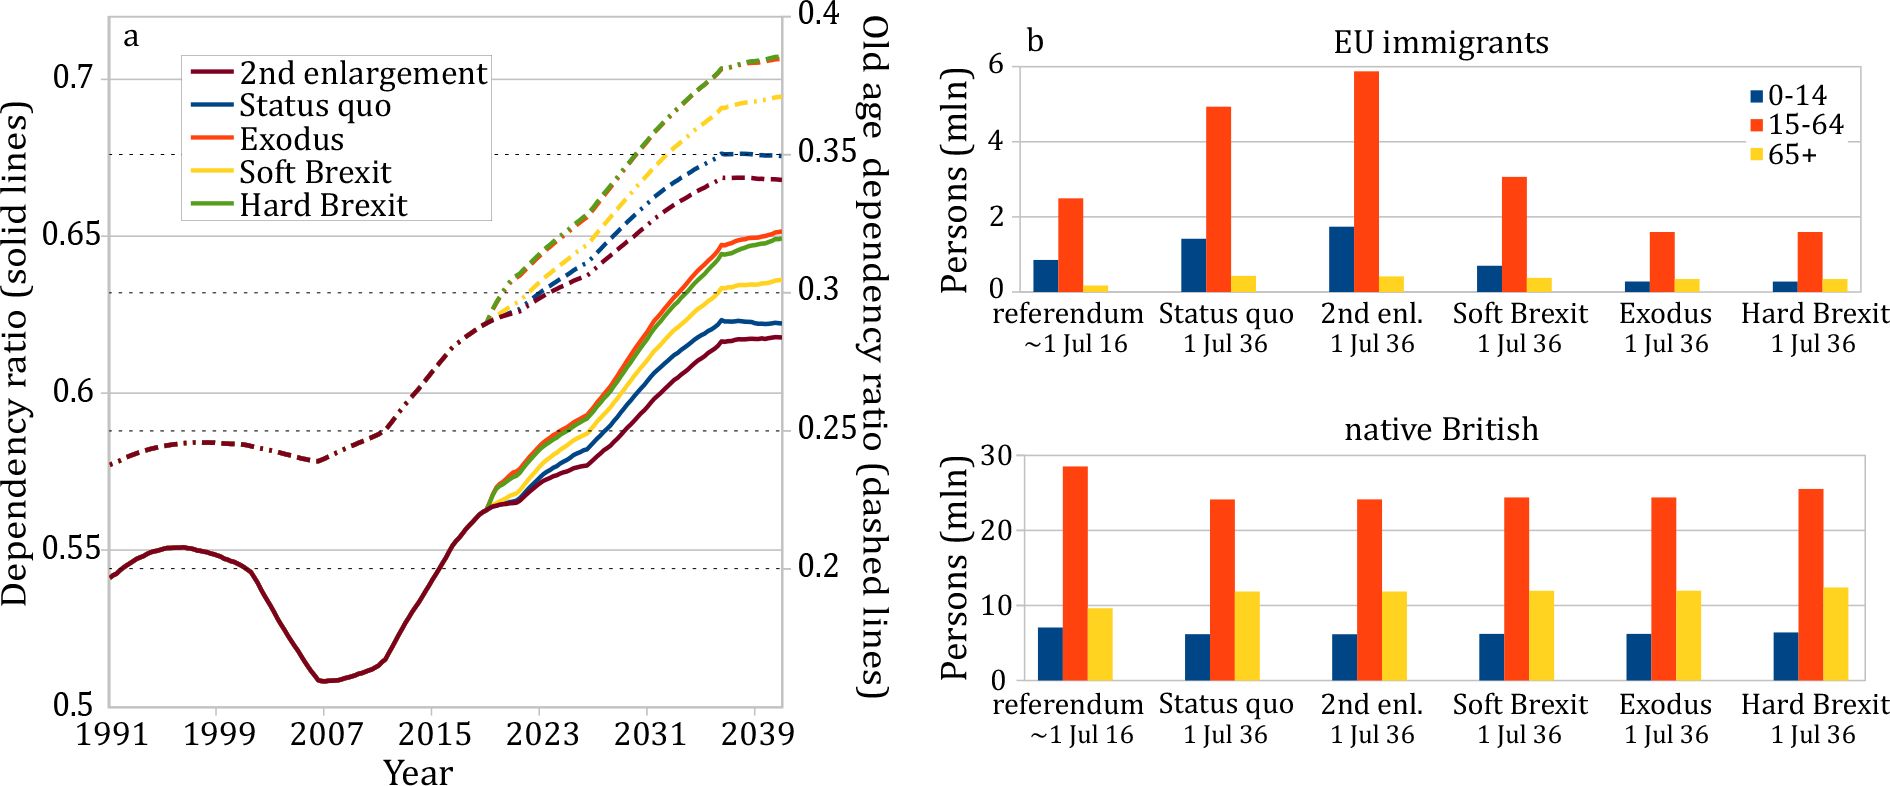
Working-age group relative to children and elderly in the E&W population.
(a) Dependency ratio (solid line, left axis) and old age dependency ratio (dashed line, right axis). (b) Size of the age groups in the EU immigrant and native British populations days after the EU referendum and, following different EU membership scenarios, in2036.

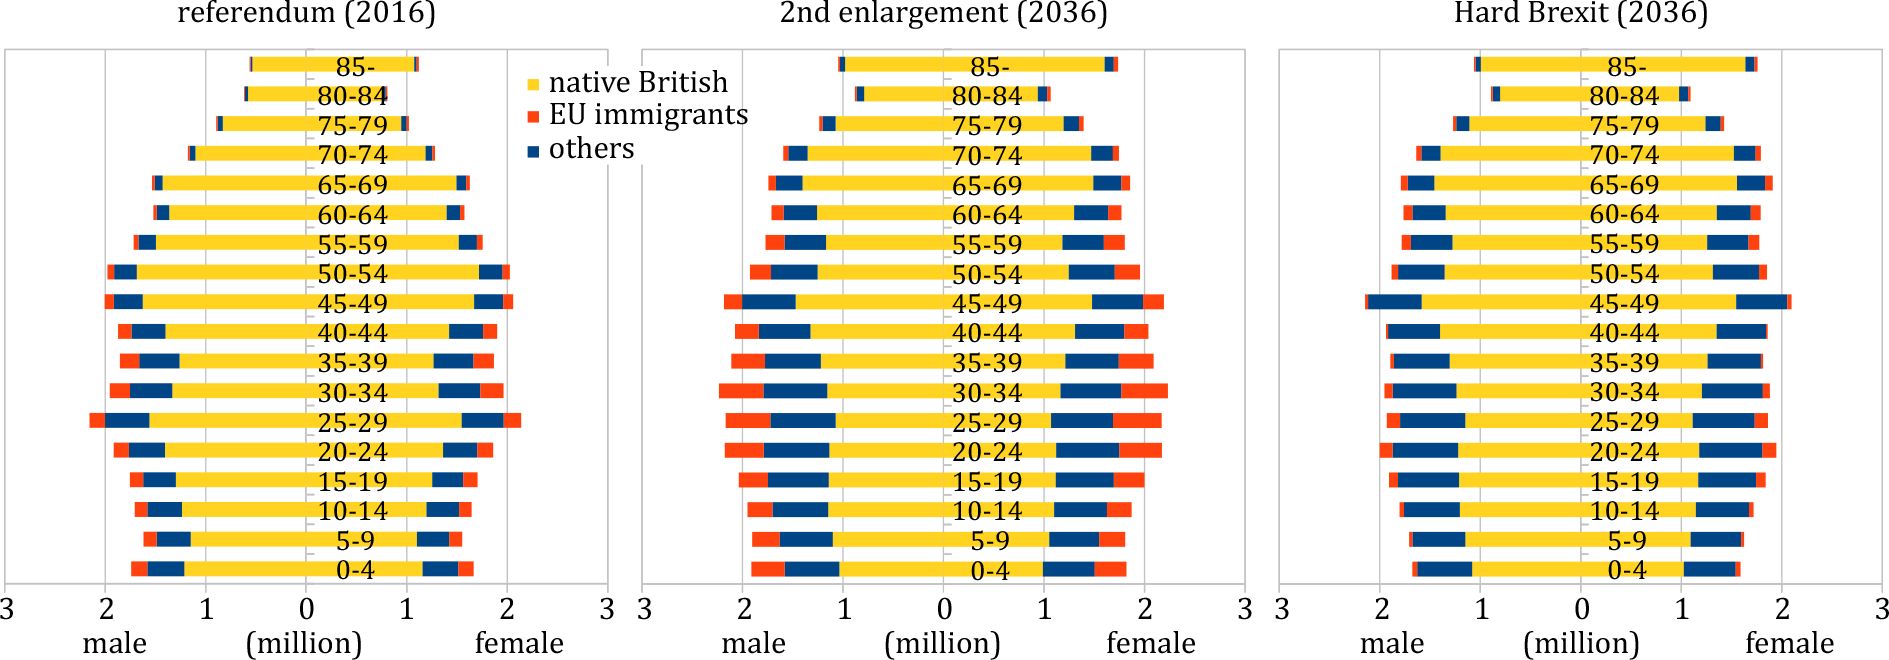
Population pyramids for E&W in 2016 and 2036 for two opposite EU membership scenarios.
Note: “Others” denotes the remaining population, except native British and EU immigrants.

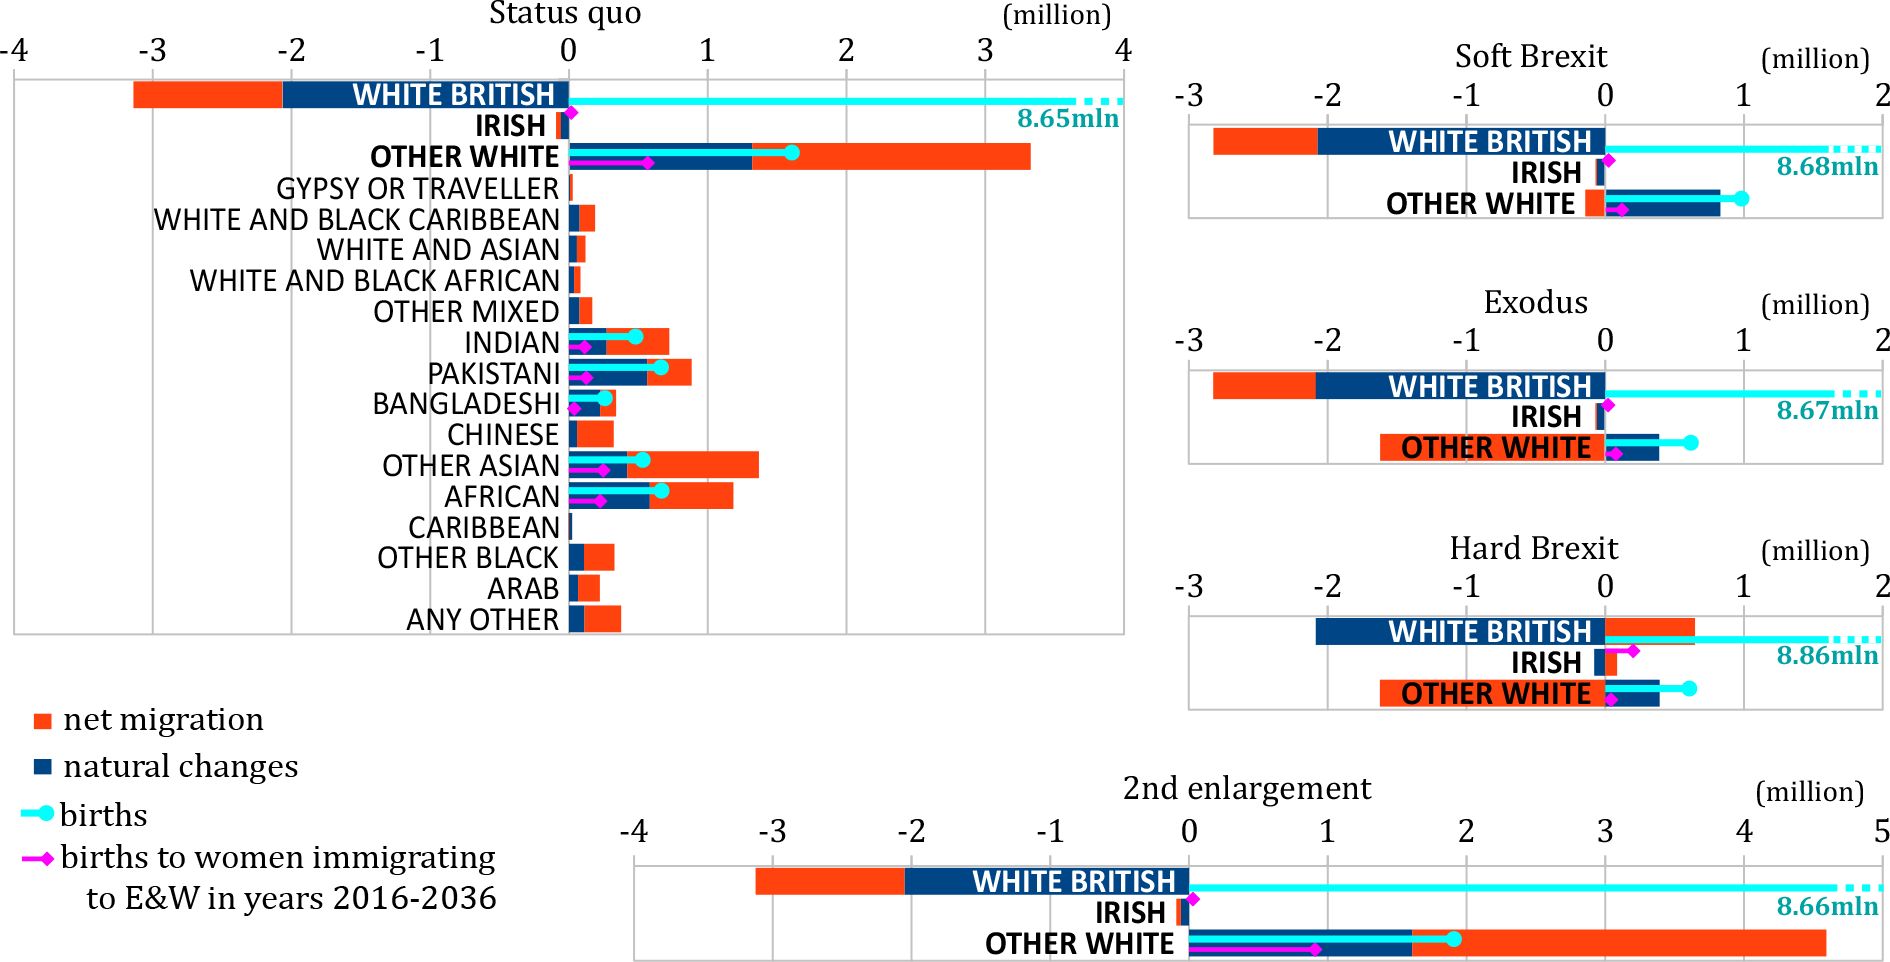
Changes of the ethnic group population due to natural growth and net migration between 2016 and 2036 in the E&W population for different EU membership scenarios.
The number of all births (indicated by a number where it exceeds the axis range) and births only to women who immigrate to E&W in that period are shown for White British and Irish (combined), Other White and several other ethnic groups. The results for ethnic groups unchanged by the scenarios are displayed only in “Status quo” chart.
Tables
Microsimulation parameters for post-referendum scenarios.
| fEnl | fEx | fEm | fRet | |
|---|---|---|---|---|
| Status quo | 100% | 0% | 100% | 0% |
| 2nd enlargement | 200% | 0% | 100% | 0% |
| Soft Brexit | 0% | 10% | 80% | 10% |
| Exodus | 0% | 70% | 80% | 10% |
| Hard Brexit | 0% | 70% | 30 % | 80% |