simSALUD: Design and implementation of an open-source wizard based spatial microsimulation framework
- GeoHealth Laboratory, University of Canterbury, New Zealand
- Carinthia University of Applied Sciences, Austria
- Galileo University, Guatemala
Abstract
Spatial microsimulation models have been in use for around 40 years for various applications. Responding to users’ needs and project purpose, many have emerged using different methods and algorithms. Despite this, the literature suggests a gap in applications combining operability, flexibility, availability or generally an implementation of an online web mapping application in the area of spatial microsimulation. In this paper we introduce the development of a new open-source web-based spatial microsimulation framework, called simSALUD, as a solution approach for static simulation modelling where no programming skills are required. The emphasis lies on the design and implementation of the wizard and web-based spatial microsimulation application, including integrated validation and mapping elements. The current version supports two deterministic spatial microsimulation algorithms (combinatorial optimisation and iterative proportional fitting). The application is designed for experts as well as for non-experts to simulate their own spatial microdata. In addition, the application integrates statistical tools to validate and verify the robustness of the models ad hoc. The outputs of the simulation and validation results can either be visualized in the form of a map within the application or exported as comma separated files for further analyses. simSALUD comes with a demonstration dataset, an extensive documentation and video tutorial to disburden the usage of the software. The architecture of simSALUD was designed with the possibility to expand the tool towards a spatial decision support system, allowing measurement of possible future policy interventions on population groups at small geographies.
1. Introduction
Spatial microsimulation models are typically used to build up large-scale synthetic microdata based on individuals or households to produce unavailable data, so-called ‘missing data’, but they are not widely applied yet. One reason for that could be the absence of easy-to-use software, where programming skills are not obligatory. Therefore, the open-source application simSALUD1 was developed within the project SALUD (SpatiAL microsimUlation for Decision support) funded by the Federal Ministry for Transport, Innovation and Technology and the Austrian Science Fund. SALUD was aiming to build a spatial microsimulation model (SMS) for Austria to support answering questions in health related areas. During that phase we have developed an application, named simSALUD that can be used internationally to contribute to the area of spatial microsimulation modelling. The open-source application is accessible via a website (http://www.simsalud.org/simulation) to either use the simulation directly by connecting to a web link or by downloading and installing the application on a personal computer. In addition, a help tutorial is available that guides the user step by step through the application based on an example with downloadable dummy date. One of the advantages of this platform is to experience spatial microsimulation modelling by using it without spending time on reduplication of existing algorithms. This time can rather be spent on future improvements and developments or on using the modelled output data for more sophisticated analysis in distinctive disciplines, such as health science, transportation, crime analysis, or environmental studies, to name a few. The application is useful for people working with spatial microsimulation models or who would like to learn it, and can also be used for disciplines outside the area of health geography, such as economics and education.
Current literature shows that there is very limited, if any at all, easy-to-use spatial microsimulation software available, especially not when it comes to linking results to spatial visualization tools, which is most valuable for non-programmers and third parties, such as government or small scale companies. Existing applications are often based on programming languages (Java, Python, R, etc.) and often need expert knowledge not only in the field of spatial microsimulation, but also in programming and computer science. LIAM2, for example, provides a generic microsimulation toolbox to develop different kinds of microsimulation models. The tool is programmed using Python and uses the software Notepad++ to develop almost any microsimulation model as long as it uses cross-sectional ageing, i.e. all individuals are simulated at the same time for one period (De Menten, Dekkers, Bryon, Liégeois, & O’Donoghue, 2014). Another open source tool is JAMSIM, where this standalone application is more a loose grouping of open-source packages to provide a base set of functionalities for microsimulation. JAMSIM combines the statistical package R and the Java-based Ascape for the creation of microsimulation models (Mannion, Lay-Yee, Wrapson, Davis, & Pearson, 2012). Kavroudakis (2015a; 2015b) developed a SMS package, the spatial microsimulation library for the Statistical Programming Language R, which contains functions for preparing microdata from census and longitudinal datasets. An advantage of the library is that it uses multi-core approaches (use of parallel interface of R) to divide the main simulation process into smaller simulations, which then run in parallel. Harland (2013) developed a Java-desktop based modelling framework called FMF (Flexible Modelling Framework), for creating synthetic populations using the method of simulated annealing. Another open source microsimulation platform is OpenM++ which is inspired by, and compatible with, Modgen (Model generator), a generic microsimulation programming language, (OpenM++, 2016). A spatial microsimulation modelling application with a focus on predictive policy analysis is Micro-MaPPAS (Ballas, Kingston, Stillwell, & Jin, 2007). The framework was developed with a graphical user interface and access to various modules, such as data analyser, the mapping controls, and projection scenarios, but has not been developed in almost 10 years. Lovelace and Dumont (2016) provide open-source code and working examples for spatial microsimulation modelling within the R environment to map results and to link them with other methods, such as agent based modelling. Also the platform JAS-mine is based on open-source tools that allow users to simulate data using agent-based and dynamic microsimulation approaches (Richiardi & Richardson, 2017). In summary, the development of software tools are of increasing interest and this direction is favourable for the wider community by sharing knowledge and applications around spatial microsimulation.
The aforementioned microsimulation tools provide valuable sources but often they need special expertise too, which is not always available. This can hence lead to loss of time, therefore cost consuming investments, or to no use at all. Such things happen especially when tutorials about the coding and user manual lack detail or are unavailable. Also notable is that models and applications are often developed to solve a specific problem and therefore there is less time or consideration given to producing and sharing well documented algorithms and codes, which leads to time consuming reproductions. Spatial microsimulation publications often mention the usage of algorithms or methods, but the actual source cannot be retraced or understood. Therefore, researchers show their own equations, which differ, but in the end produce the same results (see Edwards & Clarke, 2013; O’Donoghue et al., 2013). On the other hand the same method might be used with small adjustments, which cannot be retraced. When looking deeper into the literature it is noticeable that there is not a common language, meaning that there are many synonyms, e.g. constraints and predictor variables, which can be very confusing for novices and does not clarify the boundary of the discipline. In summary, it can be said that there are valuable but inaccessible or not expandable developments. Existing tools can lack user friendliness, flexibility or do not support mapping tools, where the latter can be especially useful for demonstrating the results and to explore the outcome ad hoc. Therefore, the motivation during this research project was to build, integrate and bundle existing knowledge into a new package, with a long-term thought to attract new people to the area of spatial microsimulation and to gain new scientific knowledge by building on existing and accessible sources.
simSALUD was developed as a flexible web-based spatial microsimulation application to address current gaps and provide an application that is accessible to experts, but also to other interested non-expert groups. It consists of three components: spatial simulation, validation and visualisation/mapping. Users are guided through each step via a wizard-based graphical user interface. The latter was developed to make the application user-friendly and usable. The application is also designed to be expandable in future. Currently, there are two deterministic reweighting spatial microsimulation algorithms implemented from which a user can choose to estimate small area data, validate this data providing a choice of integrated statistical methods, and to map the simulation or validation results. This paper’s focus lies on demonstrating the design and development of the Web-based application simSALUD.
The paper is structured as follows. Section 2 provides an overview of the design phase, introducing the target audience (experts, academics and non-experts) (Subsection 2.1), how usability evaluations where included during the development phase (Subsection 2.2) and briefly introduces the workflow of simSALUD and data handling (Subsection 2.3). Section 3 shifts the focus on to more technical details by explaining the system design, architecture and modules of the application, as this is important to understand the application itself when downloading the application and planning future developments. Section 4 highlights the limitations and possible further developments of the current application by looking at the application itself, as well as data and privacy related issues. Section 5 concludes with summary comments and suggestions for further developments.
2. Design phase of simSALUD
The emerging need for an easy-to-use and open accessible spatial microsimulation application became apparent after attempts to simulate various health-related topics for the country of Austria. Therefore, the primary aim of the development of simSALUD within the research project was to have fast and easy access to the spatial simulation application, to build models, and to use the output for further spatial analysis to answer policy relevant questions. The development of such an application could be time consuming at first, but its continued usage, and possible future development, saves time and money in the long term. This is shown for instance by using the spatial simulation to spatially simulate the smoking prevalence at municipality level (Tomintz & Kosar, 2014; Tomintz, Kosar, & Clarke, 2016), or by Zmölnig, Tomintz, and Clarke (2016) who built a spatial microsimulation for diabetes using the application simSALUD. The time savings of not having to program a code from scratch allowed time to focus on building the model, spatially analyse the data of the modelling results and publish within a year. It is important to note that integrated algorithms into simSALUD are not restricted to health research.
Before starting to build the simSALUD application it was important to define the target audience for the application (Section 2.1). This was necessary for the software design, as an expandable application will have different software design requirements and this is what we were aiming for with simSALUD. Secondly, a focus was given to the usability of the application to overcome barriers of approaching the application, as this is necessary so that it can be easily operated by experts and novices (Section 2.2). Therefore, usability tests were carried out throughout the development phase, which is briefly introduced. Thirdly, given the fact that simSALUD is a web-based tool, a short workflow is introduced, which also includes uploading any data to the application. This is connected to privacy issues that are also considered. The possibility to download and install the application on one’s local own computer to further development or avoid data privacy issues is given.
2.1 Target audience
simSALUD is designed for three target groups, these are (i) experts, (ii) non-experts (policy planners and decision makers), and (iii) academics (teachers and students). Experts are defined as people who are familiar with the area of spatial microsimulation or who are interested in learning and applying this methodology. Non-experts are defined as people who are primarily interested in the results of the simulated microdata to use findings for future planning decision support, and less so in the modelling process. Academics are defined as teachers and students with or without any knowledge in area of spatial microsimulation modelling. Depending on the academic level, simSALUD can be used for workshops, for teaching in classes, for student projects, and more, based on the knowledge of students and aim of learning objective. Also, these groups are not exclusive, e.g. an academic can also be classified as an expert, e.g. if it’s a lecturer in spatial microsimulation. At the current stage, the development is complete for experts and academics only.
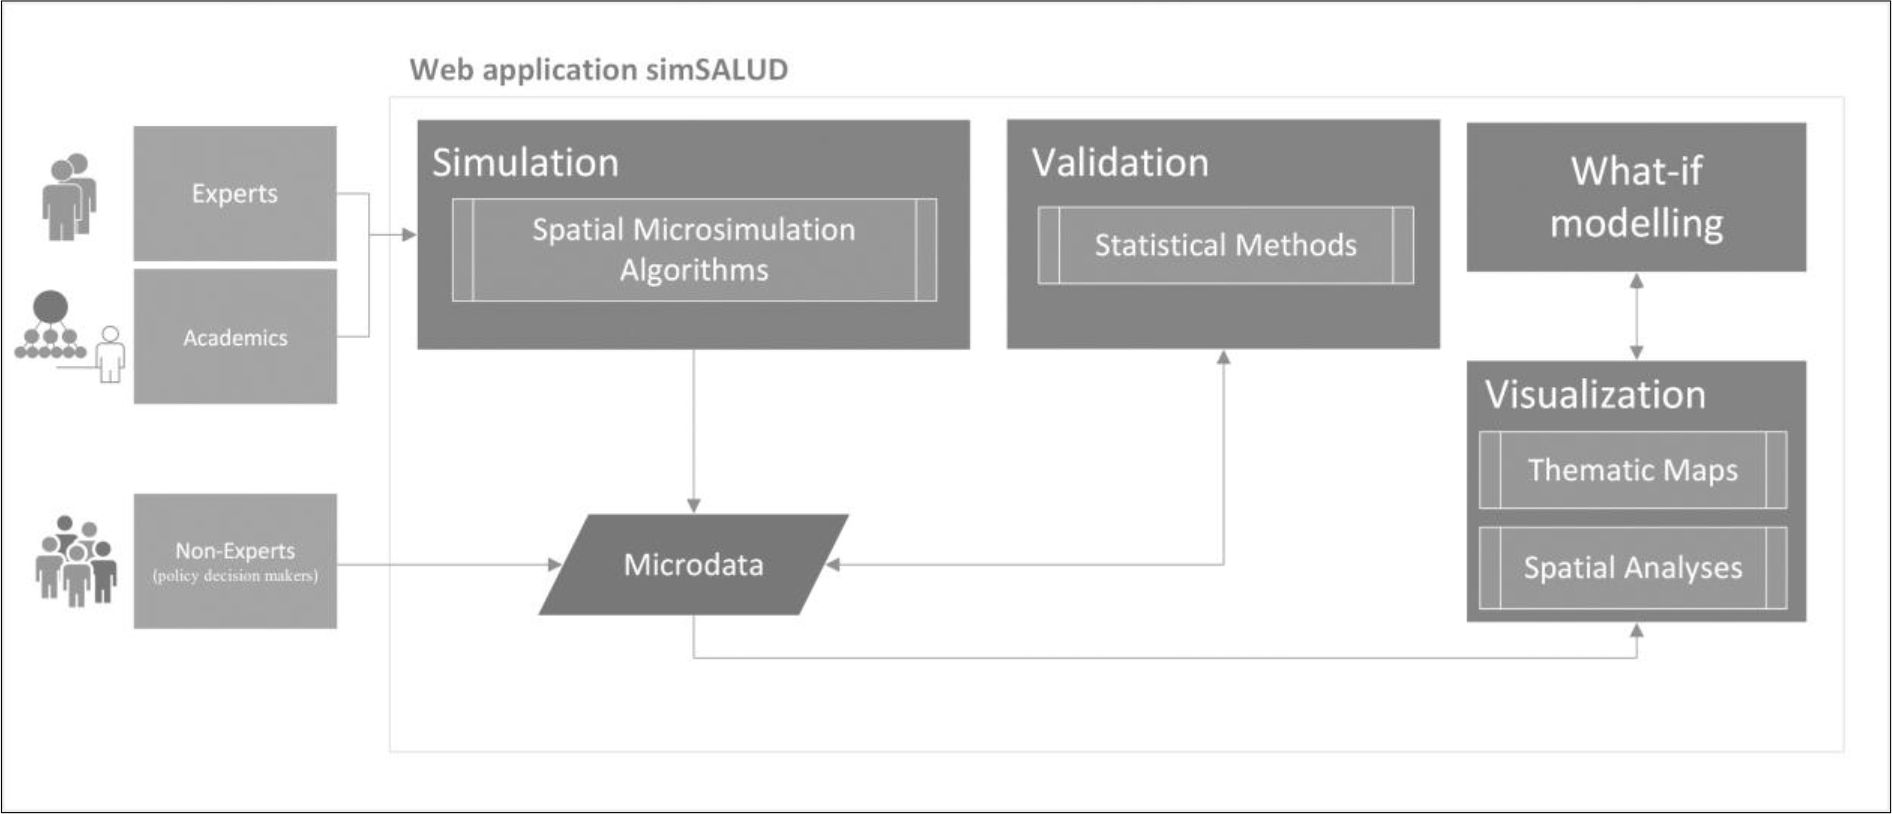
Figure 1 illustrates a basic workflow of using simSALUD for each target audience. Experts and academics use the spatial simulation component to produce synthetic microdata. It is expected that they have knowledge or interest in the modelling procedure. Therefore, they know how spatial microsimulation works and how to prepare data in a way in which it can be used in the web application. As support, a help tutorial is available. Academics in related fields should be at least able to produce microdata and to interpret the simulation and validation results. Non-experts, on the other hand, access the microdata directly after it has been modelled and validated by experts. This step is not yet implemented, but the idea is data sharing through a data pool. Alternatively, non-experts can train themselves to gain sufficient knowledge to produce their own models.

The core components of simSALUD dedicated to the target audience (experts, non-experts, and academics) (see also Tomintz & García-Barrios, 2017).
Important during the development phase was a self-exploratory user interface for a multi-user concept. Hence, to minimise possible navigation errors, the graphical user interface was developed as “wizard-based”, so the application only allows you to continue to step 2 after successful completion of step 1 and so on, i.e. a step-wise approach. Before starting the implementation with coding however, it is important to confirm its usability. Therefore, digital mock-ups were created on which the first usability tests were conducted. The advantage of this approach is to save time during the implementation process, as to change code and specific design architectural modules afterwards can lead to more difficulties and hence time requirements, which leads to increased costs (see Subsection 2.2).
2.2 Usability evaluation
According to Bode and Riebisch (2008) usability is defined as a characteristic describing the ease of use of a system. Before starting any coding we wanted to ensure that the application was user friendly, as otherwise the usage of it will not be guaranteed. Sommerville (2016) argues that engineering is not simply a technical process and that the communication between software developer and customers/end-users is important from an early stage. There are different methods to test the usability of an application or website. Throughout the design and development phase, evaluations were applied using the usability tests after Nielsen (1993; 1994), which are Thinking Aloud and Heuristic Evaluation.
The first usability tests were applied on mock-ups (interactive sketches), which allow the design of the user interface to be evaluated on paper or digitally before source code is written. An advantage of mock-ups is their reality of interaction and they can get sketched using traditional paper and pencil methods or digitally. We decided to use digital mock-ups as they allow the user to drag and drop, resize and rearrange elements, and make adjustments to the mock-ups without starting all over again. The integrated elements in the mock-up software packages can provide a clear picture of the application. For this project, the software Balsamiq was used (https://balsamiq.com/), which allows digital rapid wireframing, as well as exporting the mock-ups as a portable document format (pdf). The first mock-ups were developed by the project team and evaluated by staff (experts) and students (novices) from the Carinthia University of Applied Sciences within workshops and teaching classes. For this purpose we applied the well-known usability tests by Nielsen, i.e. the ten Heuristics that is usually used by experienced users and the usability test Thinking Aloud to receive input from novices (which were students unfamiliar with this content and people outside University that were invited to participate). The ten Heuristics test was sent out to a selected pool of people that were classified as “experts”, who reported their results back either on paper or electronic form. They have ranked issues found from minor to severe changes necessary. The Thinking Aloud tests were set up as labs where participants were guided through the process from one of our research team members. The entire process was video recorded and results were extracted, focussing on interactivity (how quickly can a user navigate from A to B; are all implemented features easy accessible and understandable) and less on the layout itself (i.e. which colour is most appropriate). The evaluation processes was performed iteratively on mock-ups. Based on that a beta version was implemented and tested, including cross-platform and device testing, and as a result a first stable and usable application for the simulation and validation tools within simSALUD (currently version 1.3) was provided online. Results are summarized in the Appendix to show the first set of requirements, which were continuously iterated and adjusted throughout the development process.
2.3 simSALUD workflow and data issues
Figure 2 provides an overview of how simSALUD works and demonstrates the division of the application into three wizard parts, i.e. the simulation wizard, the validation wizard and the visualisation wizard. As presumed from their names, the simulation wizard deals with verifying the input data and running the selected algorithm to produce the simulation results; based on the selection of the user, the validation wizard provides users with a range of methods to validate the aforementioned simulation results; the visualisation wizard joins the simulation or validation results (dependent on what users select) with the appropriate spatial data layer. One requirement of simSALUD is expandability which is important to define early on when it comes to system design (see Section 4). simSALUD can be expanded in different ways by adding additional modelling algorithms or by adding more spatial processing and visualisation tools. The web application is at version 1.3 at the time of writing and has two deterministic reweighting approaches embedded, combinatorial optimization (see Edwards & Clarke, 2013) and iterative proportional fitting (see Lovelace, 2014).
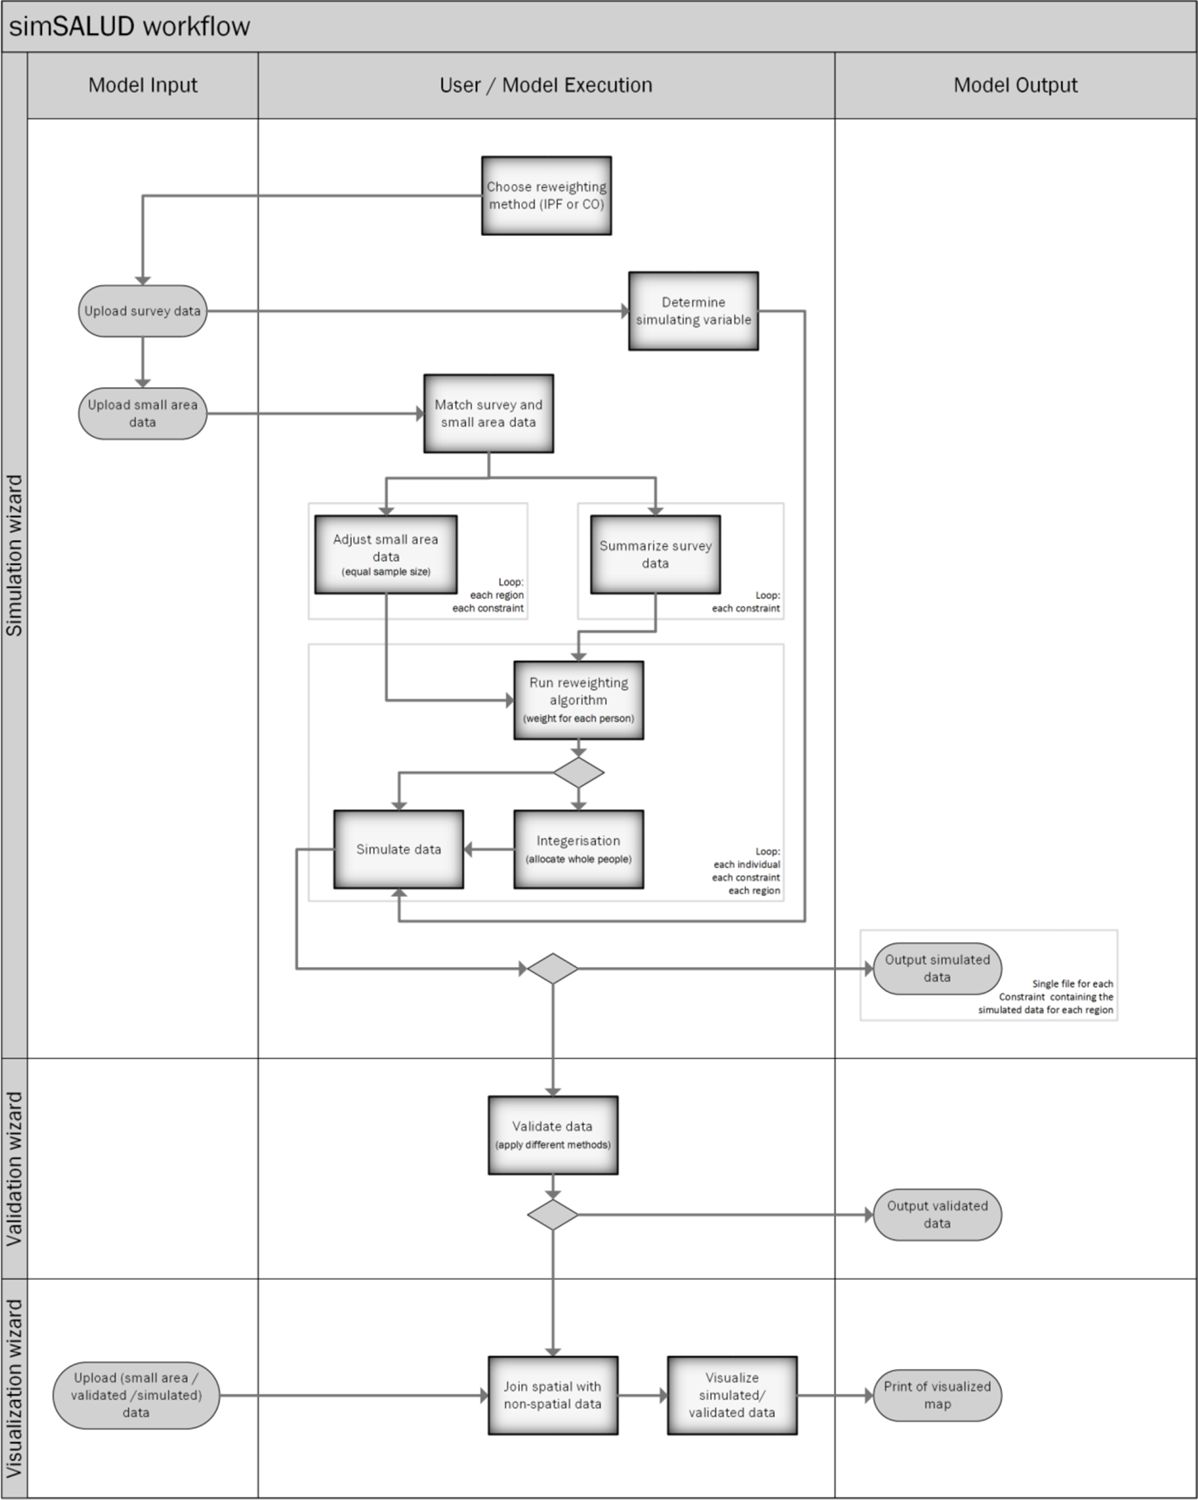
Workflow of the spatial microsimulation model using the simSALUD application.
The workflow is important when it comes to the system design (see Section 4) and data requirements. In its current version, there are two sets of input data required to run a spatial microsimulation model. The first requested data input is a single data file which is usually based on individuals with non-spatial information, such as data from cross-sectional surveys. The second requested data input requires a single file for each of the selected constraint variables including a spatial reference, which is usually an area code. The latter data sets are normally extracted from small area census data. All the aforementioned data files need to be prepared as comma separated values (csv) files following a template structure. The column names are not specified and can be chosen by the user. Attention needs to be given to columns marked with an asterisk, as they are mandatory to include in the data file regarding existence and arrangement. If this rule is violated then the user receives an error message that should help overcome this issue. Support is given by the application itself through help tooltips and help documents at each step and a “help” document is provided too, guiding the user from the start to the end of the modelling process.
The customized prepared files can then be uploaded through the web application using the implemented wizard-based approach to guide users through each step. During the uploading process the application checks for possible errors in the data files and writes them out, such as a missing data field or wrong data format. A “Reset” button was implemented so that users have the option to delete all their data files from the server at any time. In case the user does not delete its own files, another extra feature was implemented that automatically deletes all data files from the server every 24 hours to act as precaution. Another option to maintain data privacy is using a registration process and login function, where each user can administer their data. This option was not considered for implementation, as a login procedure would argue against an easy and fast access to the application. Another option is to download and install the application on the user’s machine, so that all data files do not leave his or her computer. Also given the data requirements, confidentiality issues are usually less of a concern than issues of data purchase and permission use, this is further discussed in Section 4. The development team also put effort into the data validation process to detect and show errors in data files when uploading the input data to the system. Therefore, simSALUD tries to capture both, a client-side validation as well as a server-side validation.
Well-prepared data is fundamental for the application as it requires a certain data format and structure before uploading the files. If the data does not conform to the template provided, then users will receive an ad hoc error message and suggestions as to what might be wrong, e.g. wrong file format or empty cell, pointing out the row and column number. Informing users of what causes the problems, hindering the simulation to run, is an important concern so that users can easily adjust the data and try again. The better the interaction with users, the more likely it is that users will continue using the software. Usability evaluation tests (see Subsection 2.2) have helped to identify placing error messages where needed, as well as to define the content of the error messages). As mentioned before, the application tests if uploaded data files conform with the data structure required by the application to run the model, however, the user is responsible for accurate and robust model results himself according the data input quality and appropriateness.
3. Systems design, architecture and modules
Demonstrating the design and architecture of the application is important so that developers can build on the existing application or on single modules. Before starting the application architectural design, an extensive literature review was done to identify the current state of the art for existing spatial microsimulation applications and best software and technology to use for the purpose of simSALUD. At the time of the development, no public web-based spatial microsimulation applications were available, except for single applications or modules (see Section 1). This encouraged the simSALUD team to develop the flexible and open web-based spatial microsimulation application with an easy-to-use graphical user interface and additional mapping functionalities. This is achieved by providing a generic wizard-based application that does not require the end-user to have background knowledge of a particular programming language. Furthermore, this could also allow experts and non-experts to focus more on specifying and interpreting the model than having to worry about the technical details of the application or with programming an application themselves.
Cross-platform development is important to reach users and this was considered during design and implementation phase. The current version (v1.3) is tested for and supports the internet browsers Mozilla Firefox, Google Chrome, Internet Explorer and Safari, however, changes could appear when internet browsers update their versions. The website also supports responsive design, which means the website dynamically adjusts the layout of the page depending on the device used (mobile device, tablets or PC), as their screens vary in size. The web application can be accessed via the website and used ad hoc. It can also be downloaded from GitHub, where the user has access to the code, a detailed user manually for the installation process, as well as all the software packages needed. Dummy data is also provided which allows the user to test if the installation was successful.
The simSALUD framework uses a representative deployment of Apache Tomcat, PostgreSQL and PostGIS Databases for the spatial simulation and validation, which is open-source and independent of the visualisation module. ESRI’s ArcGIS for Server is used to map the simulation or validation results, whereby the latter is not open-source. However, users can execute it without any barriers using the web application. Only for installation on one’s own hardware, ESRI’s ArcGIS for Server is required, but this element is not open-source. An alternative is to install the simulation and validation modules on its own for modelling purpose only. This shows another advantage of modular built software.
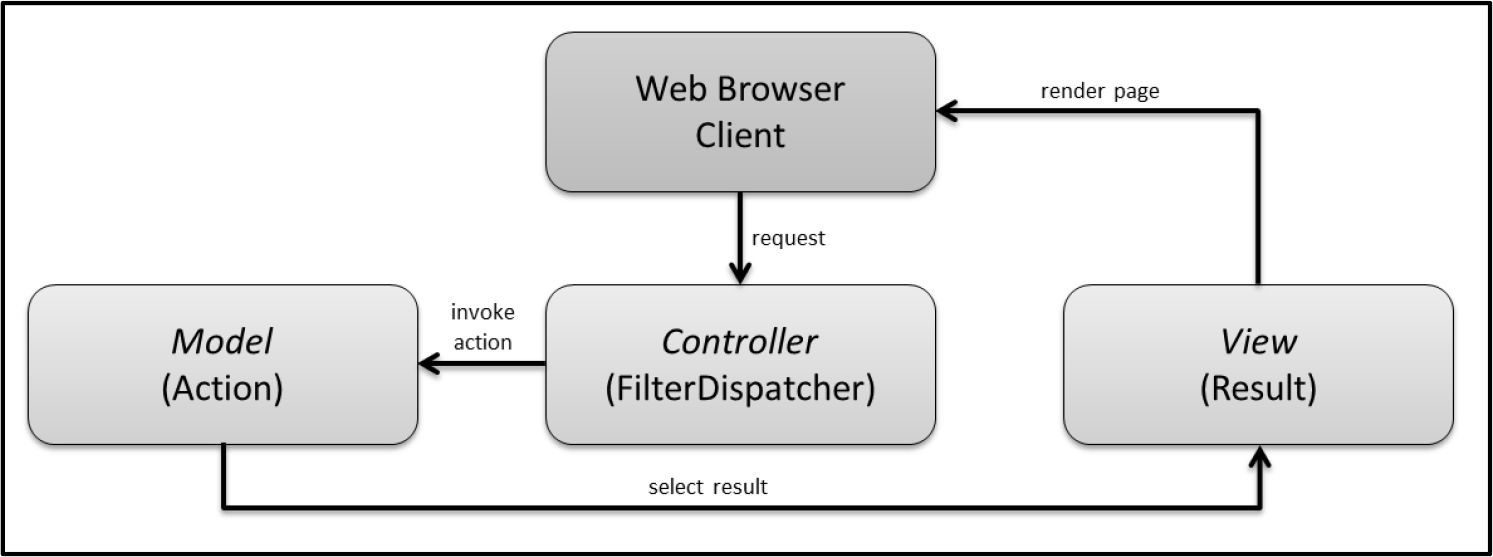
The Web-based application simSALUD is developed in Java and is based on Apache’s open-source web application model-view-controller (MVC) framework Struts2. MVC stands for Model-View-Controller, where the module model is responsible for business logic, the module view handles a user interaction within the application and the module controller controls the flow of the application (see Figure 3). It is an extension of Java Servlets and Java Server Pages (JSP). The choice to use the mature web application Struts2 was based on the advantages of its simplicity and collaboration in the concept for the Java EE platform. Struts is an open-source application developed by Apache Software foundation based on a set of Java technologies such as Servlet, JSP, XML etc. and follows the well-established MVC design pattern (Figure 3). The controller’s job (controller module) is to map (incoming HTTP) requests to the appropriate action. This can be done with a XML-based configuration file. The model (action module) mainly concentrates on the business logic and semantics of the application. The view is the presentation module of the MVC pattern and can be developed using JSP and other HTML technologies. The view module is responsible for getting the input from the user and rendering the result of that input, which is sent back to the user (client). Some advantages of the technology include easy plug-in usage (e.g. jQuery Javascript application), Ajax support (Struts2 tags are Ajax enabled), Tag support (Tags allow the developers to write less code), and a ready to use validation application.

Struts 2 Model-View-Controller is realized by three application modules (Brown, Davis, & Stanlick, 2009).
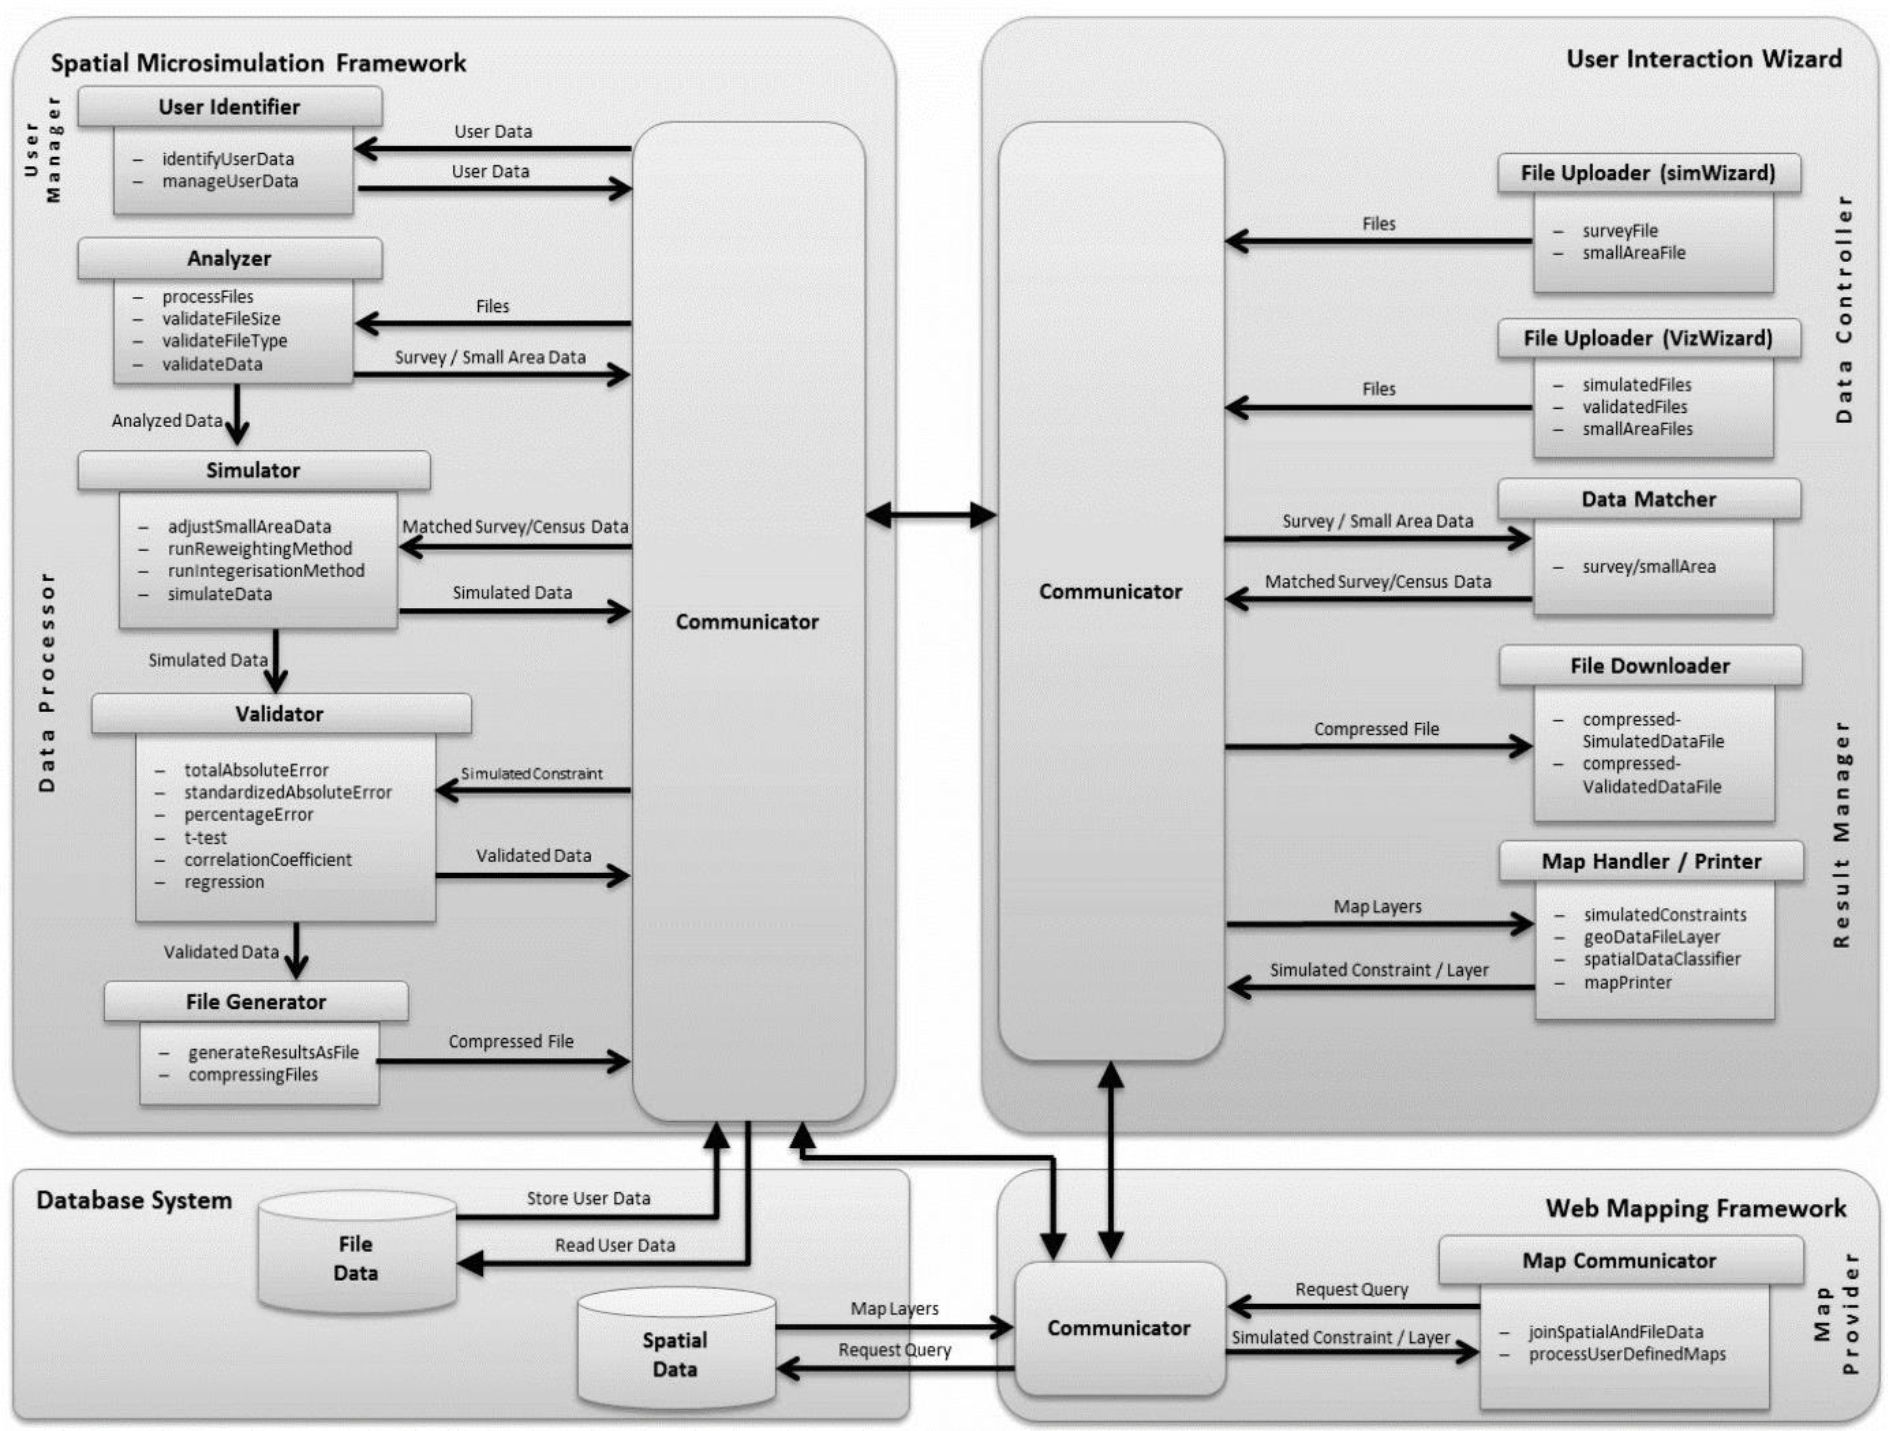
The detailed system architecture of the simSALUD system with its modules is illustrated in Figure 4, which defines the structure and behaviour of the system. A simplified overview is provided elsewhere (see Tomintz & García-Barrios, 2017). The four modules are: Spatial Microsimulation Framework (see Section 3.1), User Interaction Wizard (see Section 3.2), Database System (see Section 3.3), and Web Mapping Application (see Section 3.4).

System architecture of the simSALUD application.
3.1 Spatial microsimulation framework
The spatial microsimulation framework (SMF) can also be seen as the server module. The simulation is set up on Apache’s Tomcat web application server. As a result of the fact that some calculations are very CPU (Central Processing Unit) intensive, the calculation runs on the server, so that the client system (e.g. notebook, desktop computer) does not require further calculation performance and can therefore be used for other tasks during the time of the simulation process itself (the calculation time).
Figure 4 beforehand shows the division of the SMF into a “Data Processor” and “User Manager” unit with five different components. The “User Identifier” manages user identification data as a session so that a user can switch between the application modules without losing the data. After uploading the files and before storing the data into the database, the “Analyzer” component checks the validity of the data including checking the data type as well as several plausibility checks. Before the “Simulator” module is run, it verifies whether any data adjustment is needed. Then, the model execution of the selected spatial microsimulation algorithms is ready to simulate the outcome data. Depending on the integrated validation method a user selects, the “Validator” module executes the appropriate validation method. For the calculation of the validation methods, Apache’s mathematic library “Math” is used. The component “File Generator” converts the data output back into .csv files and compresses all into a zip file that can then be downloaded by the users via the web application.
3.2 User interaction wizard
The graphical user interface of the application is defined as user interface wizard (UIW). In general the application uses the jQuery user interface library which is a collection of graphical user interface widgets implemented with jQuery (Javascript library), CSS and HTML. The design of simSALUD was also developed with the jQuery UI library which was extended to a responsive design with the powerful mobile first front-end application bootstrap. The UIW consists of five components (three under the “Data Controller” and two under the “Result Manager”) which are developed for different tasks.
The first component “File Uploader (simWizard)” allows users to upload the prepared datasets in form of .csv data files (see Section 2.3). The component “File Uploader (VizWizard)” is an additional feature that provides an interface to upload previously simulated or validated results to the application at a later stage, e.g. to validate or map previous simulated data. This overcomes the need to run the simulation and validation over again. The component “Data Matcher” allows users to match the uploaded data files using a drag and drop technique. The UIW also holds the results including the “File Downloader” and “Map Handler / Printer” components. After running the data simulation or validation, the “File Downloader” provides the results as a compressed zip file for further analyses. The “Map Handler / Printer” provides users with an interactive thematic map depending on the constraint category to be displayed.
3.3 Database system
The simSALUD application uses the open-source object-relational database system PostgreSQL and its extension PostGIS. All data which is uploaded from users (non-spatial) is temporary stored in the database. All spatial data which is offered to users over the application is stored into the PostGIS database. PostGIS is an extension of PostgreSQL which allows storage of spatial data for Geographic Information Systems (GIS), much like Oracle’s spatial extension. This spatial data is published as a map service to ArcGIS Server using the software ArcMap. This map service allows publishing of maps and attribute-data available to the web using ArcGIS.
3.4 Web mapping framework
One goal of the project was to enable the possibility of visualizing the simulated and validated data in the form of a map within the simSALUD web-based application. The visualization tool allows users to have an initial overview of the simulation results, which saves loading the results into another mapping software.
The web mapping framework (WMF) with its “Map Communicator” handles use requests for visualizing the simulated data in the form of maps. Depending on the selected geographical data, the “Map Communicator” retrieves the appropriate spatial data from the geodatabase and the simulation outputs from the simulation database. The data from these two databases will be joined based on identical unique IDs in both datasets. The Representational State Transfer (REST) Application Programming Interface (API) supports the response in a JavaScript Object Notation (JSON) format for rendering the map on the client’s browser.
One aim of the Web 2.0 technology is to provide a rich user experience, to encourage participation and to offer Web APIs for users to be able to develop their own application (Fu & Sun, 2011). One of the newer Web-mapping APIs is the ArcGIS Javascript API, which was first released in 2008. The simSALUD developer team decided to use this technology together with ArcGIS Server for building maps, on the one hand for academic training purpose and on the other hand to demonstrate the differences to other web mapping APIs. The web map services are accessed via the ArcGIS REST API, which provides a relatively simple way to use services provided by ArcGIS Server. REST is an architecture style and enables the use of web resources by encapsulating information in the URL and query string of the request. ArcGIS Server includes a REST API for accessing services. The REST API is used in other APIs available with ArcGIS Server, including the stand-alone ArcGIS Server JavaScript API. The map service retrieves the data from the two defined data sources and joins it based on an identical unique ID in both datasets. The REST API returns the data in JSON where the Javascript API displays the map in the browser.
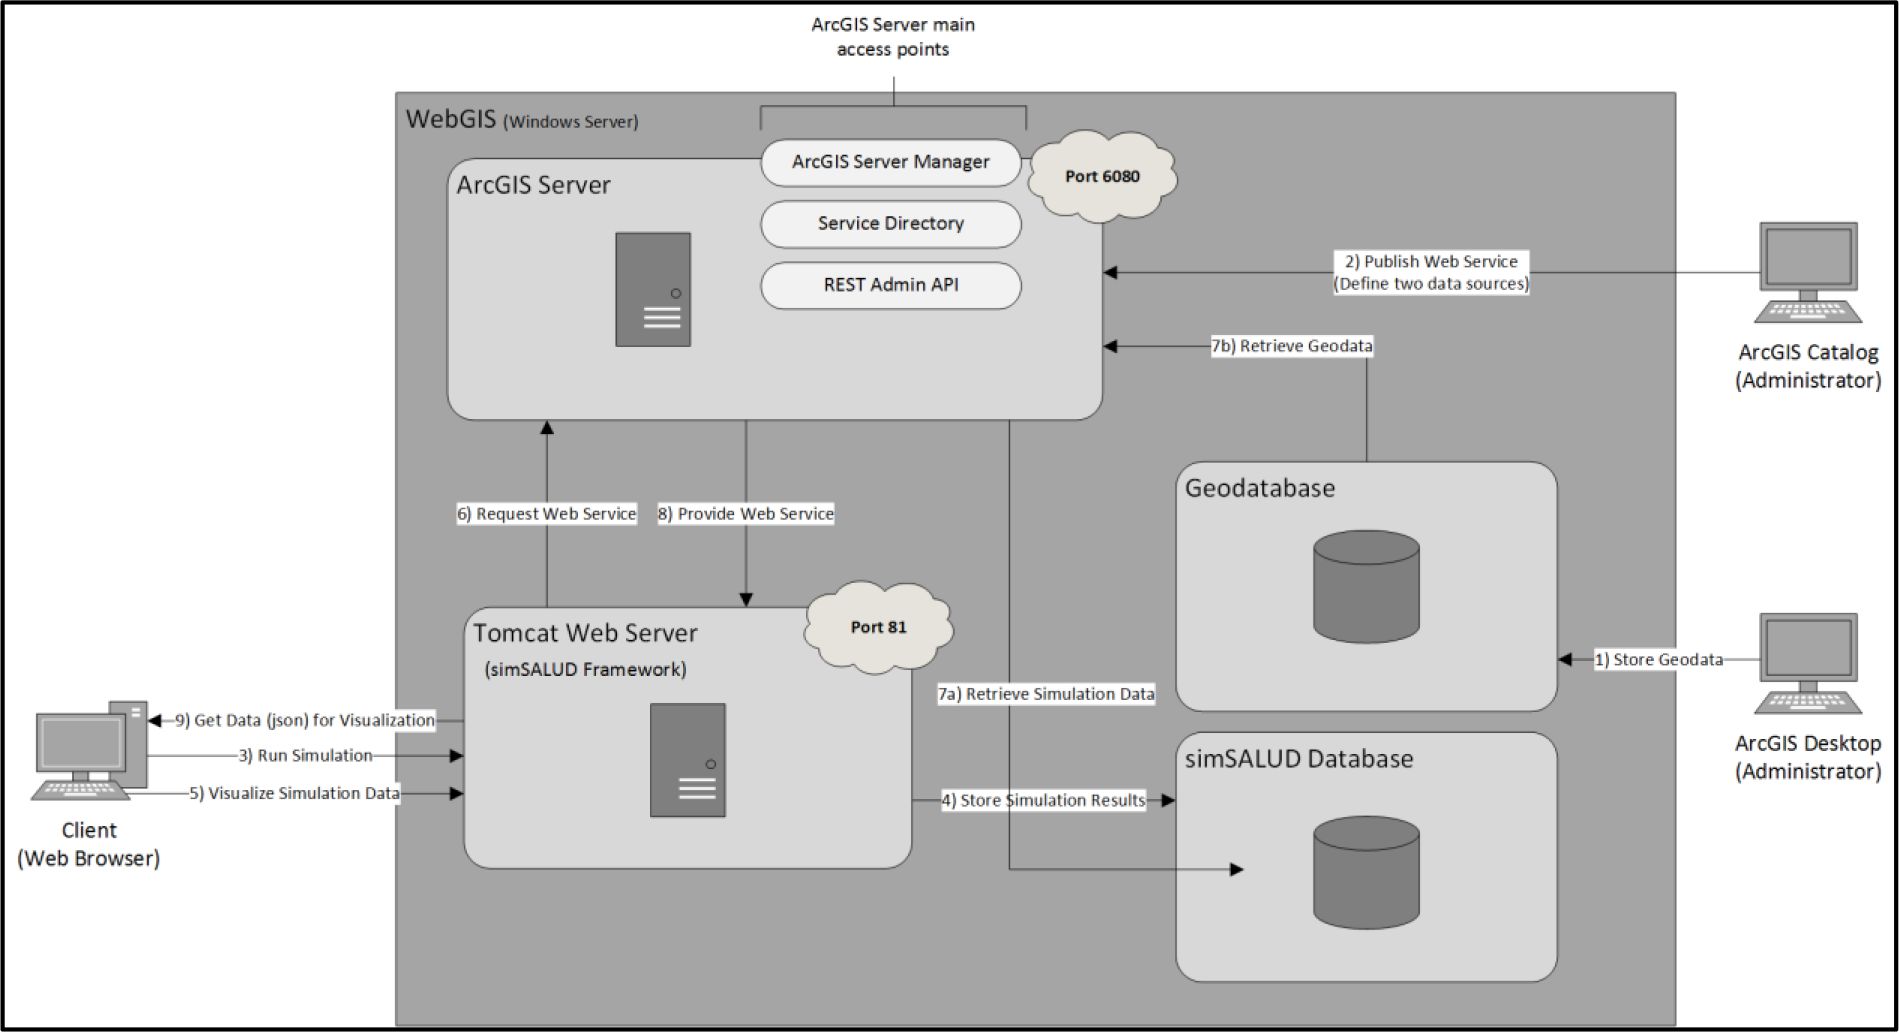
The ArcGIS API for Javascript is built on top of the Dojo JavaScript toolkit and provides ArcGIS Server REST services which are used to embed interactive maps in the simSALUD application. This back-end REST API is able to retrieve information stateless from the server, which consequently runs the code in the browser instead of having to run it on the server. The challenge for the development of the simSALUD application was to join the simulated data with the spatial data stored in different databases. The interaction process to map the simulated and validated data is shown in the server architecture in Figure 5. In the current version of the application, the administrator has to import the spatial data (districts, wards, municipalities, etc.) into the geodatabase that allows access for the front-end by users. One limitation is that users currently have no access to add their own spatial data boundaries for mapping; only when downloading and installing the application on their own devices. The prepared spatial data is published as a map service. All web services have to be defined as a dynamic layer to dynamically add (join) the simulation results from the simSALUD file geodatabase to the spatial data (geodatabase), hence connecting both databases. Both databases (workspaces) have to be registered by the administrator and are assigned with an ID to uniquely identify the workspace within the pool of workspaces available to the map service. For the next version of simSALUD (when resources become available), it is planned to replace this process of registering the spatial data by the administrator with an upload form so that users are able to upload their own spatial data directly. After running the simulation and validation, the results are temporarily stored to the simSALUD database. The simulated data can be displayed on the visualization page, which means requesting the appropriate map service depending on the selected geographical data. This dynamic web layer is displayed on the top of the base map layer “satellite tiles” from ArcGIS. An additional external library allows for classifying the results based on equal interval, quantile and natural breaks classification methods. The ArcGIS Server also provides additional services such as networks services (service area) or other geo-processing services, which are interesting for future implementations. However, these services are not open-source and therefore alternatives need to be considered when offering a pure open-source solution.

Server architecture with an interaction process to visualize simulation data.
4. Limitations and possible future developments
simSALUD is the first version of a wizard and Web-based spatial microsimulation framework to model, validate and visualise spatial microsimulation outcomes. Currently, two static deterministic reweighting algorithms (Co and IPF) are implemented to give the user a choice, which algorithm to use. This is useful as one algorithm can achieve better results over another based on the available data, as well as the proposed research question. Expanding simSALUD by integrating additional algorithms is possible and can be added with appropriate programming skills; as well as shared with others to keep the open-source principle alive. Extending simSALUD for the next version can influence the layout and therefore a redesign might be necessary. Currently, the entire web portal is developed using a responsive web design (RWD) for optimal viewing across a wide range of devices. Some practical tests showed that using the application via small screen mobile devices (Smartphones) reduces comfort regarding uploading and matching the constraints. Another issue occurred using operating systems up to iOS version 5.X, which do not support uploading files via html input tag, but is resolved in iOS version 6.
The simSALUD application allows users to upload a non-spatial .csv survey file. It must be mentioned that the application uses a single “person” entity, which means that each file holds complete information about each individual or household, so there is no aggregation possible of persons living in the same household. Another useful, but still unsolved, function at this stage is the option for users to upload their own spatial data file to join with the non-spatial data (simulated or validated outcome data of simSALUD). At the current stage, both datasets are stored in different databases (non-spatial: PostgreSQL; spatial: PostGIS), where the spatial data is predefined based on a known unique ID that exists in both datasets. Hence, another interface will be required so that users can specify the unique ID for their small area dataset, e.g. from the Census, that will match the geographical data.
Another issue to consider, when it comes to the integrated mapping component within simSALUD, is the number of polygons/features (e.g. municipalities, districts, etc.) that can be rendered on the map. It is challenging to determine the limits for map graphics that are appropriate for a map before performance starts to suffer and this is dependent on different factors such as client’s browser or hardware. A solution for displaying points is much easier by using a raster surface, like a heat map, filtering the data through queries, or clustering, than using polygon data. Displaying polygon data, for example municipalities, is more complex because the smaller the geographical units, the more polygons there are for a particular area to computationally draw; for example one study area can consist of two districts but 400 municipalities. Smaller geographical units show more details that larger geographical units can hide, and this is the purpose when using spatial microsimulation to simulate data for small geographical units. Therefore when it comes to Web-based mapping, not only the number of polygons is important, but also the number of polygon vertices must be considered. The more polygon vertices are used, the more accurate the polygon draws the spatial boundary. However, the more detail, and hence increased amount of vertices, the longer the transfer time to the client which requires more resources. Possible solutions include rendering features depending on the appropriate scale or the integration of a Web Map Service (WMS) where the web server converts the polygon features to a raster (bitmap format), reducing the rendering process of the client.
Last, data security is an important issue for protecting the privacy of the web application and the user’s data, and therefore authentication and authorization of users were discussed during the development phase. The integration of these two important proven security solutions were considered by the authors but not implemented during the first prototype arguing that this could violate our approach to make the application easier to access for all; meaning a login process could build a barrier for certain users regarding accessibility. Another feature can included a tick-box where the user needs to agree to current terms of condition when using the application. This is not added in version one, but should be considered for possible future developments. In addition, a step-wise principle can be taken into account, meaning that some features are accessible without login procedures, whereas for others a login is mandatory. Another improvement regarding data protection for the next roll out would be online access to the framework via HTTPS (Hyper Text Transfer Protocol Secure) instead of HTTP (Hyper Text Transfer Protocol) only. HTTPS allows an encrypted communication between the website and the browser. Having said all this, a feature is implemented where the user is able to delete all his uploaded data immediately from the server at any stage of using the Web-based application.
Regarding interests of non-experts in using this application, it would benefit from a data repository that holds newly created simulated and validated datasets which are made available to everyone for further analysis. This requires careful thought about how it is possible to structure and administrator such an online service. Further, all types of users would benefit from an online service that allows ad hoc modelling of what-if scenarios, e.g. by accessing the aforementioned data repository and by providing user-friendly interactive features that allow users to modify parameters and see changes of the outcome immediately. Such scenarios designed with, or communicated to, decision makers are very valuable.
5. Summary
The simSALUD application is an approach for Web-based spatial microsimulation modelling by providing a wizard-based tool and is the first of its kind. Highlights are different available simulation algorithms, the integrated statistical validation methods, as well as a mapping option for simulated and validated datasets. Another advantage is the form of accessibility, i.e. via the Internet browser that overcomes hurdles such as login procedures or software installation and programming knowledge. However, the application can also be downloaded and installed (installation guidelines are provided) to allow further development or adjustment based on users needs. Downloading and installing the application on the own computer, instead of using the Web-based version, also limits the issue of uploading sensitive data to the Internet. The focus of this paper is strongly on the design and development phase of the simSALUD application itself.
In general spatial microsimulation models can make a major contribution to policy analysis as these models are not widely established and distributed yet, especially not in Austria, and first results are encouraging. Some of the existing models are more complex and inconvenient to access and use, as many of them lack on usability, written or recorded help guides, or require some knowledge of programming languages, which not every user is familiar with. The latter is not generally a disadvantage, but it could put people off learning more about spatial microsimulation modelling. Many applications do not support map visualization of the results and to our knowledge at the time of writing, there does not exist any public web-based spatial microsimulation application that guides people through building their own model. The simSALUD application was developed with the ambition of addressing the aforementioned issues. The target groups are experts, as well as non-experts, academics and educators, where the current first version strongly targets experts and academics/educators.
The application was programmed using Java and is based on Apache’s open source web application model-view-controller (MVC) application Struts2. The easy-to-use graphical user interface was developed using a major part of the cross-platform JavaScript library jQuery which is designed to simplify the client-side scripting of the HyperText Markup Language (HTML). The web application, running on Apache Tomcat, is divided into three modules: simulation, validation and visualization. The simulation wizard guides users through the application, based on the chosen deterministic reweighting approach and an integerisation algorithm, where the latter is optional and aims to only allocate whole people to the final dataset. The validation wizard allows a user to validate the simulation results based on various implemented validation methods, such as TAE or simple regression. The results of the validation process can also be mapped within the application. The visualization wizard uses ESRI’s JavaScript API and ArcGIS for Server for the map visualization. ESRI’s JavaScript API, that is included within ArcGIS for Server, is based on the GeoService Representational State Transfer (REST). The GeoService REST Specification provides a standard way for web clients to request map, features, attribute, and image information from a GIS Server. All geographical data is stored into PostGIS database and stores all the spatial data that is offered for the map representation. In future, the implementation of a Web Processing Service (WPS) to extend the publishing and executing geospatial process for users with OGC standards is planned. An example is uploading a user’s own spatial data and joining it with the user’s simulation validation results. The ArcGIS API for JavaScript also offers additional useful tools for simSALUD, such as the layer swipe widget. This tool compares the content of multiple layers (e.g. relationship between constraint variables) in a map to reveal the contents of the layers with a vertical viewing mode.
From the beginning on, an emphasis lay on the design and usability of the application to encourage people using spatial microsimulation when being a novice. Therefore, usability tests after Nielson (see Section 2) were applied over a two-year period, working with experts and non-experts in this field. First tests were applied on digital mock-ups and finishing adjustments were done on the implemented version itself. Further, the application was also introduced in University courses to receive feedback. After introducing the tool to our project policy collaborators, particular interest was expressed for the mapping tool, as assumed, as people can use data mapping for decision support without being a GIS expert.
The simSALUD framework produced reliable spatial microsimulation results in the context of Austrian public health topics. Currently, the applicability of the simSALUD framework is being tested in a New Zealand context working intensively on the research aspect, but also with the Ministry of Health, as link to the policy and user side. After successful results, further developments on the simSALUD frameworks are planned and will available to the public.
Footnotes
Appendix
The appendix below shows the first extracted functional and non-functional requirements for the simSALUD tool and these requirements where iteratively evaluated, adjusted and prioritised. Each requirement was disaggregated into more precise and defined requirements throughout the design and implementation process.
Functional requirements for the simSALUD framework.
| Functional-Requirement | Functional-Requirement Description |
|---|---|
| Data upload | Users can upload their prepared .csv files through the application. The upload will be divided into two data parts: small area spatial data files and individual based files, e.g. survey data. |
| Choice of simulation algorithms | Users can choose one of the implemented algorithm before starting the simulation process. |
| Data match of input files | Spatial simulation requires a match between census and survey data. Therefore, an easy to use data match needs to be implemented, e.g. using drag and drop. |
| Contextual help | User receives context-sensitive help that describes one current state, situation, or feature by using hover/tooltip. |
| Simulation progress | During the simulation process, users should be able to follow the progress, e.g. progress bar, and follow the steps of the simulation process, e.g. information window. |
| Safe output data files | The simulation and validation results can be saved as a .csv files by downloading it to the users local drive. |
| Map visualization | A map window visualizes the simulated and validated data according to the chosen constraint straight after the simulation/validation execution. |
| Upload data for map visualisation | Users are able to upload previous simulated and validated data for mapping them. |
| Save/Print customized map as pdf | A pdf opens and the map can be printed or saved with the customized title, description, background map, etc. |
| Responsive for desktop, tablet | The application should be responsive for desktop computers/laptop and tablets. Mobile is low priority as its use for this purpose is questionable. |
Non-functional requirements for the simSALUD framework.
| Non-Functional-Requirement | Non-Functional-Requirement Description |
|---|---|
| Help / tutorial | A help/tutorial is required to guide users through simSALUD and include all relevant information. |
| GUI (Geographical User Interface) evaluation | A GUI evaluation is necessary using different target groups and to iterate this process after GUI improvements. |
| Expandability | The architecture of the application needs to be designed for future integration of functionalities, such as more algorithms or geospatial processing tools. |
| Accessibility | The application should be freely available and accessible via a web-based application. |
| Easy to use wizard | Users are guided through the application by using a wizard design approach. |
| Well-designed | A good design so that users find what they want and stay on the page to take actions. |
| Stability | Avoiding system failures and provide a robust model application. |
References
-
1
Spatial microsimulation-based planning for local policy makingEnvironment and Planning A 39:2482–2499.
-
2
http://ieeexplore.ieee.org/stamp/stamp.jsp?arnumber=5172804Usability-Focused Architectural Design for Graphical User Interface Components.
- 3
-
4
LIAM2: a New Open Source Development Tool for Discrete-Time Dynamic Microsimulation ModelsJournal of Artificial Societies and Social Simulation, 17, 3, 9th ser, 10.18564/jasss.2574.
-
5
Spatial microsimulation: a reference guide for users69–85, SimObesity: Combinatorial optimisation (deterministic) model, Spatial microsimulation: a reference guide for users, New York, Springer, 10.1007/978-94-007-4623-7.
- 6
-
7
Microsimulation Model User Guide (Flexible Modelling Framework) (Working paper)Leeds, UK: University of Leeds.
-
8
sms: spatial microsimulationsms: spatial microsimulation, (Version 2.3.1) [Computer software], https://cran.r-project.org/web/packages/sms/.
-
9
sms: An R Package for the Construction of Microdata for Geographical AnalysisJournal of Statistical Software, 68, 2, 10.18637/jss.v068.i02.
-
10
SimSALUD: A Web-based Spatial Microsimulation to Model the Health Status for Small Areas Using the Example of Smokers in AustriaSimSALUD: A Web-based Spatial Microsimulation to Model the Health Status for Small Areas Using the Example of Smokers in Austria, 10.1553/giscience2014s207.
- 11
- 12
-
13
JAMSIM: a Microsimulation Modelling Policy ToolJournal of Artificial Societies and Social Simulation, 15, 1, 8th ser, 10.18564/jasss.1902.
- 14
-
15
Usability Inspection Methods25–63, Heuristic evaluation, Usability Inspection Methods, John Wiley & Sons, New York.
-
16
Spatial microsimulation for rural policy analysis55–86, The SMILE model: Construction and calibration, Spatial microsimulation for rural policy analysis, Heidelberg, Springer, 10.1007/978-3-642-30026-4_4.
-
17
OpenM+ + : open source microsimulation platform [Computer software]OpenM+ + : open source microsimulation platform [Computer software], https://ompp.sourceforge.io/.
-
18
JAS-mine: A new platform for microsimulation and agent-based modellingInternational Journal of Microsimulation 10:106–134.
- 19
-
20
Applied spatial modelling and planning230–248, SimSALUD - Towards a Health Decision Support System for Regional Planning, Applied spatial modelling and planning, London, Routledge, Taylor & Francis Group.
-
21
SmokeSALUD: exploring the effect of demographic change on the smoking prevalence at municipality level in AustriaInternational Journal of Health Geographics, 15, 1, 10.1186/s12942-016-0066-4.
-
22
Mapping the distribution of diabetes for public health support in AustriaGIS.Science 3:86–97.
Article and author information
Author details
Acknowledgements
The simSALUD application is a result of the research project SALUD funded by the Federal Ministry for Transport, Innovation and Technology (bmvit) and the Austrian Science Fund (FWF) (project number TRP280-G16). The authors want to thank all people who were involved in the evaluation process during the development process and appreciate the effort of the proof readers who volunteered during the course of the writing group of the Department of Geography, University of Canterbury.
Publication history
- Version of Record published: August 31, 2017 (version 1)
Copyright
© 2017, Tomintz
This article is distributed under the terms of the Creative Commons Attribution License, which permits unrestricted use and redistribution provided that the original author and source are credited.