The impact of the retirement decision and demographics on pension sustainability: A dynamic microsimulation analysis
- Universitat de Barcelona, Spain
- Universitat Autònoma de Barcelona, Spain
- Austrian Institute of Economic Research (WIFO), Austria
- Article
- Figures and data
- Jump to
Figures

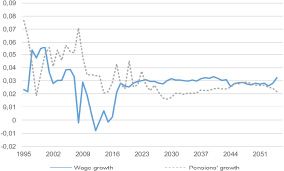
Average wage and pension growth rates (1995–2060).
Sources: Annual Economic Database (1995–2008), European Commission and Spanish Social Security (2008–2060), authors’ calculations.
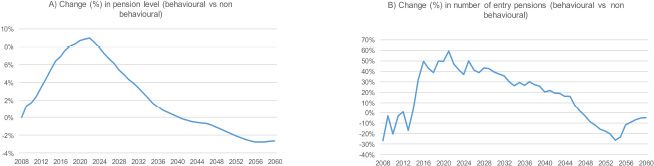
Behavioural versus non-behavioural model.

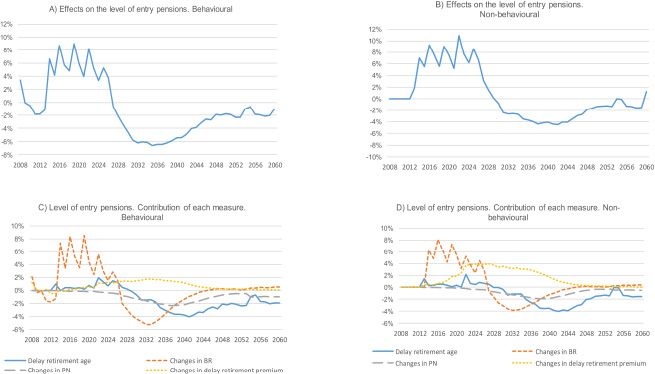
Effects of the 2011 reform on the level of entry pensions (% change).

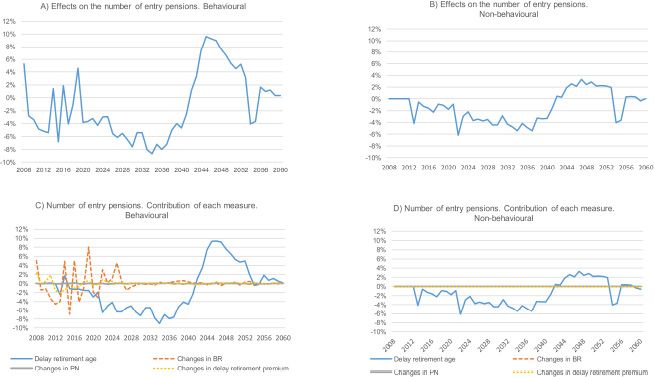
Effects of the 2011 reform on the number of entry pensions (% change).

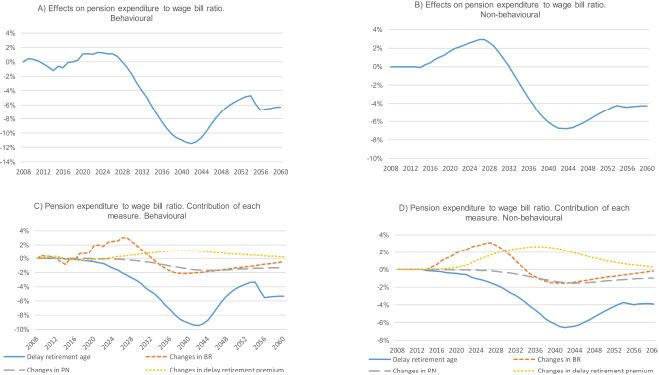
Effects of the 2011 reform on the pension expenditure to wage bill ratio (% change).

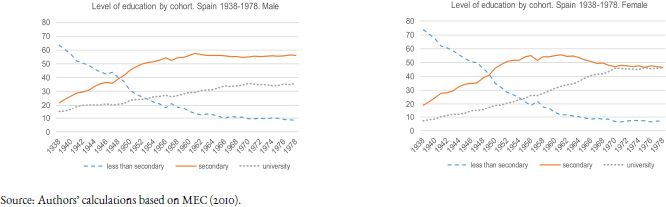
Educational attainment by gender.
Source: Authors’ calculations based on MEC (2010).

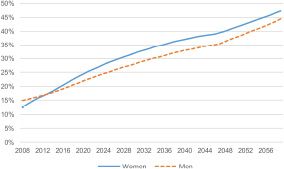
Proportion of population with university studies employed in the highest contribution group.

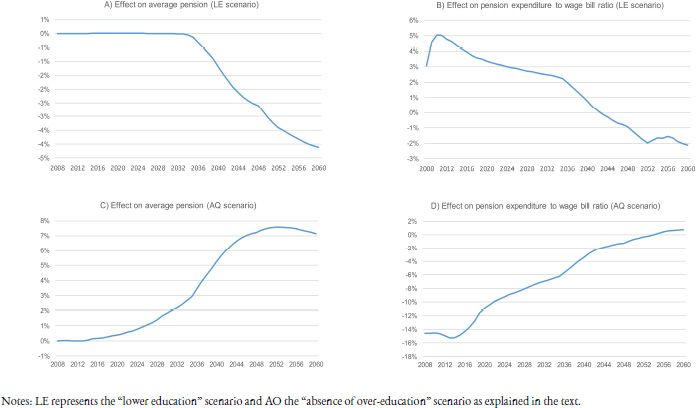
The effect of education on pensions (% change).
Notes: LE represents the “lower education” scenario and AO the “absence of over-education” scenario as explained in the text.

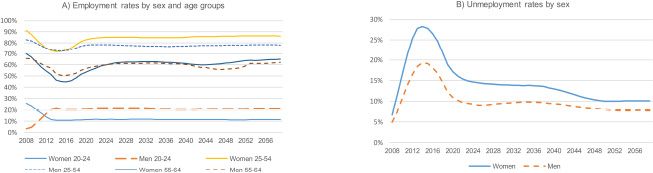
Labour force evolution (2008–2060). Baseline.

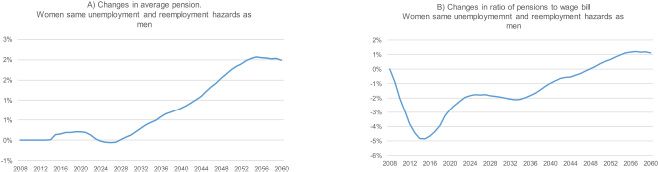
The effect of higher female participation on pensions (changes in %).

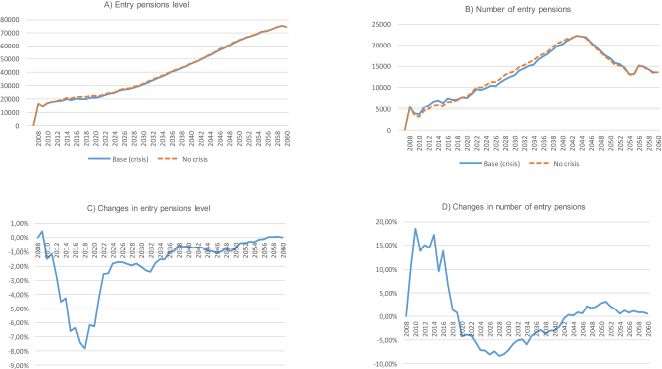
Effect of the current crisis on pensions (level and number).

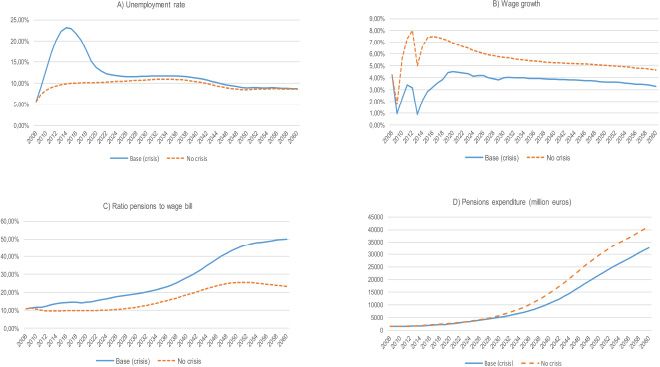
Effect of the current crisis on other indicators.

Effect of the current crisis on pensions (level and number).
Tables
Retirement model (Hazard ratios).
| Men | Women | |||
|---|---|---|---|---|
| Age | 43.08 | ** | 77.87 | ** |
| Age Sq. | 0.972 | ** | 0.968 | ** |
| Secondary studies | 1.050 | ** | 1.142 | ** |
| University studies | 1.062 | ** | 1.271 | ** |
| First year retired | 2.042 | ** | 2.545 | ** |
| Unemployed | 0.313 | ** | 0.000 | |
| Unemployment benefit | 1.000 | * | 1.000 | |
| Wage (1000 € change) | 0.994 | ** | 0.993 | ** |
| PV(a) | 0.995 | ** | 0.992 | ** |
| Time to max. pension | 0.930 | ** | 0.968 | |
| Age at max. pension | 1.000 | 1.000 | ||
| Replacement rate | 1.146 | ** | 1.199 | |
| Minimum pension | 0.926 | ** | 0.862 | ** |
| Months since eligible(log) | 2.627 | ** | 3.182 | ** |
| Unemployment rate | 0.986 | ** | 0.991 | |
| Constant | 0.000 | ** | 0.000 | ** |
-
(a)
Base category: less than secondary.
-
(b)
**Significant at 5º% level.
-
(c)
**Significant at 10º% level.
-
(d)
Difference with respect to maximum pension, 1000 € change.
Hazard rate model for retirement with SSW incentives.
| Men Hazard ratio |
Standard error | Women Hazard ratio |
Standard error | |||
|---|---|---|---|---|---|---|
| Age | 154.48 | 47.83 | ** | 9.909 | 4.223 | ** |
| Age Sq. | 0.952 | 0.002 | ** | 0.971 | 0.003 | ** |
| Secondaty studies | 0.916 | 0.028 | ** | 0.890 | 0.045 | ** |
| Universitary studies | 0.943 | 0.032 | * | 0.966 | 0.062 | |
| First year retired | 4.176 | 0.164 | ** | 3.805 | 0.409 | ** |
| Unemployed | 0.673 | 0.026 | ** | 0.726 | 0.038 | ** |
| Unemployed benefit | 0.287 | 0.069 | ** | 0.222 | 0.072 | ** |
| Wage (1000 € change) | 0.910 | 0.000 | ** | 0.943 | 0.000 | ** |
| SSW | 1.000 | 0.000 | ** | 1.000 | 0.000 | ** |
| PV(a) | 0.994 | 0.000 | 1.000 | 0.000 | ||
| Time to PV | 0.899 | 0.015 | ** | 0.892 | 0.022 | ** |
| Age at PV | 1.002 | 0.000 | ** | 1.002 | 0.000 | ** |
| Replacement rate | 0.972 | 0.015 | * | 1.151 | 0.037 | * |
| Minimum pension | 1.391 | 0.050 | ** | 2.131 | 0.101 | ** |
| Months since elegible (log) | 1.937 | 0.031 | ** | 1.554 | 0.037 | ** |
| BR (1000 € change) | 1.002 | 0.000 | ** | 1.000 | 0.000 | ** |
| Unemployment rate | 1.009 | 0.002 | ** | 1.018 | 0.004 | ** |
| Constant | 0.000 | 0.000 | ** | 0.000 | 0.000 | ** |
-
(a)
Base category: less than secondary.
-
(b)
**Significant at 5º% level.
-
(c)
*Significant at 10º% level.
Yearly wage estimations Dependent variable: yearly wage (full-time equivalent).
| Men Coef | Std. Err. | Women Coef. | Std. Err. | |||
|---|---|---|---|---|---|---|
| Past wage | 0.516 | 0.000 | ** | 0.560 | 0.000 | ** |
| Age | 802.42 | 1.783 | ** | 633.54 | 2.153 | ** |
| Age Sq. | −5.097 | 0.022 | ** | −4.022 | 0.027 | ** |
| Immigrant | −1846.89 | 9.804 | ** | −976.68 | 12.80 | ** |
| Secondary studies | 1022.91 | 5.031 | ** | 1059.16 | 5.946 | ** |
| University studies | 1686.27 | 8.564 | ** | 2366.83 | 8.063 | ** |
| Experience | 0.042 | 0.000 | ** | 0.051 | 0.000 | ** |
| Experience Sq. | 0.000 | 0.000 | ** | 0.000 | 0.000 | ** |
| Non-manual work | 1503.31 | 4.943 | ** | 1360.39 | 5.698 | ** |
| Qualified work | 3733.78 | 11.29 | ** | 3905.67 | 12.33 | ** |
| Year of birth | 355.12 | 0.314 | ** | 279.10 | 0.401 | ** |
| Unemployment rate | 27.13 | 0.459 | ** | 45.01 | 0.548 | ** |
| Constant | −714479.50 | 629.37 | ** | −563384.90 | 803.22 | ** |
-
(a)
Base category: less than secondary.
-
(b)
**Significant at 5º% level.
-
(c)
*Significant at 10º% level.
Unemployment probabilities for people older than 58 (Logit model).
| Men Coef. | Std. Err. | Women Coef. | Std. Err. | |||
|---|---|---|---|---|---|---|
| Coef. | Std. Err. | Coef. | Std. Err. | |||
| Age | 3.070 | 0.472 | ** | 0.675 | 0.386 | * |
| Age Sq. | −0.025 | 0.004 | ** | −0.006 | 0.003 | * |
| Immigrant | −0.574 | 0.062 | ** | −0.070 | 0.0780 | |
| Secondary studies | −0.279 | 0.063 | ** | −0.146 | 0.066 | ** |
| University studies | −1.704 | 0.395 | * | −1.516 | 0.476 | ** |
| Experience | 0.011 | 0.006 | * | −0.018 | 0.005 | ** |
| Experience Sq. | −0.000 | 0.000 | * | 0.000 | 0.000 | ** |
| Non-manual work | −0.555 | 0.064 | ** | −0.208 | 0.050 | ** |
| Qualified work | 0.439 | 0.385 | 0.437 | 0.460 | ||
| Unemployment rate | 0.080 | 0.004 | ** | 0.0230 | 0.004 | ** |
| Constant | −94.45 | 14.599 | ** | −21.153 | 12.001 | * |
-
(a)
*Base category: less than secondary.
-
(b)
**Significant at 5º% level.
-
(c)
*Significant at 10º% level.
Retirement model 2005–2014 vs. 2005–2010.
| Men Model 1 | Model 2 | Women Model 1 | Model 2 | |||||
|---|---|---|---|---|---|---|---|---|
| Age | 21.22 | ** | 43.08 | ** | 0.829 | ** | 77.87 | ** |
| Age Sq. | 0.976 | ** | 0.972 | ** | – | 0.968 | ** | |
| Secondary studies | 0.973 | 1.050 | ** | 0.857 | 1.142 | ** | ||
| University studies | 1.152 | ** | 1.062 | ** | 0.932 | 1.271 | ** | |
| First year retired | 11.22 | ** | 2.042 | ** | 7.252 | ** | 2.545 | ** |
| Unemployed | 0.656 | ** | 0.313 | ** | 0.692 | ** | 0.000 | |
| Unemployment benefit | 0.156 | ** | 1.000 | * | 0.213 | ** | 1.000 | |
| Wage (1000 € change) | 0.992 | ** | 0.994 | ** | 0.992 | ** | 0.994 | ** |
| PV(a) | 0.953 | ** | 0.998 | ** | 0.899 | ** | 0.993 | ** |
| Time to max. pension | 0.995 | * | 0.930 | ** | 1.002 | 0.968 | ||
| Age at max. pension | 1.000 | * | 1.000 | 1.000 | 1.000 | |||
| Replacement rate | 1.074 | ** | 1.146 | ** | 1.131 | ** | 1.199 | |
| Minimum pension | 1.124 | * | 0.926 | ** | 1.438 | ** | 0.862 | ** |
| Months since eligible(log) | 1.329 | ** | 2.627 | ** | 1.476 | ** | 3.182 | ** |
| Unemployment rate | 1.012 | ** | 0.986 | ** | 1.012 | * | 0.991 | |
| Constant | 5454.00 | ** | 0.000 | ** | 6453.00 | ** | 0.000 | ** |
-
(a)
Base category: less than secondary.
-
(b)
**Significant at 5º% level.
-
(c)
*Significant at 10º% level.
-
(d)
Difference with respect to maximum pension, 1,000 € change.
Inclusion of disability.
| Men Model 1 | Model 2 | Women Model 1 | Model 2 | |||||
|---|---|---|---|---|---|---|---|---|
| Disability degree | – | – | 0.993 | ** | – | – | 0.995 | |
| Dummy disability | – | – | 0.751 | ** | – | – | 0.841 | |
| Age | 43.08 | ** | 43.31 | 77.87 | ** | 78.16 | ** | |
| Age Sq. | 0.972 | ** | 0.972 | ** | 0.968 | ** | 0.968 | ** |
| Secondary studies | 1.050 | ** | 1.049 | * | 1.142 | ** | 1.143 | ** |
| University studies | 1.062 | ** | 1.061 | * | 1.271 | ** | 1.270 | ** |
| First year retired | 2.042 | ** | 2.042 | ** | 2.545 | ** | 2.542 | ** |
| Unemployed | 0.313 | ** | 0.315 | ** | 0.000 | 0.000 | ||
| Unemployment benefit | 1.000 | * | 1.000 | * | 1.000 | 1.000 | ||
| Wage (1000 € change) | 0.993 | ** | 0.993 | ** | 0.992 | ** | 0.992 | ** |
| PV(a) | 0.994 | ** | 0.994 | ** | 0.993 | ** | 0.993 | ** |
| Time to max. pension | 0.930 | ** | 0.930 | ** | 0.968 | 0.968 | ||
| Age at max. pension | 1.000 | 1.000 | 1.000 | 1.000 | ||||
| Replacement rate | 1.146 | ** | 1.147 | ** | 1.199 | 1.200 | ||
| Minimum pension | 0.926 | ** | 0.926 | ** | 0.862 | ** | 0.862 | ** |
| Months since eligible(log) | 2.627 | ** | 2.629 | ** | 3.182 | ** | 3.180 | ** |
| Unemployment rate | 0.986 | ** | 0.986 | ** | 0.991 | * | 0.991 | |
| Constant | 0.000 | ** | 0.000 | ** | 0.000 | ** | 0.000 | ** |
-
(a)
Base category: less than secondary.
-
(b)
**Significant at 5º% level.
-
(c)
*Significant at 10º% level.
-
(d)
Difference with respect to maximum pension, 1,000 € change.
Inclusion of marriage/partnership.
| Men Model 1 | Model 2 | Women Model 1 | Model 2 | |||||
|---|---|---|---|---|---|---|---|---|
| Married/partnership | – | – | 1.078 | ** | – | – | 1.005 | |
| Age | 43.08 | ** | 44.05 | ** | 77.87 | ** | 70.42 | ** |
| Age Sq. | 0.972 | ** | 0.972 | ** | 0.968 | ** | 0.968 | ** |
| Secondary studiesa | 1.050 | ** | 1.061 | ** | 1.142 | ** | 1.131 | ** |
| University studies | 1.062 | ** | 1.072 | * | 1.271 | ** | 1.265 | ** |
| First year retired | 2.042 | ** | 2.059 | ** | 2.545 | ** | 2.415 | ** |
| Unemployed | 0.313 | ** | 0.357 | * | 0.000 | 0.000 | ||
| Unemployment benefit | 1.000 | * | 1.000 | * | 1.000 | 1.000 | ||
| Wage (100 € change) | 0.994 | ** | 0.994 | ** | 0.993 | ** | 0.993 | ** |
| PV(a) | 1.000 | ** | 1.000 | ** | 0.999 | ** | 0.999 | ** |
| Time to max. pension | 0.930 | ** | 0.932 | ** | 0.968 | 0.984 | ||
| Age at max. pension | 0.993 | 0.994 | 0.994 | 0.994 | ||||
| Replacement rate | 1.146 | ** | 1.140 | ** | 1.199 | 1.210 | ||
| Minimum pension | 0.926 | ** | 0.941 | ** | 0.862 | ** | 0.880 | ** |
| Months since eligible(log) | 2.627 | ** | 2.716 | ** | 3.182 | ** | 3.058 | ** |
| Unemployment rate | 0.986 | ** | 0.987 | ** | 0.991 | 0.999 | ||
| Constant | 0.000 | ** | 0.000 | ** | 0.000 | ** | 0.000 | ** |
-
(a)
Base category: less than secondary.
-
(b)
**Significant at 5º% level.
-
(c)
*Significant at 10º% level.
-
(d)
Difference with respect to maximum pension, 1,000 € change.
Retirement decision (Probit model).
| Men Coef. | Std. Err. | Women Coef. | Std. Err. | |||
|---|---|---|---|---|---|---|
| Age | 3.594 | 0.144 | ** | 3.554 | 0.183 | ** |
| Age Sq. | −0.027 | 0.001 | ** | −0.027 | 0.001 | ** |
| Secondary studies | 0.041 | 0.021 | * | 0.152 | 0.028 | ** |
| University studies | −0.015 | 0.026 | 0.318 | 0.055 | ** | |
| First year retired | 0.834 | 0.055 | ** | 0.918 | 0.069 | ** |
| Unemployed | −0.937 | 0.364 | ** | |||
| Unemployment benefit | −0.000 | 0.000 | * | |||
| Wage (100 € change) | −0.000 | 0.000 | ** | −0.001 | 0.000 | ** |
| PV | −0.000 | 0.000 | ** | −0.001 | 0.000 | ** |
| Time to max. pension | −0.100 | 0.012 | ** | −0.064 | 0.017 | ** |
| Replacement rate | 0.384 | 0.073 | ** | 0.267 | 0.133 | ** |
| Minimum pension | −0.065 | 0.021 | ** | −0.163 | 0.027 | ** |
| Months since eligible(log) | 0.928 | 0.064 | ** | 0.904 | 0.077 | ** |
| Unemployment rate | −0.019 | 0.005 | ** | −0.016 | 0.007 | ** |
| Constant | −118.203 | 4.682 | ** | −118.817 | 5.989 | ** |
-
(a)
Base category: less than secondary.
-
(b)
**Significant at 5º% level.
-
(c)
*Significant at 10º% level.