Cite as: T. Husby, O. Ivanova, M. Thissen; 2018; Simulating the joint distribution of individuals, households and dwellings in small areas; International Journal of Microsimulation; 11(2); 169–190. doi: 10.34196/ijm.00184
Abstract
This article proposes a sample-based methodology for synthesizing individuals, households and dwellings in small areas, illustrated using a case study of Amsterdam. The method encompasses the following steps: first, individual- and household-level tables are created separately using Iterative Proportional Fitting (IPF). Second, synthetic individuals are allocated into synthetic households using a combination of sorting algorithms and mixed integer programming. As such, the synthetic households are adjusted to accommodate the synthetic individuals, ensuring a consistent joint distribution of individuals, households and dwellings in small areas.
This article contains 10 figures and 11 tables.
Figures
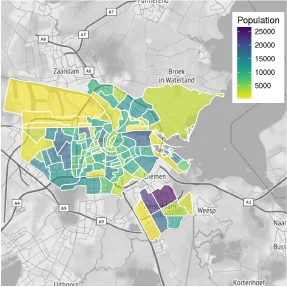
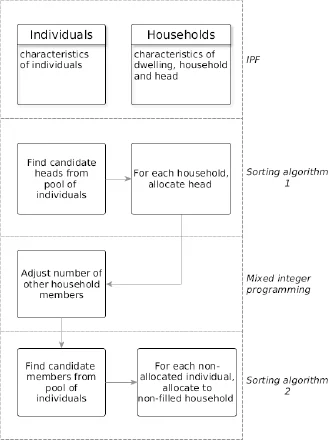
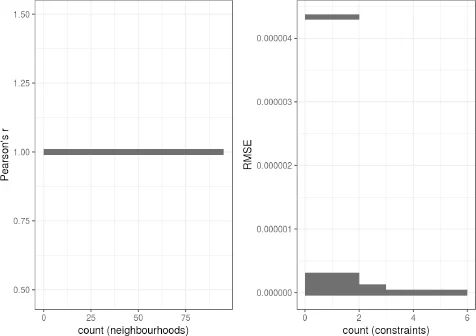
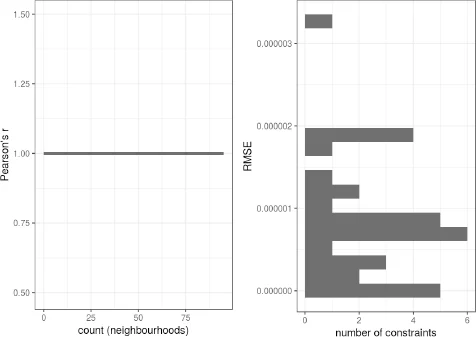
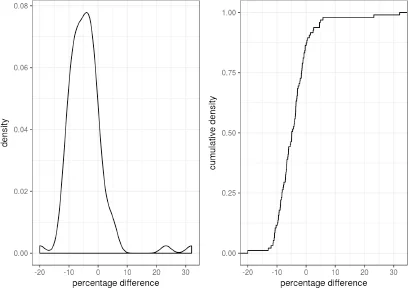
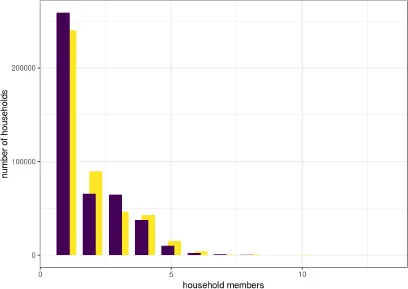
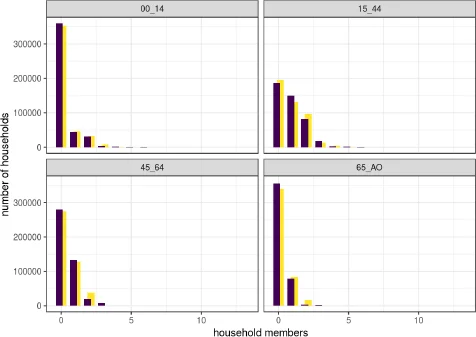
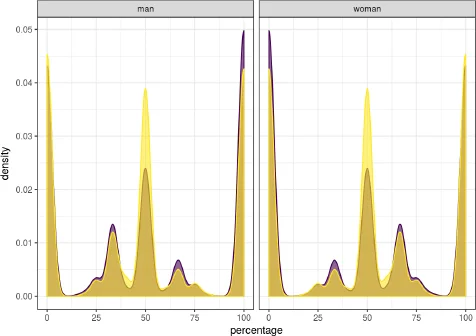
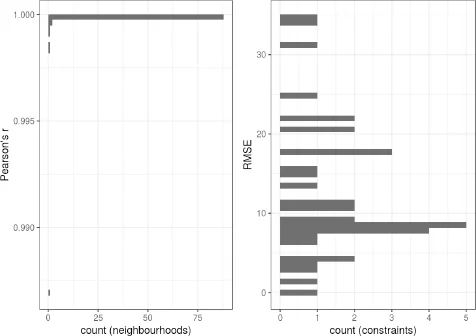
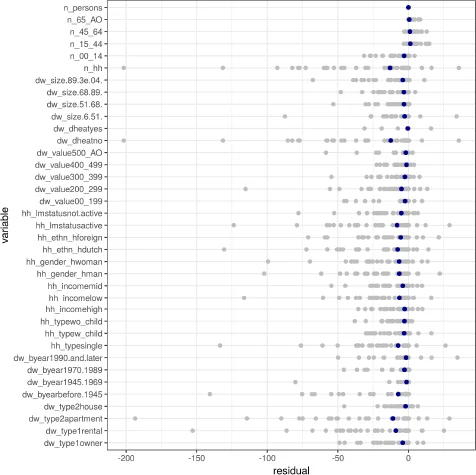
Figure 1. Population in neighbourhoods in Amsterdam.Figure 2. The overall population synthesis methodology.Figure 3. Correlation coefficient and RMSE of the individual-level table.Figure 4. Correlation coefficient and RMSE of the household-level table.Figure 5. Neighbourhood population calculated from the households table relative to population calculated from the person-table.Figure 6. Number of members in the adjusted (purple) and in the unadjusted households (yellow).Figure 7. Number of household members by age in the unadjusted (yellow) and adjusted (purple) households.Figure 8. Percentage members gender in the unadjusted (yellow) and adjusted (purple) households.Figure A.1. Correlation and RMSE for the synthetic population created with IPU.Figure A.2. Residuals by constraints for the synthetic population created with IPU.
Tables
Table 1. Variables from OVIN and their levels.
Variable
Levels
Explanation
ind_lmstatus
active, not-active
labour-market status
ind_ethn
Dutch, foreign
ethnicity
ind_income
high, low, mid
household income
ind_gender
man, woman
gender
ind_age
00_14, 15_44, 45_64, 65_AO
age
Table 2. Household and dwelling characteristics from WOON.
Variable
Levels
Explanation
dw_typei
rental, owner-occupied
dwelling tenure
dw_type2
apartment, house
type of dwelling
dw_byear
before 1945,1945–1969,1970–1989,1990 and later
building year
dw_dheat
no, yes
district heating
dw_size
(6,51], (51,68], (68,89], (89,3e+04]
size (m2)
hh_age_h
15_44, 45_64, 65_AO
age household head
hh_gender_h
man, woman
gender household head
hh_ethn_h
Dutch, foreign
ethnicity household head
hh_income
high, low, mid
household income
hh_lmstatus
active, not-active
labour-market status head
hh_type
single, w_child, wo_child
household type
Table 3. Information about household members from WOON.
Variable
Levels
Explanation
n_00_i4
numeric
members between 0 and 14 years
n_i5_44
numeric
members between 15 and 44 years
n_45_64
numeric
members between 45 and 64 years
n_65_AO
numeric
members 65 years and older
n_persons
numeric
number ofmembers
Table 4. Data sources and their usage.
Source
Variables
OVIN 2010–2016
Survey sample of individuals
WOON 2012 and 2015
Survey sample of households and dwellings
Neighbourhood and District maps 2014
Constraints on individuals, households and dwellings
100x100m statistics
Constraint on cadastral value of dwelling
Dutch Kadaster data
Constraints on dwelling size and building year
Table 5. Five households from the sample seed.
hh 1
hh2
hh 3
hh 4
hh 5
dw_value
oo_199
oo_199
2oo_299
2oo_299
00_199
dw_typei
rental
owner
owner
owner
rental
dw_type2
apartment
house
house
house
apartment
dw_byear
1970–1989
1970–1989
1970–1989
before 1945
1970–1989
dw_dheat
No
no
no
no
no
dw_size
(68,89]
(89,3e+04]
(89,3e+04]
(89,3e+04]
(51,68]
hh_age_h
65_AO
65_AO
45_64
45_64
65_AO
hh_gender_h
Man
man
man
man
woman
hh_ethn_h
dutch
dutch
dutch
dutch
dutch
hh_income
Low
low
mid
high
low
hh_lmstatus
not-active
not-active
active
active
not-active
hh_type
wo_child
wo_child
wo_child
wo_child
single
n_00_14
0
0
0
0
0
n_15_44
0
0
0
0
0
n_45_64
1
0
2
2
0
n_65_AO
1
2
0
0
1
n_persons
2
2
2
2
1
Table 6. Characteristics used to match households and individuals.
Dimension
Levels
Explanation
lmstatus
active, not-active
labour-market status
ethn
Dutch, foreign
ethnicity
gender
man, woman
gender
00_14,15_44, 45_64, 65_AO
age
Algorithm 1. Allocation of household heads.
1: for all households do
2: whiledo
3: for non-allocated individuals with matching characteristics do
4: update alh,c = alh,c + indi,c
5: set wdi,h = 1
6: end for
7: end while
8: end for
Algorithm 2. Allocation of the remaining household members.
1: for non-allocated individuals do
2: whiledo
3: for households with available slots on matching characteristics do
4: set alh,d = alh,d + indi,d
5: set wdi,h = 1
6: end for
7: end while
8: end for
Table 7. Chi-squared test of neighbourhood population.