The distributional impact of VAT reduction for food in Hungary: Results from a Hungarian microsimulation model
- National University of Ireland, Ireland
- University of Canberra, Australia
- Corvinus University of Budapest, Hungary
- Hungarian Academy of Sciences, Hungary
- Article
- Figures and data
- Jump to
Figures
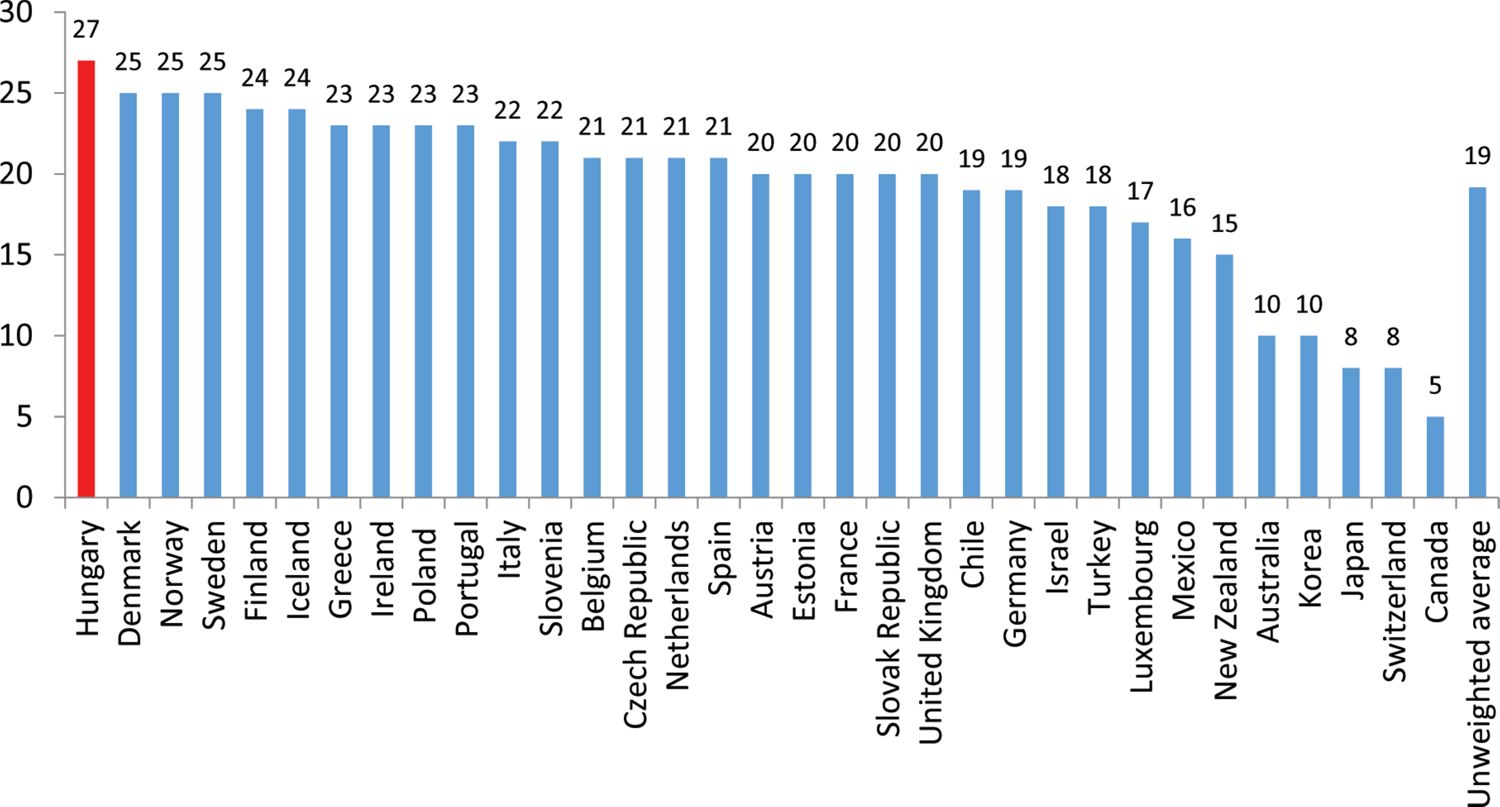
Standard VAT rates in the OECD countries (%).
Source: OECD, 2014.
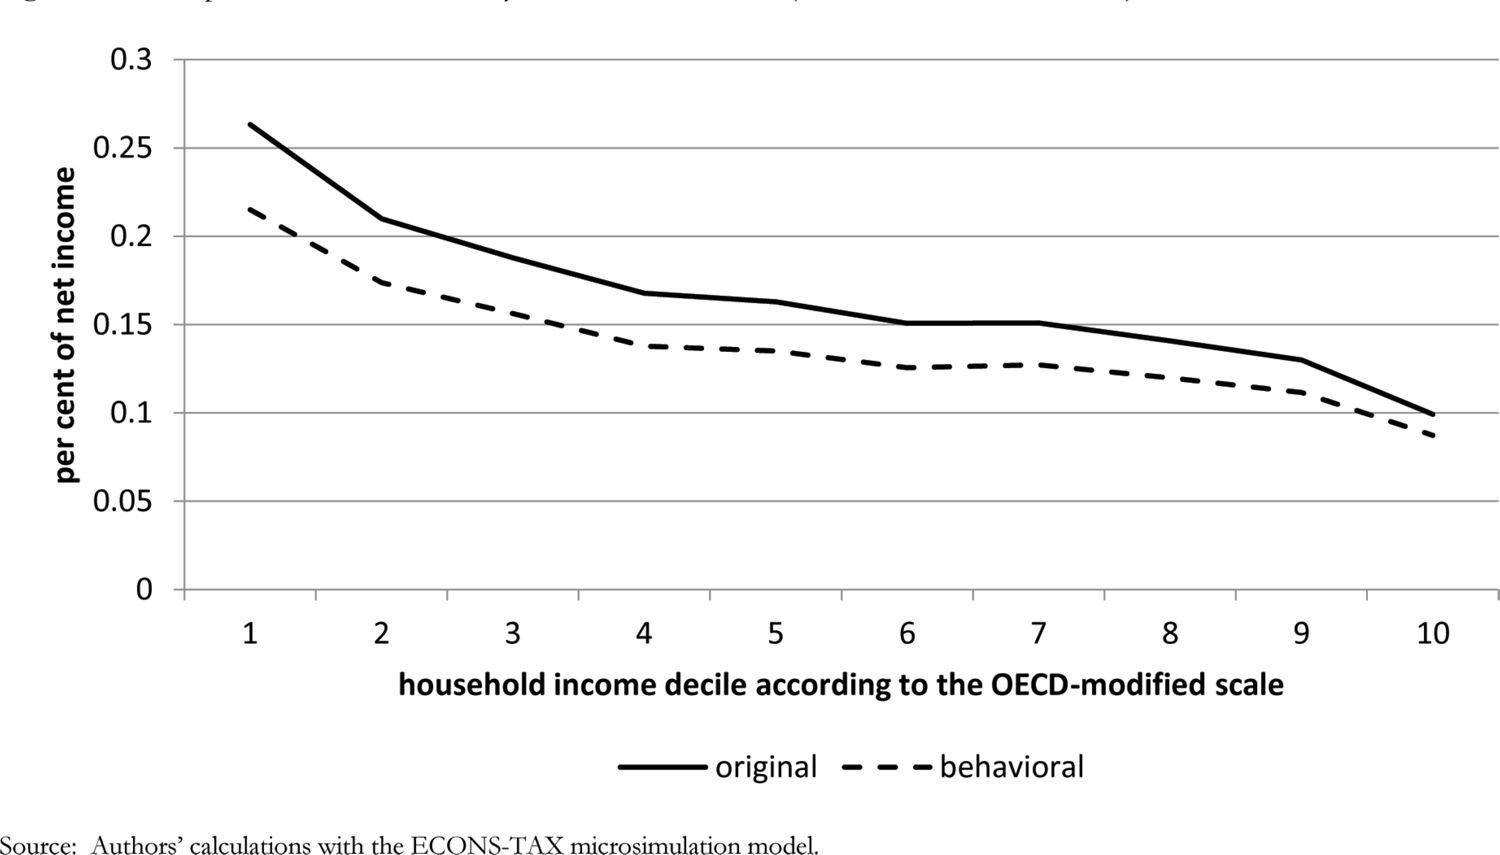
Change in VAT payments as a result of food VAT reduction by household income decile (decile 1 with the lowest income).
Source: Authors’ calculations with the ECONS-TAX microsimulation model.
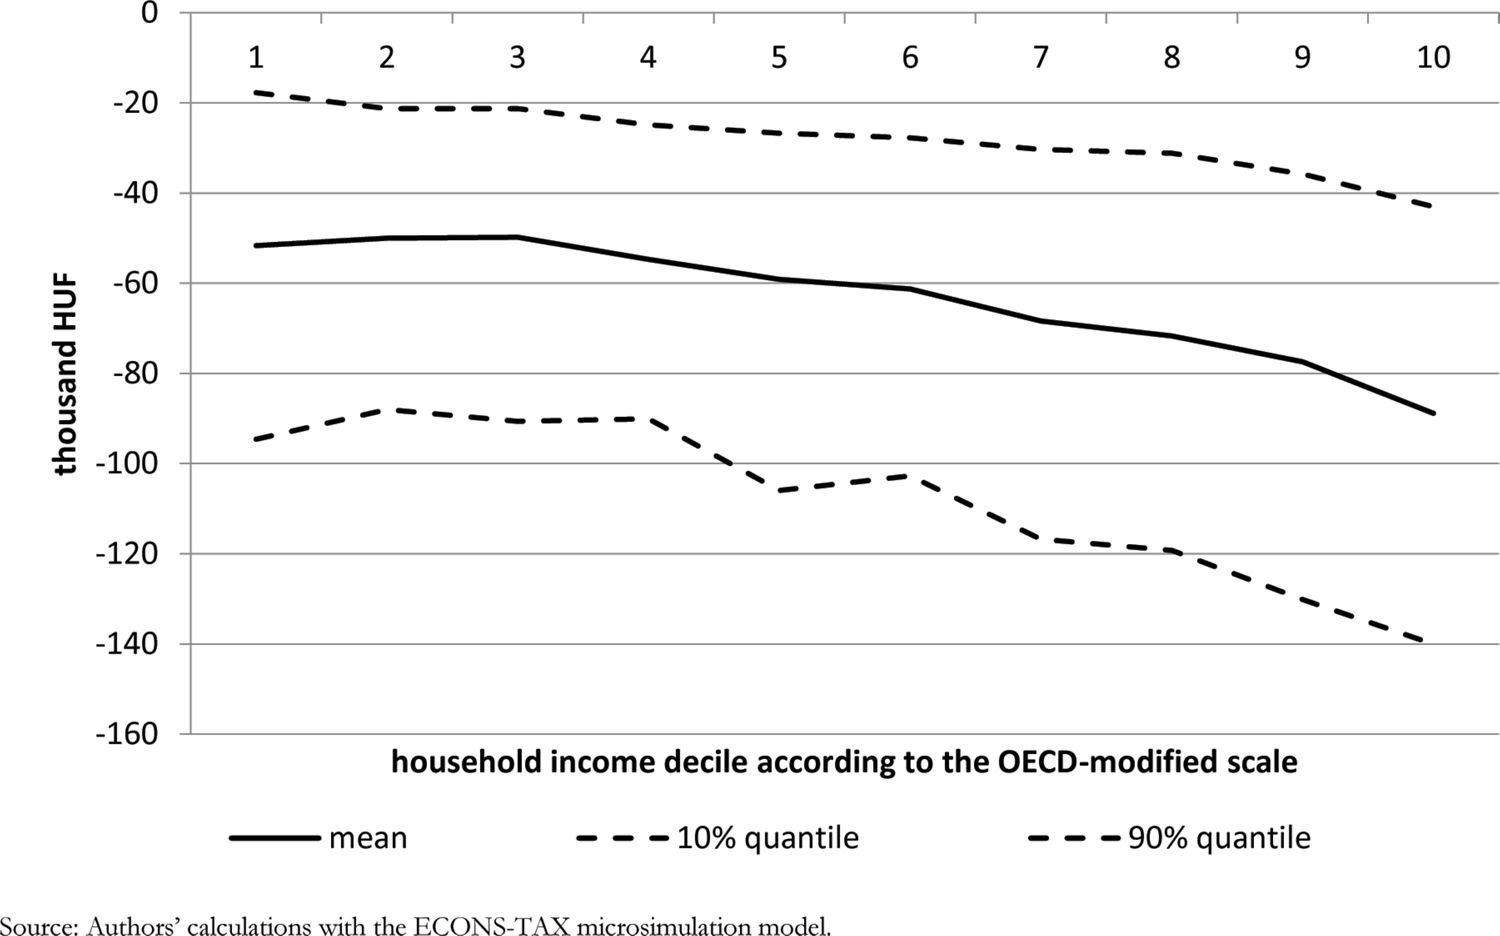
Mean and 10% and 90% quantiles of the change in VAT payments by household income decile (decile 1 with the lowest income).
Source: Authors’ calculations with the ECONS-TAX microsimulation model.
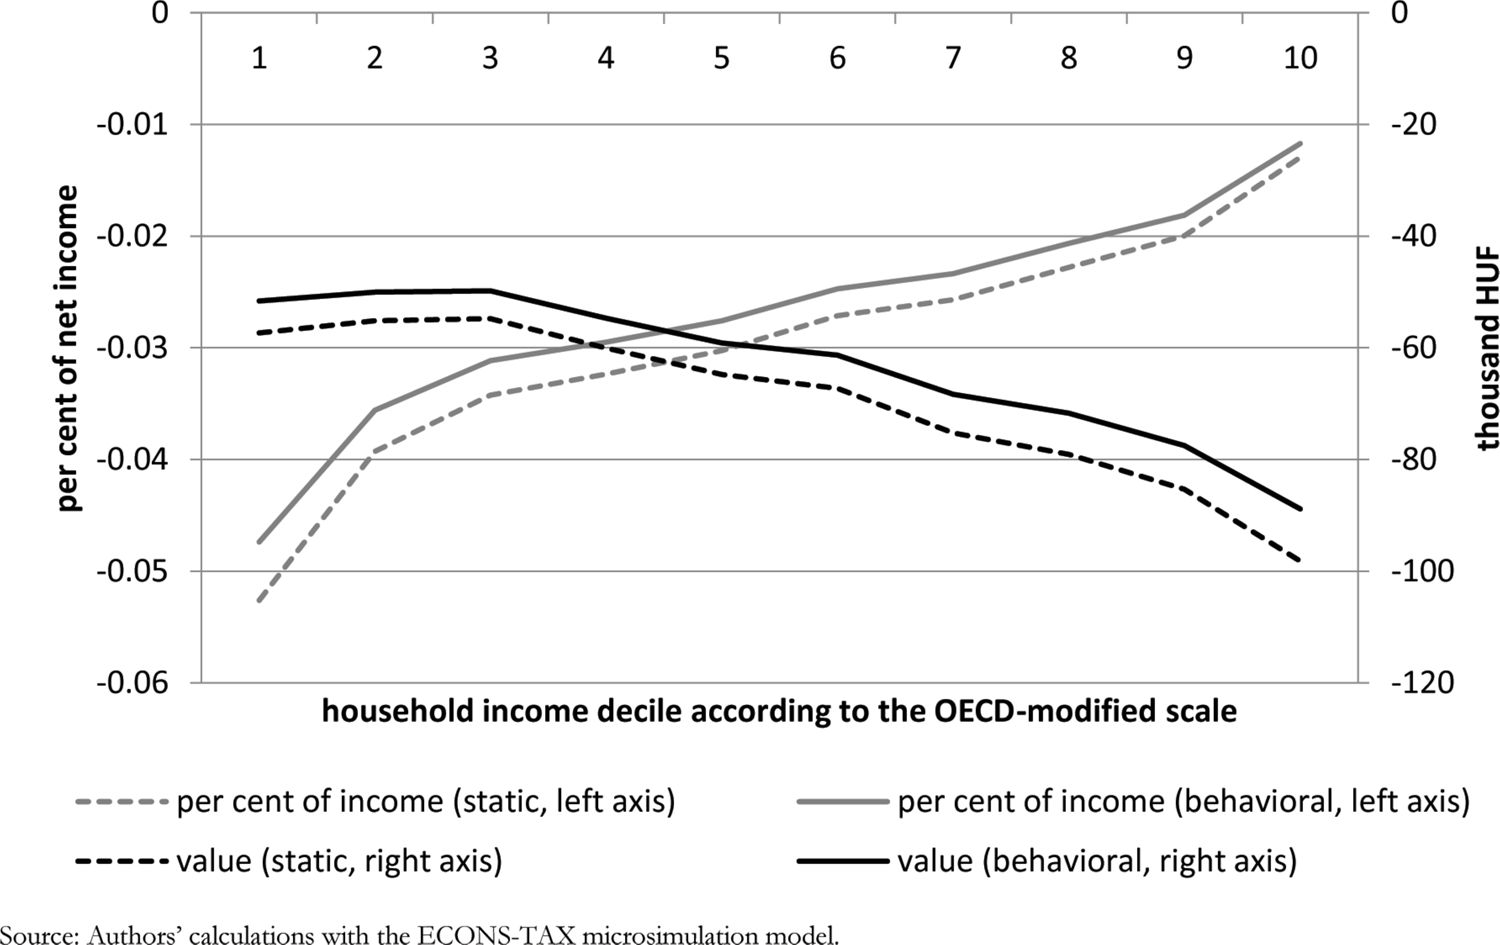
Pre- and post-reform VAT burdens by household income decile (decile 1 with the lowest income).
Source: Authors’ calculations with the ECONS-TAX microsimulation model.

Dynamic labour market module.
Source: Own construction.
Tables
Average product shares, expenditure elasticities and own price elasticities for product categories.
| Expenditure elasticity | Own price elasticity | ||
|---|---|---|---|
| Product share | (ηi) | (ηii) | |
| Food and non-alcoholic beverages | 0.226 | 0.77 | −0.48 |
| Alcoholic beverages | 0.009 | (1.09) | (−0.55) |
| Tobacco | 0.023 | (0.58) | (−0.30) |
| Clothing and footwear | 0.042 | (1.31) | (−0.68) |
| Water, electricity, gas and other fuels | 0.201 | 0.37 | −0.24 |
| Rents | 0.011 | 1.64 | −0.83 |
| Household services | 0.097 | 0.79 | −0.44 |
| Health | 0.055 | 1.02 | −0.53 |
| Private transport | 0.055 | 1.05 | −0.56 |
| Public transport | 0.016 | 1.35 | −0.68 |
| Communications | 0.066 | 0.78 | −0.42 |
| Recreation and culture | 0.047 | 1.30 | −0.67 |
| Education | 0.006 | (1.59) | (−0.80) |
| Restaurants and hotels | 0.030 | (1.69) | (−0.86) |
| Other goods and services | 0.060 | 1.61 | −0.83 |
| Durable goods | 0.056 | (1.79) | (−0.91) |
-
Source: Authors’ calculations based on HKÉF for 2011.
-
Notes: Parentheses indicate product categories for which the expenditure parameter estimates were not significant in the consumption equations (Table B.1 in the Appendix) so they cannot be measured reliably.
A summary of the VAT rate change in the examined scenario.
| Product category | VAT current | VAT in the scenario |
|---|---|---|
| Food (Tier 1) | 18% | 0% |
| Food (Tier 2) | 27% | 5% |
| Other goods (Tier 1) | 18% | 18% |
| Other goods (Tier 2) | 27% | 27% |
-
Source: Operative law on VAT in Hungary.
Changes in real consumption by product categories as a result of the reduction of food VAT rate.
| Product category | Change in real consumption (%) |
|---|---|
| Food and non-alcoholic beverages | 9.0% |
| Alcoholic beverages | 2.7% |
| Tobacco | 2.0% |
| Clothing and footwear | 2.8% |
| Water, electricity, gas and other fuels | 1.4% |
| Rents | 2.8% |
| Household services | 2.1% |
| Health | 2.5% |
| Private transport | 2.2% |
| Public transport | 2.8% |
| Communications | 2.0% |
| Recreation and culture | 2.7% |
| Education | 2.5% |
| Restaurants and hotels | 2.6% |
| Other goods and services | 2.4% |
| Durable consumption goods | 2.8% |
-
Source: Authors’ calculations with the ECONS-TAX microsimulation model.
Changes in VAT payment by decile using different country-level constant Frisch parameters.
| Static scenario | Behavioural scenarios | |||||
|---|---|---|---|---|---|---|
| −1/ξ | 0.25 | 0.4 | 0.5 | 0.6 | 0.75 | |
| ξ | −4.0 | −2.5 | −2.0 | −1.67 | −1.33 | |
| Food price elasticity | −0.32 | −0.41 | −0.48 | −0.55 | −0.65 | |
| Income Decile | Change in VAT payment (thousand HUF) | |||||
| 1 | −57.3 | −50.3 | −51.1 | −51.6 | −52.2 | −53.0 |
| 2 | −55.1 | −48.8 | −49.5 | −50.0 | −50.5 | −51.2 |
| 3 | −54.8 | −48.6 | −49.3 | −49.8 | −50.3 | −51.0 |
| 4 | −60.0 | −53.5 | −54.2 | −54.7 | −55.2 | −56.0 |
| 5 | −64.8 | −57.8 | −58.6 | −59.1 | −59.6 | −60.5 |
| 6 | −67.3 | −59.9 | −60.7 | −61.3 | −61.8 | −62.7 |
| 7 | −75.2 | −66.8 | −67.7 | −68.4 | −69.0 | −70.0 |
| 8 | −79.1 | −70.0 | −71.0 | −71.7 | −72.4 | −73.4 |
| 9 | −85.3 | −75.7 | −76.7 | −77.5 | −78.2 | −79.3 |
| 10 | −98.2 | −86.7 | −88.0 | −88.8 | −89.7 | −91.0 |
| Total | −69.7 | −61.8 | −62.7 | −63.3 | −63.9 | −64.8 |
-
Source: Authors’ calculations with the ECONS-TAX microsimulation model.
Changes in VAT payment by decile using different household-specific Frisch parameters.
| Average value of −1/ξ | 0.5 | 0.5 | 0.5 |
| Income semi-elasticity of −1/ξ | 0.00 | 0.10 | 0.20 |
| Average food price elasticity | −0.48 | −0.48 | −0.48 |
| 5% quantile of food price elasticity | −0.48 | −0.54 | −0.61 |
| 95% quantile of food price elasticity | −0.48 | −0.42 | −0.36 |
| Income Decile | Change in VAT payment (thousand HUF) | ||
| 1 | −51.6 | −52.0 | −51.7 |
| 2 | −50.0 | −49.8 | −49.6 |
| 3 | −49.8 | −49.7 | −49.5 |
| 4 | −54.7 | −54.7 | −54.6 |
| 5 | −59.1 | −59.1 | −59.1 |
| 6 | −61.3 | −61.4 | −61.4 |
| 7 | −68.4 | −68.5 | −68.7 |
| 8 | −71.7 | −72.0 | −72.3 |
| 9 | −77.5 | −77.9 | −78.4 |
| 10 | −88.8 | −89.9 | −90.9 |
| Total | −63.3 | −63.5 | −63.6 |
-
Source: Authors’ calculations with the ECONS-TAX microsimulation.
Parameter estimates of the expenditure share equations.
| Share of product category | Av. of variable | Food and non-alc. beverages | Alcoholic beverages | Tobacco | Clothing and footwear | Water and energy | Rents | Household services | Health |
|---|---|---|---|---|---|---|---|---|---|
| Log expenditure | 14.3 | 0.300*** | −0.0152 | −0.0287 | 0.0562* | −0.255*** | 0.101*** | 0.153*** | 0.0996*** |
| (0.536) | (0.0519) | (0.0135) | (0.0236) | (0.0297) | (0.0536) | (0.0188) | (0.0338) | (0.0342) | |
| Log expenditure squared | 206.0 | −0.0119*** | 0.000552 | 0.000701 | −0.00150 | 0.00513*** | −0.00318*** | −0.00589*** | −0.00340*** |
| (15.4) | (0.00178) | (0.000459) | (0.000803) | (0.00104) | (0.00184) | (0.000640) | (0.00116) | (0.00117) | |
| Household type (baseline = no retired person, no couple, no child in the household) (average = 0.179, standard deviation = 0.383 for baseline variable) | |||||||||
| Retired: no; couple: no; child: yes | 0.032 | 0.0132** | −0.00457*** | −0.00422** | 0.00959*** | 0.0167*** | −0.00896** | 0.00197 | −0.00683*** |
| (0.176) | (0.00603) | (0.000761) | (0.00204) | (0.00283) | (0.00464) | (0.00386) | (0.00364) | (0.00239) | |
| Retired: no; couple: yes; child: no | 0.201 | 0.0338*** | −0.00107 | −1.58e-05 | −0.00124 | 0.0210*** | −0.00662*** | −0.00494*** | 0.00865*** |
| (0.401) | (0.00311) | (0.000731) | (0.00141) | (0.00145) | (0.00245) | (0.00208) | (0.00184) | (0.00156) | |
| Retired: no; couple: yes; child: yes | 0.172 | 0.0198*** | −0.00383*** | −0.00205 | 0.00466* | 0.0261*** | −0.0128*** | −0.00305 | 0.00972*** |
| (0.377) | (0.00509) | (0.000867) | (0.00196) | (0.00243) | (0.00356) | (0.00312) | (0.00263) | (0.00203) | |
| Retired: yes; couple: no; child: no | 0.210 | −0.00967** | −0.00137 | −0.00111 | −0.00346* | 0.00610 | −0.00950*** | −0.00183 | 0.00970*** |
| (0.408) | (0.00461) | (0.000984) | (0.00157) | (0.00179) | (0.00380) | (0.00203) | (0.00298) | (0.00323) | |
| Retired: yes; couple: no; child: yes | 0.00458 | 0.0317** | −0.00624*** | −0.00652 | −0.000390 | 0.0282*** | −0.0159*** | 0.00924 | 0.0269*** |
| (0.0675) | (0.0136) | (0.00157) | (0.00426) | (0.00516) | (0.0105) | (0.00531) | (0.00994) | (0.00670) | |
| Retired: yes; couple: yes; child: no | 0.181 | 0.0159*** | −0.000923 | 0.00106 | −0.00380 | 0.0248*** | −0.0136*** | −0.0116*** | 0.0191*** |
| (0.385) | (0.00609) | (0.00138) | (0.00218) | (0.00269) | (0.00482) | (0.00226) | (0.00373) | (0.00408) | |
| Retired: yes; couple: yes; child: yes | 0.0204 | 0.0111 | −0.00433*** | −0.00115 | −0.000883 | 0.0395*** | −0.0134*** | −0.0132*** | 0.0264*** |
| (0.141) | (0.00817) | (0.00144) | (0.00300) | (0.00376) | (0.00608) | (0.00373) | (0.00458) | (0.00472) | |
| Number of children (0-15 years) | 0.370 | 0.0227*** | −0.000507 | −0.000336 | −0.000577 | 0.00377** | −0.00302** | −0.000199 | −0.00215*** |
| (0.785) | (0.00241) | (0.000315) | (0.000905) | (0.00110) | (0.00154) | (0.00134) | (0.00116) | (0.000810) | |
| Number of retired people | 0.536 | 0.0118*** | 0.000843 | −0.000554 | 0.000522 | 0.00372 | −0.00103 | 0.00754*** | −0.00186 |
| (0.703) | (0.00358) | (0.000794) | (0.00111) | (0.00148) | (0.00277) | (0.00102) | (0.00223) | (0.00251) | |
| Number of earners | 0.938 | 0.000274 | −0.000421* | −0.00128** | 0.00492*** | 0.00700*** | −0.00268*** | 0.000789 | −0.00824*** |
| (0.949) | (0.00136) | (0.000231) | (0.000553) | (0.000605) | (0.00101) | (0.000608) | (0.000731) | (0.000676) | |
| Cigarette smoker in the household | 0.379 | −0.00727*** | 0.00273*** | 0.0594*** | −0.00315*** | −0.00654*** | 0.00252** | −0.00477*** | −0.00592*** |
| (0.485) | (0.00177) | (0.000382) | (0.000786) | (0.000805) | (0.00142) | (0.000987) | (0.00108) | (0.00103) | |
| Car in the household | 0.461 | −0.0335*** | −0.000903** | −0.00437*** | −0.00244*** | 0.000899 | −0.0130*** | −0.0136*** | −0.00825*** |
| (0.498) | (0.00202) | (0.000389) | (0.000705) | (0.000928) | (0.00153) | (0.00114) | (0.00122) | (0.00116) | |
| Household head | |||||||||
| Female | 0.472 | −0.00450** | −0.00449*** | −0.00244*** | −0.00542*** | 0.00663*** | −0.00212** | 0.00607*** | 0.00591*** |
| (0.499) | (0.00190) | (0.000445) | (0.000768) | (0.000893) | (0.00151) | (0.00107) | (0.00115) | (0.00111) | |
| Standardised age (in 10 years) (standardized to 50 years) | 0.483 | 0.00730*** | 0.000656** | −0.000905 | −0.00515*** | 0.00844*** | −0.00389*** | 0.00295*** | 0.00816*** |
| (1.45) | (0.00173) | (0.000330) | (0.000671) | (0.000747) | (0.00134) | (0.00107) | (0.000977) | (0.000889) | |
| Standardized age squared | 2.33 | −0.00308*** | −0.000185* | −0.000984*** | 0.000189 | −0.00269*** | 0.00369*** | 0.000274 | 0.00282*** |
| (2.50) | (0.000544) | (9.53e-05) | (0.000198) | (0.000253) | (0.000418) | (0.000465) | (0.000299) | (0.000278) | |
| Standardized age on the third power | 2.83 | −0.000518* | −0.000123** | 5.58e-05 | 2.76e-06 | −3.97e-05 | −0.000912*** | −0.000161 | 0.000943*** |
| (8.08) | (0.000298) | (5.28e-05) | (0.000104) | (0.000127) | (0.000232) | (0.000219) | (0.000168) | (0.000165) | |
| Level of education of household head (baseline = never attended school) (average = 0.00099, standard deviation = 0.0315 for baseline variable) | |||||||||
| Less than 8 classes in primary school | 0.0392 | −0.0711 | 0.00135 | −0.00153 | 0.00735* | 0.0719*** | −0.0248 | 0.0320* | −0.0280 |
| (0.194) | (0.0466) | (0.00401) | (0.0150) | (0.00400) | (0.0264) | (0.0192) | (0.0169) | (0.0266) | |
| 8 to 10 years of primary school | 0.198 | −0.0864* | −7.37e-05 | −0.00123 | 0.00388 | 0.0680*** | −0.0253 | 0.0395** | −0.0216 |
| (0.399) | (0.0463) | (0.00392) | (0.0150) | (0.00371) | (0.0261) | (0.0191) | (0.0166) | (0.0263) | |
| Lower secondary education | 0.321 | −0.110** | 0.000610 | −0.00363 | 0.000977 | 0.0688*** | −0.0238 | 0.0520*** | −0.0220 |
| (0.467) | (0.0462) | (0.00392) | (0.0150) | (0.00370) | (0.0261) | (0.0191) | (0.0166) | (0.0263) | |
| Secondary education | 0.133 | −0.115** | 0.00114 | −0.00468 | 0.00356 | 0.0597** | −0.0251 | 0.0569*** | −0.0282 |
| (0.340) | (0.0463) | (0.00393) | (0.0150) | (0.00377) | (0.0261) | (0.0191) | (0.0167) | (0.0263) | |
| Upper secondary education | 0.0778 | −0.118** | 0.000149 | −0.00606 | 0.00106 | 0.0598** | −0.0210 | 0.0524*** | −0.0281 |
| (0.268) | (0.0463) | (0.00394) | (0.0150) | (0.00384) | (0.0262) | (0.0192) | (0.0167) | (0.0264) | |
| Post-secondary non-tertiary education | 0.0408 | −0.117** | 0.00307 | −0.00555 | −0.00266 | 0.0501* | −0.0217 | 0.0549*** | −0.0215 |
| (0.198) | (0.0464) | (0.00399) | (0.0150) | (0.00399) | (0.0262) | (0.0193) | (0.0168) | (0.0265) | |
| Adult school | 0.0122 | −0.124*** | −0.000219 | −0.00888 | 0.00762 | 0.0564** | −0.0294 | 0.0619*** | −0.0222 |
| (0.110) | (0.0466) | (0.00404) | (0.0151) | (0.00544) | (0.0266) | (0.0194) | (0.0173) | (0.0266) | |
| College | 0.101 | −0.124*** | 0.00160 | −0.00502 | 0.00719* | 0.0535** | −0.0238 | 0.0542*** | −0.0245 |
| (0.301) | (0.0463) | (0.00396) | (0.0150) | (0.00388) | (0.0261) | (0.0192) | (0.0167) | (0.0264) | |
| University | 0.0713 | −0.128*** | 0.00187 | −0.00331 | 0.0136*** | 0.0489* | −0.0252 | 0.0542*** | −0.0235 |
| (0.257) | (0.0463) | (0.00396) | (0.0150) | (0.00410) | (0.0261) | (0.0192) | (0.0167) | (0.0264) | |
| PhD | 0.00448 | −0.127*** | 0.000706 | −0.00288 | 0.0154** | 0.0441 | −0.0321* | 0.0547*** | −0.0410 |
| (0.0668) | (0.0472) | (0.00446) | (0.0157) | (0.00752) | (0.0271) | (0.0195) | (0.0177) | (0.0269) | |
| Constant | −1.516*** | 0.116 | 0.280 | −0.457** | 2.714*** | −0.739*** | −0.923*** | −0.659*** | |
| (0.382) | (0.0985) | (0.173) | (0.212) | (0.391) | (0.139) | (0.247) | (0.251) | ||
| Number of observations | 10,041 | 10,041 | 10,041 | 10,041 | 10,041 | 10,041 | 10,041 | 10,041 | |
| R-squared | 0.200 | 0.040 | 0.505 | 0.188 | 0.428 | 0.088 | 0.108 | 0.299 | |
| Share of product category | Private transport | Public transport | Communication | Recreation and culture | Education | Restaurants and hotels | Other | Durable goods |
|---|---|---|---|---|---|---|---|---|
| Log expenditure | 0.205*** | 0.160*** | 0.248*** | 0.0933*** | −0.00532 | 0.0290 | −1.174*** | 0.0336 |
| (0.0287) | (0.0172) | (0.0291) | (0.0325) | (0.0127) | (0.0479) | (0.134) | (0.0974) | |
| Log expenditure squared | −0.00703*** | −0.00534*** | −0.00906*** | −0.00268** | 0.000331 | −7.86e-05 | 0.0423*** | 0.00102 |
| (0.00101) | (0.000590) | (0.00101) | (0.00114) | (0.000450) | (0.00168) | (0.00475) | (0.00343) | |
| Household type (baseline = no retired person, no couple, no child in the household) | ||||||||
| Retired: no; couple: no; child: yes | −0.00637** | −0.00250 | 0.00568** | 0.00121 | 0.00264* | −0.0120*** | 0.00367 | −0.00914 |
| (0.00293) | (0.00232) | (0.00278) | (0.00260) | (0.00135) | (0.00363) | (0.00489) | (0.00573) | |
| Retired: no; couple: yes; child: no | −0.00254 | −0.00435*** | 0.00140 | −0.00566*** | 0.00113 | −0.0206*** | −0.00556** | −0.0135*** |
| (0.00178) | (0.00134) | (0.00131) | (0.00145) | (0.000893) | (0.00196) | (0.00234) | (0.00309) | |
| Retired: no; couple: yes; child: yes | −0.00556** | −0.00637*** | 0.00308 | −0.00733*** | −0.000267 | −0.0214*** | 0.00179 | −0.00253 |
| (0.00279) | (0.00191) | (0.00210) | (0.00218) | (0.00105) | (0.00274) | (0.00394) | (0.00486) | |
| Retired: yes; couple: no; child: no | 0.00377 | −0.00564*** | 0.00249 | 6.94e-06 | −0.00136 | −0.00132 | 0.00869** | 0.00450 |
| (0.00248) | (0.00154) | (0.00187) | (0.00205) | (0.000961) | (0.00276) | (0.00362) | (0.00473) | |
| Retired: yes; couple: no; child: yes | −0.00566 | 1.02e-05 | −0.00100 | −0.00969** | −0.00150 | −0.0207*** | −0.0151*** | −0.0133 |
| (0.00577) | (0.00589) | (0.00484) | (0.00442) | (0.00151) | (0.00482) | (0.00572) | (0.0116) | |
| Retired: yes; couple: yes; child: no | 0.00645* | −0.00342* | 0.00627** | −0.00929*** | −0.000900 | −0.0170*** | 0.00479 | −0.0179*** |
| (0.00371) | (0.00203) | (0.00259) | (0.00275) | (0.00136) | (0.00356) | (0.00487) | (0.00639) | |
| Retired: yes; couple: yes; child: yes | −0.000977 | −0.00413 | 0.00787** | −0.0109*** | −0.000602 | −0.0222*** | −0.00128 | −0.0118 |
| (0.00488) | (0.00279) | (0.00323) | (0.00346) | (0.00135) | (0.00399) | (0.00630) | (0.00805) | |
| Number of children (0-15 years) | −0.00125 | −0.00240*** | −0.00422*** | 9.84e-05 | 0.000503 | −0.00241** | −0.00312* | −0.00692*** |
| (0.00119) | (0.000718) | (0.000882) | (0.000831) | (0.000407) | (0.000985) | (0.00165) | (0.00210) | |
| Number of retired people | −0.00486** | −0.00183* | −0.000995 | 0.00297* | −0.000876 | −0.00692*** | −0.00490* | −0.00358 |
| (0.00206) | (0.000972) | (0.00143) | (0.00158) | (0.000622) | (0.00187) | (0.00265) | (0.00364) | |
| Number of earners | 0.00131* | 0.00497*** | 0.00656*** | 0.000945* | 0.000467 | 0.00248*** | −0.00628*** | −0.0108*** |
| (0.000758) | (0.000539) | (0.000554) | (0.000551) | (0.000347) | (0.000722) | (0.00117) | (0.00135) | |
| Cigarette smoker in the household | −0.00381*** | −0.00174** | −0.00223*** | −0.00738*** | −0.000259 | −0.00743*** | −0.00777*** | −0.00634*** |
| (0.000996) | (0.000689) | (0.000744) | (0.000811) | (0.000432) | (0.00108) | (0.00141) | (0.00181) | |
| Car in the household | 0.0973*** | −0.0140*** | 0.00187** | −0.00558*** | −0.000587 | −0.0104*** | 0.00432** | 0.00225 |
| (0.00128) | (0.000807) | (0.000826) | (0.000954) | (0.000460) | (0.00122) | (0.00170) | (0.00193) | |
| Household head | ||||||||
| Female | −0.00601*** | 0.00161** | 0.00184** | −0.000424 | 0.00152*** | −0.00348*** | 0.00418*** | 0.00111 |
| (0.00110) | (0.000715) | (0.000789) | (0.000893) | (0.000483) | (0.00123) | (0.00149) | (0.00197) | |
| Standardised age (in 10 years) | −0.000454 | −0.000943 | −0.00218*** | −0.00385*** | −0.00106*** | −0.00693*** | −0.00159 | −0.000551 |
| (0.000947) | (0.000693) | (0.000719) | (0.000827) | (0.000393) | (0.00108) | (0.00126) | (0.00170) | |
| Standardized age squared | −0.000257 | −0.000864*** | −0.00118*** | 0.000533** | −0.000415*** | 0.00234*** | −0.000342 | 0.000142 |
| (0.000277) | (0.000215) | (0.000215) | (0.000258) | (0.000148) | (0.000341) | (0.000380) | (0.000497) | |
| Standardized age on the third power | −8.22e-05 | −0.000176 | 0.000289** | 9.84e-05 | 0.000122* | 0.000427** | 4.33e-05 | 2.95e-05 |
| (0.000150) | (0.000109) | (0.000115) | (0.000135) | (7.10e-05) | (0.000180) | (0.000208) | (0.000272) | |
| Level of education of household head (baseline = never attended school) | ||||||||
| Less than 8 classes in primary school | −0.0160 | 0.00407 | 0.0196* | −0.000814 | 0.000465 | 0.00227 | 0.00660 | −0.00341 |
| (0.0147) | (0.00431) | (0.0115) | (0.00621) | (0.00155) | (0.00401) | (0.0239) | (0.0143) | |
| 8 to 10 years of primary school | −0.0198 | 0.00253 | 0.0226** | 0.00440 | −2.15e-05 | 0.00453 | 0.00399 | 0.00492 |
| (0.0146) | (0.00425) | (0.0114) | (0.00605) | (0.00155) | (0.00328) | (0.0237) | (0.0137) | |
| Lower secondary education | −0.0171 | 0.00393 | 0.0315*** | 0.00978 | −0.000305 | 0.00866*** | 0.00651 | −0.00581 |
| (0.0147) | (0.00426) | (0.0114) | (0.00606) | (0.00157) | (0.00334) | (0.0237) | (0.0137) | |
| Secondary education | −0.0174 | 0.00800* | 0.0362*** | 0.0188*** | 0.000708 | 0.0157*** | 0.00475 | −0.0148 |
| (0.0147) | (0.00432) | (0.0114) | (0.00614) | (0.00164) | (0.00355) | (0.0238) | (0.0138) | |
| Upper secondary education | −0.0196 | 0.00689 | 0.0387*** | 0.0217*** | 0.00283 | 0.0171*** | 0.00464 | −0.0129 |
| (0.0147) | (0.00439) | (0.0115) | (0.00622) | (0.00175) | (0.00375) | (0.0238) | (0.0140) | |
| Post-secondary non-tertiary education | −0.0195 | 0.00688 | 0.0366*** | 0.0204*** | −0.000173 | 0.0174*** | 0.00389 | −0.00555 |
| (0.0149) | (0.00446) | (0.0115) | (0.00641) | (0.00179) | (0.00431) | (0.0239) | (0.0143) | |
| Adult school | −0.0136 | 0.00769 | 0.0406*** | 0.0228*** | 0.00171 | 0.0148** | −0.000832 | −0.0146 |
| (0.0152) | (0.00500) | (0.0118) | (0.00721) | (0.00258) | (0.00596) | (0.0243) | (0.0155) | |
| College | −0.0171 | 0.00703 | 0.0384*** | 0.0286*** | 0.00160 | 0.0214*** | 0.000975 | −0.0199 |
| (0.0147) | (0.00437) | (0.0114) | (0.00624) | (0.00180) | (0.00375) | (0.0238) | (0.0139) | |
| University | −0.0179 | 0.00932** | 0.0401*** | 0.0453*** | 0.00153 | 0.0265*** | −0.0119 | −0.0320** |
| (0.0148) | (0.00442) | (0.0115) | (0.00648) | (0.00183) | (0.00422) | (0.0240) | (0.0141) | |
| PhD | −0.00759 | 0.0141* | 0.0399*** | 0.0438*** | −0.00240 | 0.0423*** | −0.00610 | −0.0357* |
| (0.0169) | (0.00737) | (0.0123) | (0.0100) | (0.00265) | (0.00957) | (0.0268) | (0.0184) | |
| Constant | −1.455*** | −1.172*** | −1.668*** | −0.747*** | 0.0141 | −0.362 | 8.177*** | −0.602 |
| (0.203) | (0.125) | (0.210) | (0.231) | (0.0901) | (0.341) | (0.946) | (0.692) | |
| Number of observations | 10,041 | 10,041 | 10,041 | 10,041 | 10,041 | 10,041 | 10,041 | 10,041 |
| R-squared | 0.572 | 0.116 | 0.094 | 0.182 | 0.051 | 0.144 | 0.166 | 0.086 |
-
Source: Authors’ calculations based on HKÉF 2011. Heteroscedasticity-robust standard errors are displayed in parentheses.
-
(*)
Significance levels: 10%
-
(**)
Significance levels: 5%
-
(***)
Significance levels: 1%
Expenditure elasticities by household type.
| Household type | Total | ||||||||
|---|---|---|---|---|---|---|---|---|---|
| Retired | no | no | no | no | yes | yes | yes | yes | |
| Couple | no | no | yes | yes | no | no | yes | yes | |
| Child | no | yes | no | yes | no | yes | no | yes | |
| Food and non-alc. beverages | 0.77 | 0.82 | 0.74 | 0.75 | 0.82 | 0.83 | 0.77 | 0.74 | 0.77 |
| Alcoholic beverages | 1.06 | 1.17 | 1.09 | 1.17 | 1.06 | 1.30 | 1.08 | 1.16 | 1.09 |
| Tobacco | 0.65 | 0.62 | 0.63 | 0.60 | 0.47 | 0.75 | 0.54 | 0.71 | 0.58 |
| Clothing and footwear | 1.27 | 1.24 | 1.22 | 1.19 | 1.56 | 1.28 | 1.32 | 1.22 | 1.31 |
| Water and energy | 0.35 | 0.41 | 0.34 | 0.31 | 0.45 | 0.44 | 0.39 | 0.38 | 0.37 |
| Rents | 1.29 | 1.56 | 1.56 | 1.75 | 1.80 | 1.55 | 1.80 | 1.80 | 1.64 |
| Household services | 0.83 | 0.84 | 0.74 | 0.73 | 0.87 | 0.85 | 0.78 | 0.71 | 0.79 |
| Health | 1.07 | 1.10 | 0.98 | 0.98 | 1.04 | 1.02 | 1.00 | 0.96 | 1.02 |
| Private transport | 1.07 | 1.08 | 0.98 | 0.97 | 1.21 | 1.06 | 0.99 | 0.95 | 1.05 |
| Public transport | 1.30 | 1.30 | 1.12 | 1.15 | 1.80 | 1.28 | 1.36 | 1.07 | 1.35 |
| Communications | 0.84 | 0.83 | 0.75 | 0.69 | 0.86 | 0.79 | 0.74 | 0.67 | 0.78 |
| Recreation and culture | 1.25 | 1.27 | 1.25 | 1.25 | 1.43 | 1.32 | 1.30 | 1.33 | 1.30 |
| Education | 1.47 | 1.30 | 1.44 | 1.43 | 1.80 | 1.80 | 1.80 | 1.64 | 1.59 |
| Restaurants and hotels | 1.51 | 1.59 | 1.67 | 1.66 | 1.80 | 1.80 | 1.80 | 1.80 | 1.69 |
| Other goods and services | 1.61 | 1.66 | 1.80 | 1.80 | 1.19 | 1.80 | 1.68 | 1.80 | 1.61 |
| Durable goods | 1.80 | 1.80 | 1.80 | 1.75 | 1.80 | 1.80 | 1.80 | 1.80 | 1.79 |
-
Source: Authors’ calculations based on HKÉF for year 2011.
Price elasticities by household type.
| Household type | Total | ||||||||
|---|---|---|---|---|---|---|---|---|---|
| Retired | no | no | no | no | yes | yes | yes | yes | |
| Couple | no | no | yes | yes | no | no | yes | yes | |
| Child | no | yes | no | yes | no | yes | no | yes | |
| Food and non-alc. beverages | −0.47 | −0.52 | −0.46 | −0.47 | −0.51 | −0.54 | −0.48 | −0.46 | −0.48 |
| Alcoholic beverages | −0.53 | −0.59 | −0.55 | −0.59 | −0.53 | −0.65 | −0.55 | −0.58 | −0.55 |
| Tobacco | −0.34 | −0.32 | −0.32 | −0.31 | −0.24 | −0.39 | −0.28 | −0.37 | −0.30 |
| Clothing and footwear | −0.66 | −0.65 | −0.63 | −0.63 | −0.79 | −0.66 | −0.68 | −0.64 | −0.68 |
| Water and energy | −0.22 | −0.26 | −0.21 | −0.19 | −0.30 | −0.28 | −0.25 | −0.24 | −0.24 |
| Rents | −0.66 | −0.79 | −0.78 | −0.88 | −0.90 | −0.78 | −0.90 | −0.90 | −0.83 |
| Household services | −0.46 | −0.47 | −0.41 | −0.40 | −0.48 | −0.48 | −0.43 | −0.39 | −0.44 |
| Health | −0.55 | −0.56 | −0.51 | −0.50 | −0.56 | −0.54 | −0.54 | −0.50 | −0.53 |
| Private transport | −0.56 | −0.56 | −0.53 | −0.53 | −0.62 | −0.55 | −0.54 | −0.52 | −0.56 |
| Public transport | −0.66 | −0.66 | −0.57 | −0.58 | −0.90 | −0.65 | −0.68 | −0.54 | −0.68 |
| Communications | −0.46 | −0.45 | −0.41 | −0.38 | −0.46 | −0.43 | −0.40 | −0.37 | −0.42 |
| Recreation and culture | −0.66 | −0.66 | −0.65 | −0.65 | −0.73 | −0.68 | −0.67 | −0.68 | −0.67 |
| Education | −0.74 | −0.66 | −0.73 | −0.72 | −0.90 | −0.90 | −0.90 | −0.82 | −0.80 |
| Restaurants and hotels | −0.77 | −0.81 | −0.85 | −0.84 | −0.91 | −0.90 | −0.90 | −0.90 | −0.86 |
| Other goods and services | −0.82 | −0.85 | −0.91 | −0.92 | −0.65 | −0.91 | −0.87 | −0.92 | −0.83 |
| Durable goods | −0.91 | −0.91 | −0.91 | −0.89 | −0.91 | −0.91 | −0.91 | −0.91 | −0.91 |
-
Source: Authors’ calculations based on HKÉF for year 2011.
Changes in VAT payments by household income decile and household type (thousand HUF).
| Income decile | Household type | Total | ||||||||
|---|---|---|---|---|---|---|---|---|---|---|
| Retired | no | no | no | no | yes | yes | yes | yes | ||
| Couple | no | no | yes | yes | no | no | yes | yes | ||
| Child | no | yes | no | yes | no | yes | no | yes | ||
| 1 | −32.7 | −56.8 | −53.9 | −73.5 | −31.1 | −69.7 | −60.7 | −77.1 | −51.6 | |
| 2 | −35.9 | −56.3 | −59.4 | −66.4 | −38.7 | −43.4 | −55.9 | −61.9 | −50.0 | |
| 3 | −47.7 | −51.0 | −58.5 | −69.8 | −37.3 | −76.2 | −50.2 | −91.6 | −49.8 | |
| 4 | −46.6 | −55.9 | −65.6 | −76.1 | −40.0 | −77.5 | −55.6 | −82.3 | −54.7 | |
| 5 | −46.8 | −62.4 | −64.5 | −73.2 | −46.7 | −60.0 | −65.0 | −65.4 | −59.1 | |
| 6 | −44.3 | −57.2 | −70.8 | −75.5 | −45.1 | −98.1 | −63.9 | −85.9 | −61.3 | |
| 7 | −54.2 | −54.6 | −73.8 | −79.3 | −51.5 | −77.1 | −70.5 | −93.4 | −68.4 | |
| 8 | −51.3 | −68.3 | −76.6 | −78.3 | −57.9 | −71.5 | −77.6 | −77.3 | −71.7 | |
| 9 | −50.5 | −83.5 | −82.1 | −85.9 | −59.1 | −73.7 | −83.3 | −119.8 | −77.5 | |
| 10 | −64.8 | −78.3 | −95.6 | −94.6 | −69.0 | −103.0 | −91.4 | −118.0 | −88.8 | |
| Total | −45.7 | −59.0 | −72.8 | −78.0 | −44.1 | −73.1 | −69.8 | −87.7 | −63.3 | |
-
Source: Authors’ calculations based on HKÉF for year 2011. Household income decile is defined according to the OECD-modified scale.