Quantifying the impacts of expanding social protection on efficiency and equity: Evidence from a behavioral microsimulation model for Ghana
- Institute of Statistical, Social and Economic Research (ISSER) University of Ghana, Ghana
- University of Helsinki and VATT Institute for Economic Research, Finland
- UNU-WIDER, Finland
- Article
- Figures and data
- Jump to
Figures

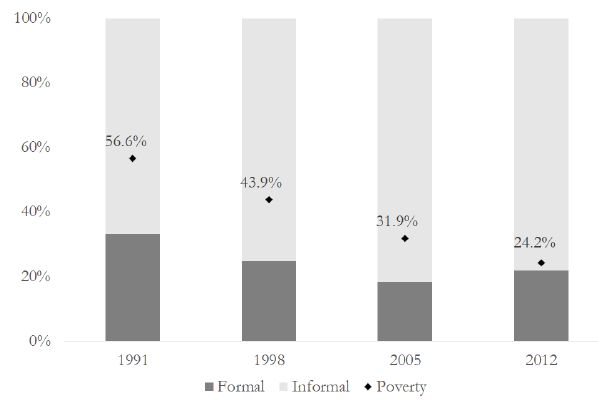
Share of formal sector workers out of all employed and self-employed (15 years or older).

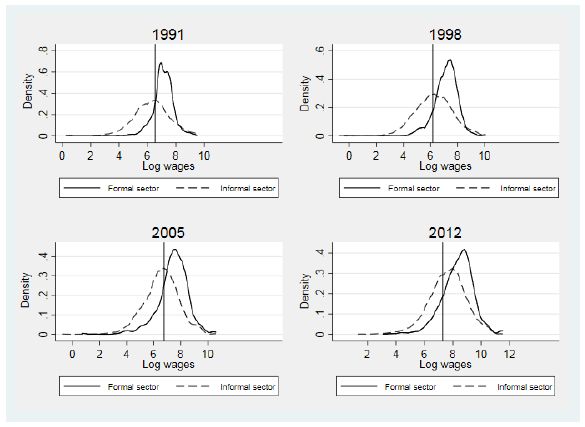
Wage distribution of formal and informal workers across time.
Tables
Summary statistics of persons with non-missing labour or self-employment income data by formality status in GLSS 6.
| Informal | Formal | Total | |
|---|---|---|---|
| Male | 0.449 | 0.659 | 0.477 |
| (0.497) | (0.474) | (0.499) | |
| Age | 37.46 | 38.51 | 37.61 |
| (15.41) | (12.93) | (15.10) | |
| No education | 0.283 | 0.0769 | 0.255 |
| (0.450) | (0.266) | (0.436) | |
| Primary education | 0.262 | 0.0949 | 0.240 |
| (0.440) | (0.293) | (0.427) | |
| Secondary education or higher | 0.455 | 0.828 | 0.506 |
| (0.498) | (0.377) | (0.500) | |
| Household size | 5.331 | 4.230 | 5.182 |
| (3.178) | (2.659) | (3.135) | |
| Farmer | 0.279 | 0.123 | 0.258 |
| (0.449) | (0.328) | (0.438) | |
| Self-employed | 0.298 | 0.000 | 0.258 |
| (0.458) | (0.000) | (0.437) | |
| Employee | 0.148 | 0.813 | 0.238 |
| (0.355) | (0.390) | (0.426) | |
| Agricultural sector | 0.500 | 0.128 | 0.449 |
| (0.500) | (0.334) | (0.497) | |
| Manufacturing sector | 0.150 | 0.172 | 0.153 |
| (0.357) | (0.377) | (0.360) | |
| Service sector | 0.350 | 0.700 | 0.397 |
| (0.477) | (0.458) | (0.489) | |
| Public sector worker | 0.000 | 0.417 | 0.0567 |
| (0.000) | (0.493) | (0.231) | |
| Urban | 0.442 | 0.758 | 0.485 |
| (0.497) | (0.428) | (0.500) | |
| Gross annual income | 2,820.7 | 8,158.1 | 3,546.5 |
| (13,237.5) | (27,022.4) | (15,938.1) | |
| Net annual income | 2,820.7 | 7,183.0 | 3,413.9 |
| (13,237.5) | (21,599.0) | (14,733.0) | |
| Observations | 28,765 | 3,598 | 32,363 |
-
Source: Authors’ calculations based on GLSS data.
-
Notes: Standard errors in parentheses.
Elasticity of the share of formal work with respect to the change in the net pay between formal and informal work.
| No controls | All controls | All controls, above minimum wage | |
|---|---|---|---|
| Elasticity | 0.265** | 0.081 | 0.106 |
| Std error | 0.106 | 0.052 | 0.064 |
| Number of cells | 101 | 101 | 94 |
-
Source: Authors’ calculations based on GLSS data.
-
Notes: Linear probability regression results with the share of formal work as the dependent variable. The key regressor is the difference between the log of net pay in the state of formal work versus the log of net pay in the state of informal work. The model in Column 1 with no controls, the model in Column 2 with a full set of group and time dummies (groups formed based on age, sex, and education), and the model in Column 3 with the wage restricted to lie above the legal minimum wage. Instead of the regression coefficient, an elasticity estimate is shown. Standard errors calculated with the delta method.
-
*
indicates significance at the 10% level and *** at the 1 per cent level.
Simulation results of expanding social protection on poverty and inequality.
| Status quo | Reform A: Stand-alone extension of social protection | Reform B: Revenue-neutral reform | Revenue-neutral reform with behavioural impacts | |
|---|---|---|---|---|
| (I) | (II) | (III) | (IV) | |
| FGT(0) | ||||
| All | 24.9 | 24.1 | 24.3 | 24.4 |
| Male-headed households | 26.6 | 26.0 | 26.2 | 26.3 |
| Female-headed households | 19.7 | 18.4 | 18.5 | 18.6 |
| Households with children | 27.4 | 26.7 | 26.9 | 27.0 |
| Households with older persons | 33.7 | 29.3 | 29.3 | 29.4 |
| FGT(1) | ||||
| All | 8.1 | 6.7 | 6.8 | 6.8 |
| Male-headed households | 8.8 | 7.3 | 7.5 | 7.5 |
| Female-headed households | 6.0 | 4.6 | 4.7 | 4.7 |
| Households with children | 8.9 | 7.4 | 7.5 | 7.5 |
| Households with older persons | 11.0 | 7.8 | 7.9 | 7.9 |
| Gini | 41.7 | 40.8 | 40.8 | 40.8 |
| P80/P20 | 3.53 | 3.46 | 3.46 | 3.46 |
-
Source: Authors’ calculations based on GHAMOD v1.0.
-
Notes: Poverty rates measured using the consumption-based absolute poverty line of GHS 1,314 per adult equivalent per year. The Gini index is also calculated on the basis of consumption.
Changes to the government budget based on the simulated social protection expansion.
| Status quo | Reform A: Stand-alone extension of social protection | Reform B: Revenue-neutral reform | Revenue-neutral reform with behavioural impacts | Difference between (III) and and (IV), in % | |
|---|---|---|---|---|---|
| (I) | (II) | (III) | (IV) | ||
| LEAP benefit | 3.3 | 273.5 | 273.5 | 273.8 | 0.09 |
| Old-age LEAP | 0.0 | 436.6 | 436.6 | 436.7 | 0.02 |
| Employee SSC | 485.6 | 485.6 | 1191.9 | 1179.7 | −1.02 |
| Employer SSC | 1066.5 | 1066.5 | 1066.5 | 1055.7 | −1.02 |
| Income tax | 2059.8 | 2059.8 | 2059.8 | 2038.8 | −1.02 |
| Budget effects | - | 706.7 | 3.8 | 44.8 | - |
| Formal sector (%) | 13.6 | 13.6 | 13.6 | 13.5 | −0.88 |
-
Source: Authors’ calculations based on GHAMOD v1.0.
-
Notes: The budgetary implications are expressed in millions of GHS.
Sensitivity analysis of government revenues and expenditure.
| Revenue-neutral reform with behavioural behavioural impacts | As (I) with greater wage change (-0.15% instead of −0.10%) | As (I) with higher elasticity (0.75 instead of 0.1) | |
|---|---|---|---|
| LEAP benefit | 273.8 | 273.9 | 275.4 |
| Old-age part of | 436.7 | 436.7 | 437.3 |
| LEAP benefit | |||
| Employee SSC | 1179.7 | 1174.0 | 1100.6 |
| Employer SSC | 1055.7 | 1050.5 | 985.9 |
| Income tax revenue | 2038.8 | 2028.9 | 1902.1 |
| Change in costs vs. | 44.8 | 65.7 | 333.6 |
| status quo | |||
| Share of formal workers (%) | 13.5 | 13.4 | 12.7 |
-
Source: Authors’ calculations based on GHAMOD v1.0.
-
Notes: The first column reproduces the numbers of Column (4) in Table 4.