French do it better. The distributive effect of introducing French family fiscal policies in Italy
- Università degli Studi di Firenze, Italy
- Istituto Regionale Programmazione Economica della Toscana, Italy
Figures
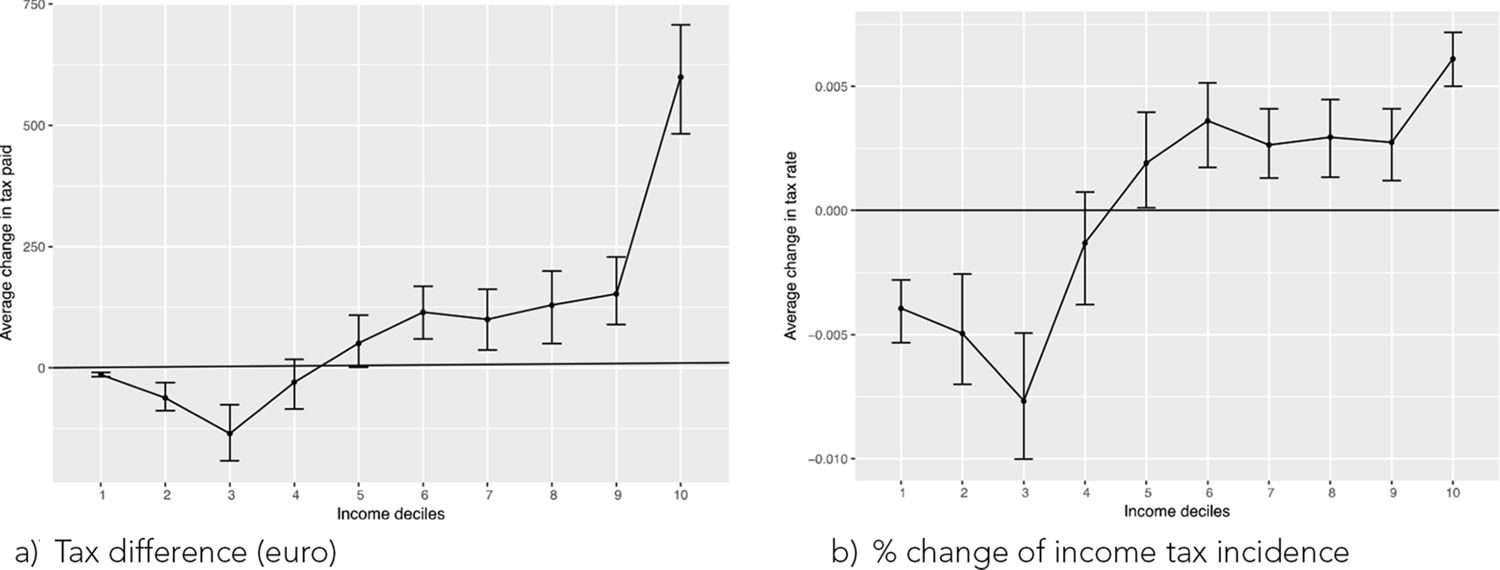
Distributive effects by deciles of equivalent gross household income (a)Tax difference (euro) (b) % change of income tax incidence.
Source: MicroReg based on EUSILC, 2016 (2016). 95% confidence intervals obtained with 200 bootstrap resamplings.

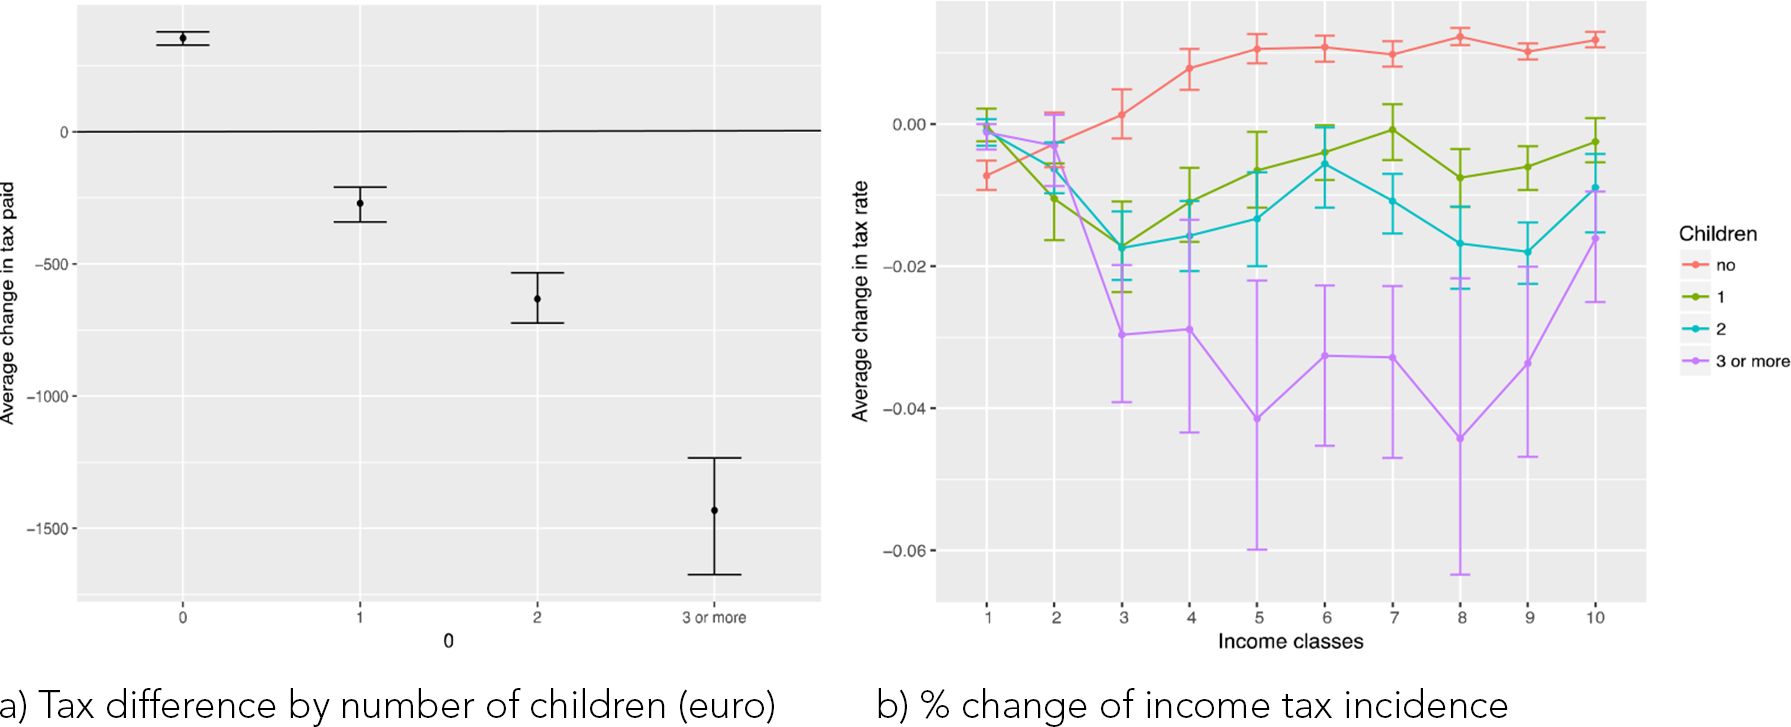
Distributive effects by number of children and deciles of equivalent gross household income (a) Tax difference by number of children (euro) (b) % change of income tax incidence.
Source: MicroReg based on EUSILC, 2016 (2016). Confidence intervals obtained with 200 bootstrap resamplings.

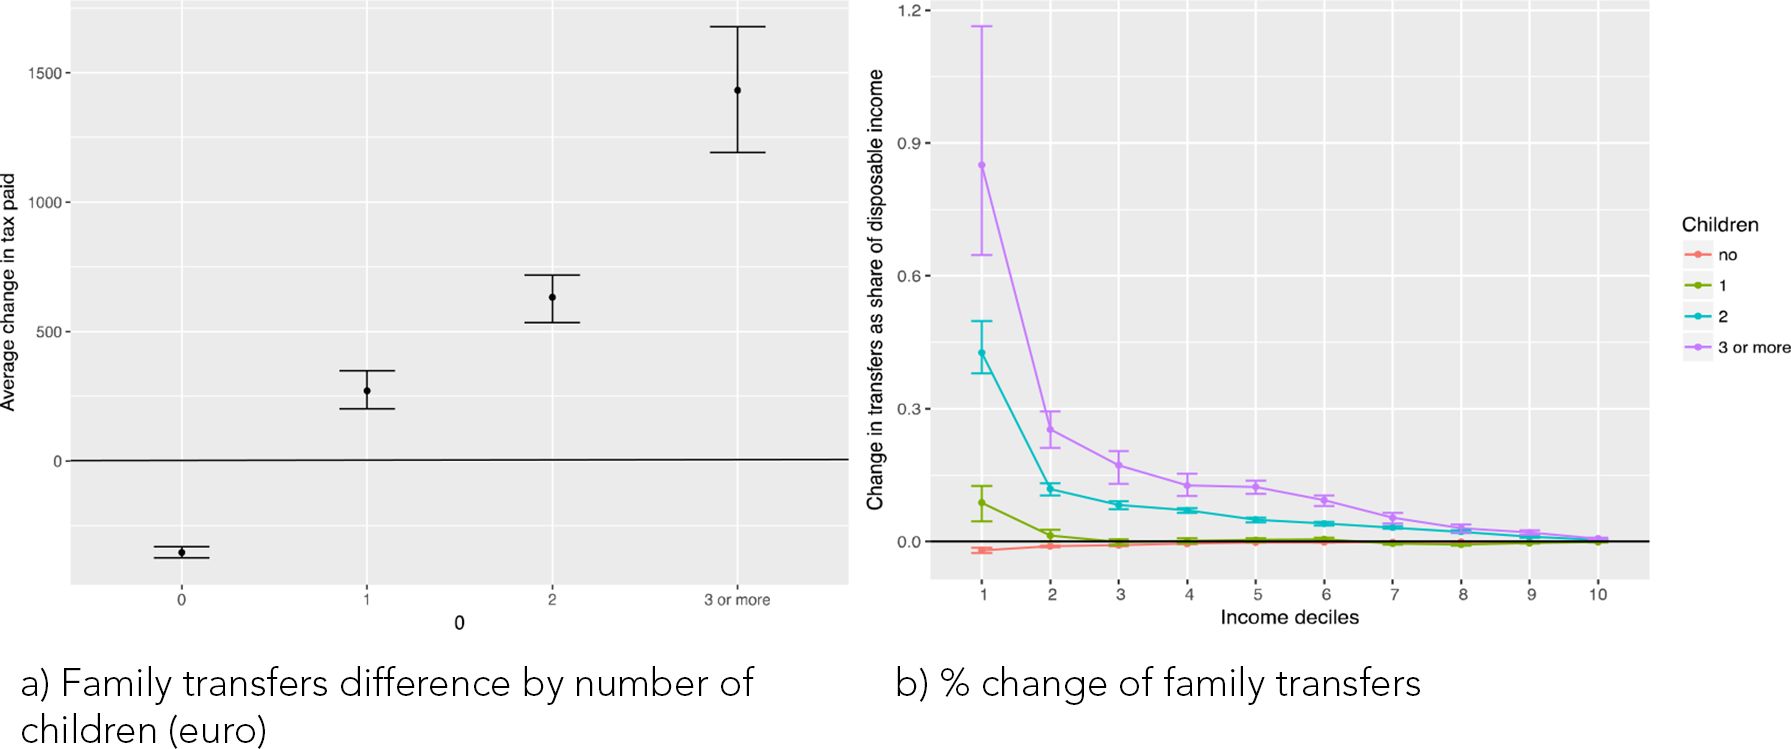
Distributive effects by number of children and deciles of equivalent gross household income (a) Family transfers difference by number of children (euro) (b) % change of family transfers.
Source: MicroReg based on EUSILC, 2016 (2016). Confidence intervals obtained with 200 bootstrap resamplings.

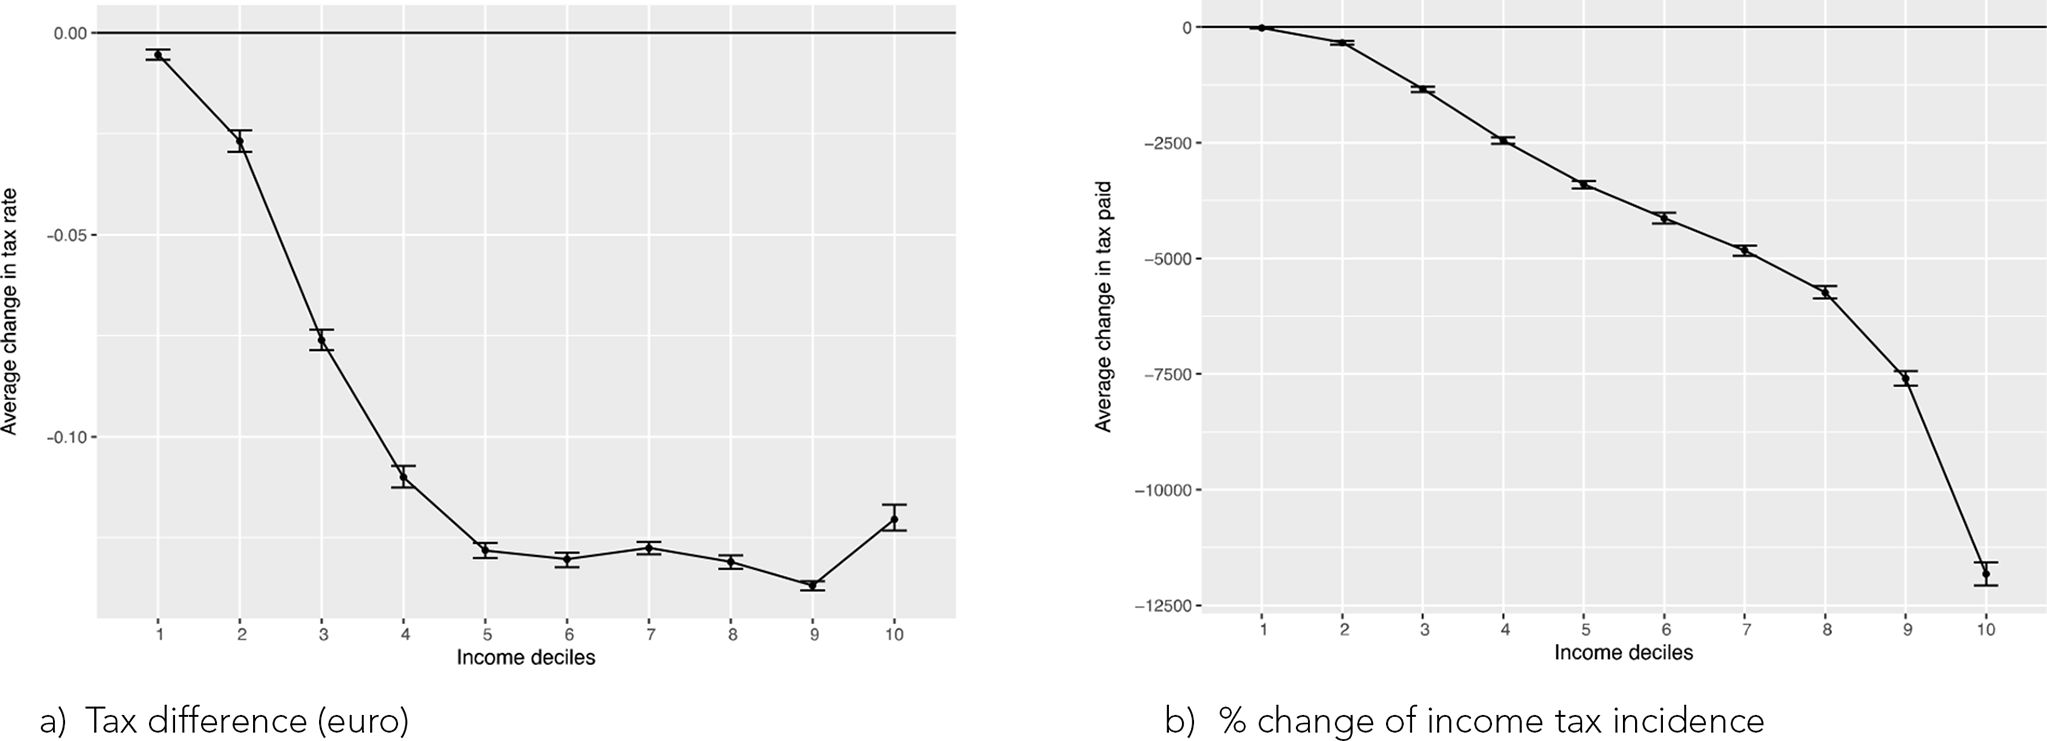
Figure B.1 Distributive effects by deciles of equivalent gross household income (a)Tax difference (euro) (b) % change of income tax incidence.
Source: MicroReg based on EUSILC, 2016 (2016). 95% confidence intervals obtained with 200 bootstrap resamplings.

Figure B.2 Distributive effects by number of children and deciles of equivalent gross household income (a) Tax difference by number of children (euro) (b) % change of income tax incidence.
Source: MicroReg based on EUSILC, 2016 (2016). Confidence intervals obtained with 200 bootstrap resamplings.
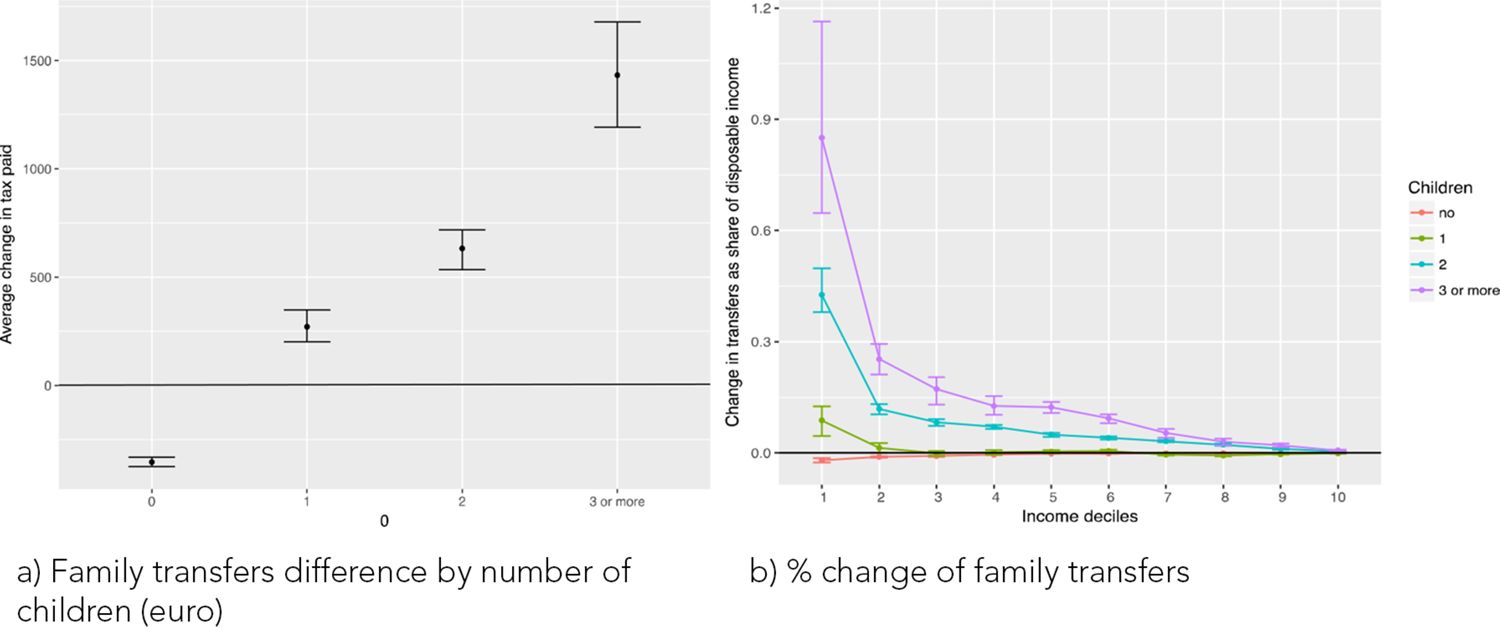
Figure B.3 Distributive effects by number of children and deciles of equivalent gross household income (a) Family transfers difference by number of children (euro) (b) % change of family transfers.
Source: MicroReg based on EUSILC, 2016 (2016). Confidence intervals obtained with 200 bootstrap resamplings.
Tables
The French “family quotient” (QF)
| Household type and children | Part |
|---|---|
| Married or cohabiting couples | 2 |
| Single | 1 |
| Single parent with at least one dependent child | 1.5 |
| Widow/er/s with at least one dependent child | 2 |
| First child | 0.5 |
| Second child | 0.5 |
| Every child after the second | 1 |
Income tax features in Italy and France
| Italy | France | |
|---|---|---|
| Taxation unit | Individual | “Fiscal household” |
| Gross income | Total individual income | Total household income |
| Deductions | Deductions for pension contributions, first home cadastral income and others | Deduction for income source |
| Net taxable income | Total individual income net of deductions (y) | Total household income net of deductions (y) divided by number of “parts” (QF) |
| Legal rates | 23% up to 15,000 euros 27% from 15,000–28,000 euros 38% from 28,000–55,000 euros 41% from 55,000–75,000 euros 43% over 75,000 euros |
0% from 0 to 9,700 euros 14% from 9,701–26,791 euros 30% from 26,792–71,826 euros 41% from 71,827–152,108 euros 45% over 152,108 euros |
| Tax credits | Tax credits for income source Tax credits for household dependents (spouse, children and other household members) Other minor tax credits |
Tax relief (Décote) and other minor tax credits |
| Net tax |
Average tax rate paid on participation for non-working Italian women by household equivalent income deciles and number of children
| Decile/n° children | 0 | 1 | 2 | 3 or more |
|---|---|---|---|---|
| 1 | −2.24% | −3.02% | −4.73% | −6.1% |
| 2 | 2.63% | 2.39% | 0.90% | −1.9% |
| 3 | 5.91% | 9.72% | 6.65% | 3.4% |
| 4 | 7.31% | 9.31% | 9.99% | 8.8% |
| 5 | 9.27% | 8.92% | 11.98% | 7.2% |
| 6 | 6.72% | 11.97% | 9.57% | 8.4% |
| 7 | 8.11% | 10.76% | 6.67% | 11.0% |
| 8 | 8.80% | 14.82% | 13.02% | 17.3% |
| 9 | 9.16% | 10.28% | 16.90% | 17.2% |
| 10 | 11.25% | 13.24% | 18.19% | 13.5% |
-
Source: MicroReg based on EUSILC, 2016 (2016).
Average tax rate paid on participation for non-working Italian women by household equivalent income deciles
| Decile | Predicted income | Participation tax rate today | Participation tax rate after reform | Difference | Share facing higher tax rate after reform |
|---|---|---|---|---|---|
| 1 | 21,766.40 | 17.25% | 14.07% | −3.18% | 5.34% |
| 2 | 21,219.29 | 17.21% | 18.75% | 1.54% | 58.13% |
| 3 | 21,002.73 | 18.61% | 24.89% | 6.28% | 86.83% |
| 4 | 22,074.95 | 17.73% | 26.05% | 8.32% | 86.59% |
| 5 | 22,650.10 | 17.30% | 26.91% | 9.61% | 87.50% |
| 6 | 29,427.52 | 20.02% | 27.94% | 7.92% | 87.43% |
| 7 | 27,369.19 | 17.98% | 26.28% | 8.30% | 86.06% |
| 8 | 21,432.34 | 15.09% | 25.39% | 10.30% | 82.34% |
| 9 | 26,948.72 | 17.74% | 27.62% | 9.88% | 82.82% |
| 10 | 28,348.04 | 17.78% | 29.93% | 12.15% | 81.66% |
-
Source: MicroReg based on EUSILC, 2016 (2016).
Percentage distribution of subsidies by deciles of equivalent gross household income
| Decile | Post reform | Pre reform | ||||||||||
|---|---|---|---|---|---|---|---|---|---|---|---|---|
| AF | PAJE | PN | ARS | ASF | CF | Total | BB | PN | AF | AF3 | Total | |
| 1 | 18% | 17% | 13% | 30% | 24% | 31% | 19% | 17% | 9% | 11% | 45% | 15% |
| 2 | 21% | 19% | 21% | 32% | 15% | 40% | 23% | 28% | 15% | 22% | 46% | 24% |
| 3 | 12% | 14% | 10% | 23% | 11% | 13% | 14% | 9% | 7% | 17% | 9% | 15% |
| 4 | 10% | 16% | 18% | 11% | 13% | 7% | 11% | 12% | 13% | 13% | 0% | 12% |
| 5 | 9% | 13% | 10% | 2% | 8% | 5% | 9% | 7% | 7% | 9% | 0% | 8% |
| 6 | 9% | 13% | 16% | 1% | 9% | 5% | 9% | 10% | 11% | 8% | 0% | 8% |
| 7 | 9% | 6% | 10% | 0% | 6% | 0% | 7% | 8% | 9% | 9% | 0% | 8% |
| 8 | 6% | 1% | 1% | 0% | 4% | 0% | 4% | 8% | 13% | 6% | 0% | 6% |
| 9 | 4% | 0% | 0% | 0% | 7% | 0% | 2% | 1% | 8% | 4% | 0% | 3% |
| 10 | 2% | 0% | 1% | 0% | 4% | 0% | 1% | 0% | 6% | 2% | 0% | 2% |
| Total | 100% | 100% | 100% | 100% | 100% | 100% | 100% | 100% | 100% | 100% | 100% | 100% |
-
Source: MicroReg based on EUSILC, 2016 (2016).
Indices of inequality of the equivalent gross household income
| Pre reform | After reform | |||||
|---|---|---|---|---|---|---|
| point | low | high | point | low | high | |
| Gross income (Gini) | 0.3977 | 0.3919 | 0.4032 | |||
| Gross income – tax (Gini) | 0.3515 | 0.3455 | 0.3567 | 0.3493 | 0.3439 | 0.3549 |
| Tax-Kakwani | 0.1883 | 0.1848 | 0.1908 | 0.1899 | 0.1868 | 0.1935 |
| Transfer-Kakwani | −0.703 | −0.7309 | −0.6753 | −0.7547 | −0.7767 | −0.7331 |
| Disposable income | 0.3467 | 0.3409 | 0.3519 | 0.3449 | 0.3396 | 0.3507 |
-
Source: MicroReg based on EUSILC, 2016 (2016). Confidence intervals obtained with 200 bootstrap resamplings. Note that 95% confidence bounds do no overlap for Gross income – tax (Gini) and Transfer-Kakwani but do overlap for Tax-Kakwani and Disposable income.
Amount and recipients of Italian subsidies by benefit and number of children
| 1 | 2 | 3+ | Total | ||
|---|---|---|---|---|---|
| Baby bonus | Average amount (euro) | 1,117 | 1,397 | 1,422 | 1,281 |
| Recipients (thousand) | 165 | 168 | 54 | 388 | |
| Amount (billion euro) | 185 | 235 | 78 | 498 | |
| Birth bonus | Average amount (euro) | 800 | 834 | 825 | 817 |
| Recipients (thousand) | 225 | 203 | 57 | 485 | |
| Amount (billion euro) | 180 | 169 | 47 | 396 | |
| Family allowance | Average amount (euro) | 800 | 1,369 | 2,614 | 1,248 |
| Recipients (thousand) | 1,748 | 1,706 | 423 | 3,878 | |
| Amount (billion euro) | 1,398 | 2,337 | 1,106 | 4,841 | |
| Municipal family allowances for households with three children | Average amount (euro) | 1,696 | 1,696 | ||
| Recipients (thousand) | 316 | 316 | |||
| Amount (billion euro) | 536 | 536 | |||
| Total | Average amount (euro) | 926 | 1,523 | 3,274 | 1,478 |
| Recipients (thousand) | 1,903 | 1,799 | 539 | 4,242 | |
| Amount (billion euro) | 1,764 | 2,741 | 1,767 | 6,271 |
-
Source: MicroReg based on EUSILC, 2016 (2016)
Amount and recipients of French subsidies by benefit and number of children
| 1 | 2 | 3+ | Total | ||
|---|---|---|---|---|---|
| Allocation Familiale | Average amount (euro) | 1,938 | 4,491 | 2,392 | |
| Recipients (thousand) | 3,210 | 694 | 3,904 | ||
| Amount (billion euro) | 6,222 | 3,119 | 9,341 | ||
| Prestation d´Accueil du Jeune Enfant | Average amount (euro) | 1,994 | 2,075 | 2,181 | 2,052 |
| Recipients (thousand) | 560 | 554 | 160 | 1,273 | |
| Amount (billion euro) | 1,230 | 1,213 | 392 | 2,836 | |
| Prime de naissance | Average amount (euro) | 928 | 966 | 962 | 951 |
| Recipients (thousand) | 126 | 152 | 49 | 327 | |
| Amount (billion euro) | 121 | 153 | 52 | 325 | |
| Allocation de rentrée scolaire | Average amount (euro) | 377 | 579 | 915 | 575 |
| Recipients (thousand) | 759 | 1,242 | 427 | 2,428 | |
| Amount (billion euro) | 286 | 719 | 390 | 1,395 | |
| Allocation de soutien familial | Average amount (euro) | 110 | 219 | 323 | 157 |
| Recipients (thousand) | 766 | 403 | 64 | 1,233 | |
| Amount (billion euro) | 84 | 88 | 21 | 193 | |
| Complément familial | Average amount (euro) | 2,616 | 2,616 | ||
| Recipients (thousand) | 294 | 294 | |||
| Amount (billion euro) | 890 | 890 | |||
| Total | Average amount (euro) | 943 | 2,586 | 6,757 | 2,605 |
| Recipients (thousand) | 1,700 | 3,220 | 695 | 5,614 | |
| Amount (billion euro) | 1,722 | 8,395 | 4,863 | 14,980 |
-
Source: MicroReg based on EUSILC, 2016 (2016)
Heckman selection model for women’s participation wage
| Variable | Coeff | P-value | St. sig. |
|---|---|---|---|
| log labor income | |||
| age | 0.0628 | 0.0106 | *** |
| age2 | −0.0005 | 0.0001 | *** |
| north | 0.0832 | 0.053 | |
| center | −0.0336 | 0.0489 | |
| comp. edu. | −0.4583 | 0.0731 | *** |
| secondary edu | −0.2166 | 0.03299 | *** |
| constatnt | 8.2617 | 0.2634 | *** |
| working | |||
| age | 0.1312 | 0.009 | *** |
| age2 | −0.0015 | 0.0001 | *** |
| north | 0.6996 | 0.0337 | *** |
| center | 0.5289 | 0.0389 | *** |
| comp. edu. | −1.1664 | 0.0434 | *** |
| secondary edu | −0.4476 | 0.0417 | *** |
| # children | −0.1908 | 0.0155 | *** |
| constatnt | −1.7206 | 0.1881 | *** |
| Mills | |||
| lambda | −0.4535 | 0.1173 | *** |
| rho | 0.5032 | ||
| sigma | 0.9011 | ||
-
Note: Dependent variables are the log of the yearly labour income and the probability to be working, number of observations 9,687, censored 3,235, uncensored 6,452. Wald
-
Source: MicroReg based on EUSILC, 2016 (2016)
Data and code availability
The model is based on the Italian sample of EUSILC. Access to EUSILC data is granted by Eurostat to recognized research entities for scientific purposes only. Tax rules considered in this paper refer to the 2016 tax returns (tax year 2015) for both Italy and France. The EUSILC sample of 2016 is used.
The code of the model is proprietary.