Modelling households’ financial vulnerability with consumer credit and mortgage renegotiations
- Directorate General for Economics, Statistics and Research, Bank of Italy, Italy
Figures

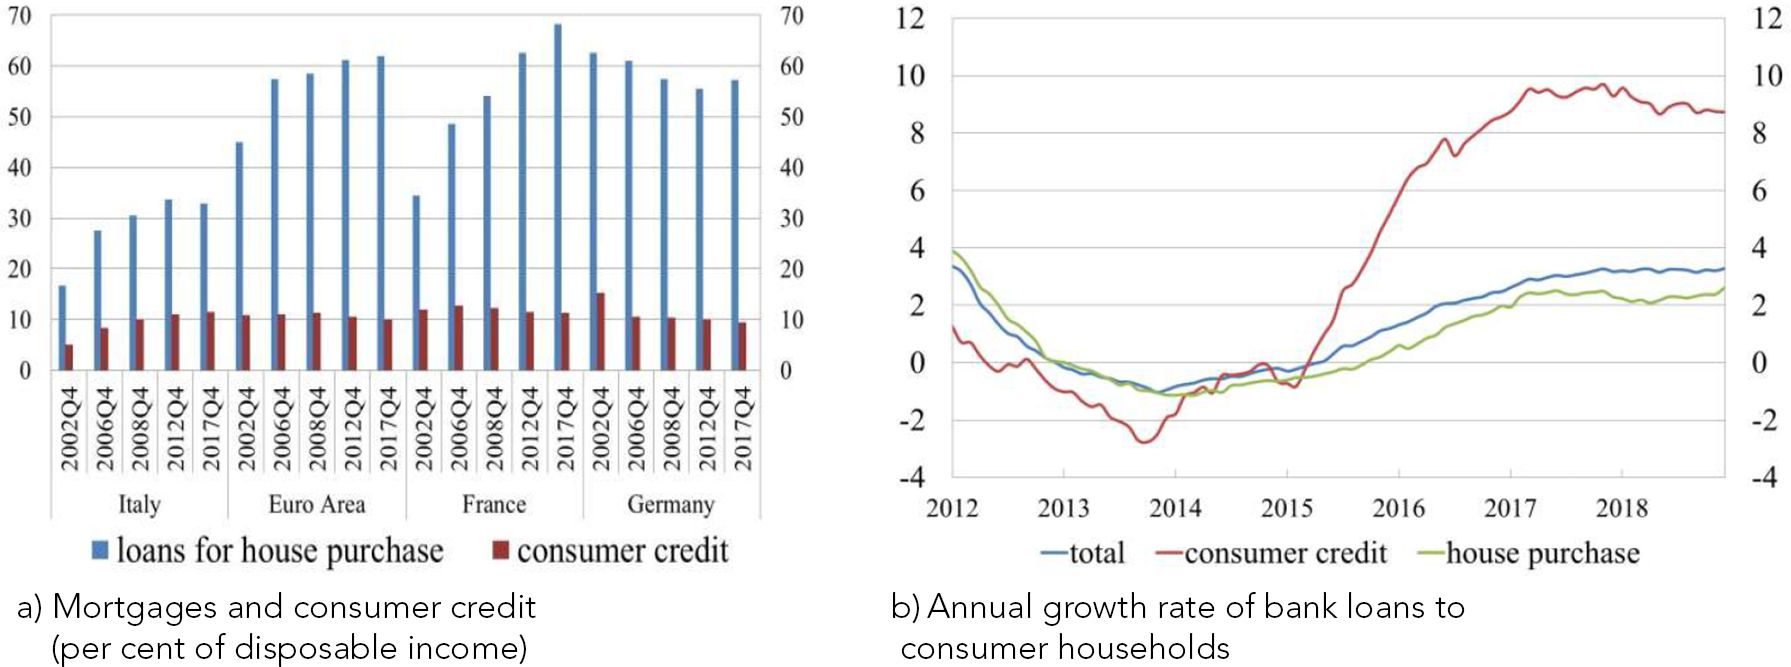
Mortgages and consumer credit (percentages). a) Mortgages and consumer credit (per cent of disposable income), b) Annual growth rate of bank loans to consumer household.
Notes: a) Source: National accounts. b) Source: Supervisory reports

Mortgage renegotiations and risks (percentages). a) Mortgage renegotiations and interest rates. b) New non-performing loan rate.
Notes: a) The share of mortgage renegotiations is given by the sum of the total amount of the mortgages whose contract terms have been revised over the previous period stock of mortgages. dx means right-hand scale. Source: Supervisory reports and MIR data. b) Source: Supervisory reports for mortgages and CRIF data for consumer credit.

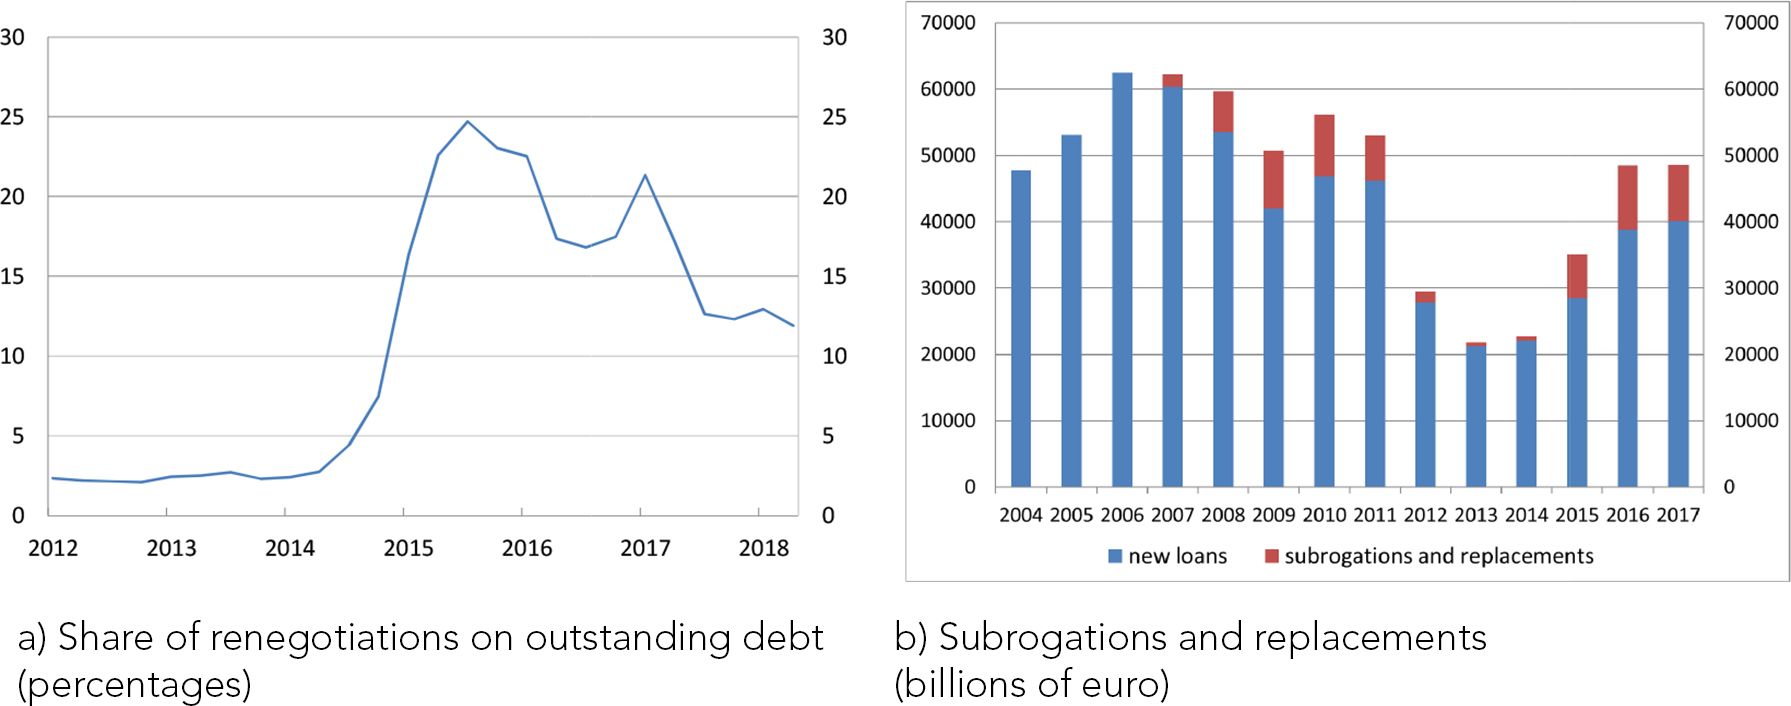
Mortgage refinancing. a) Share of renegotiations on outstanding debt (percentages), b) Subrogations and replacements (billions of euro).
Notes: Our calculation based on Supervisory reports.

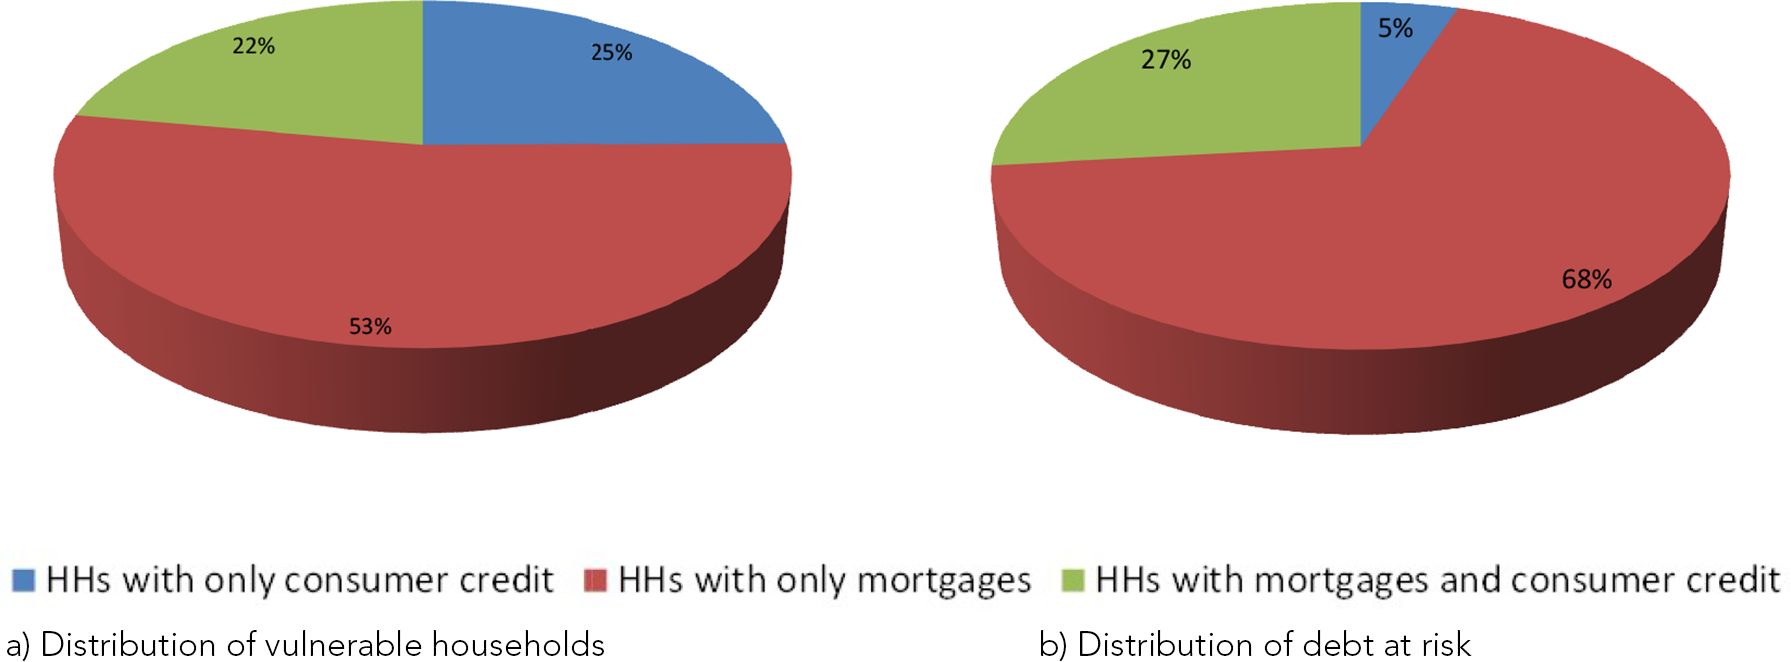
Financial vulnerability by type of debt (averages 2010–16; percentages). a) Distribution of vulnerable households, b) Distribution of debt at risk.
Notes: Our calculation based on SHIW data. Debt at risk refers to the debt held by vulnerable households.

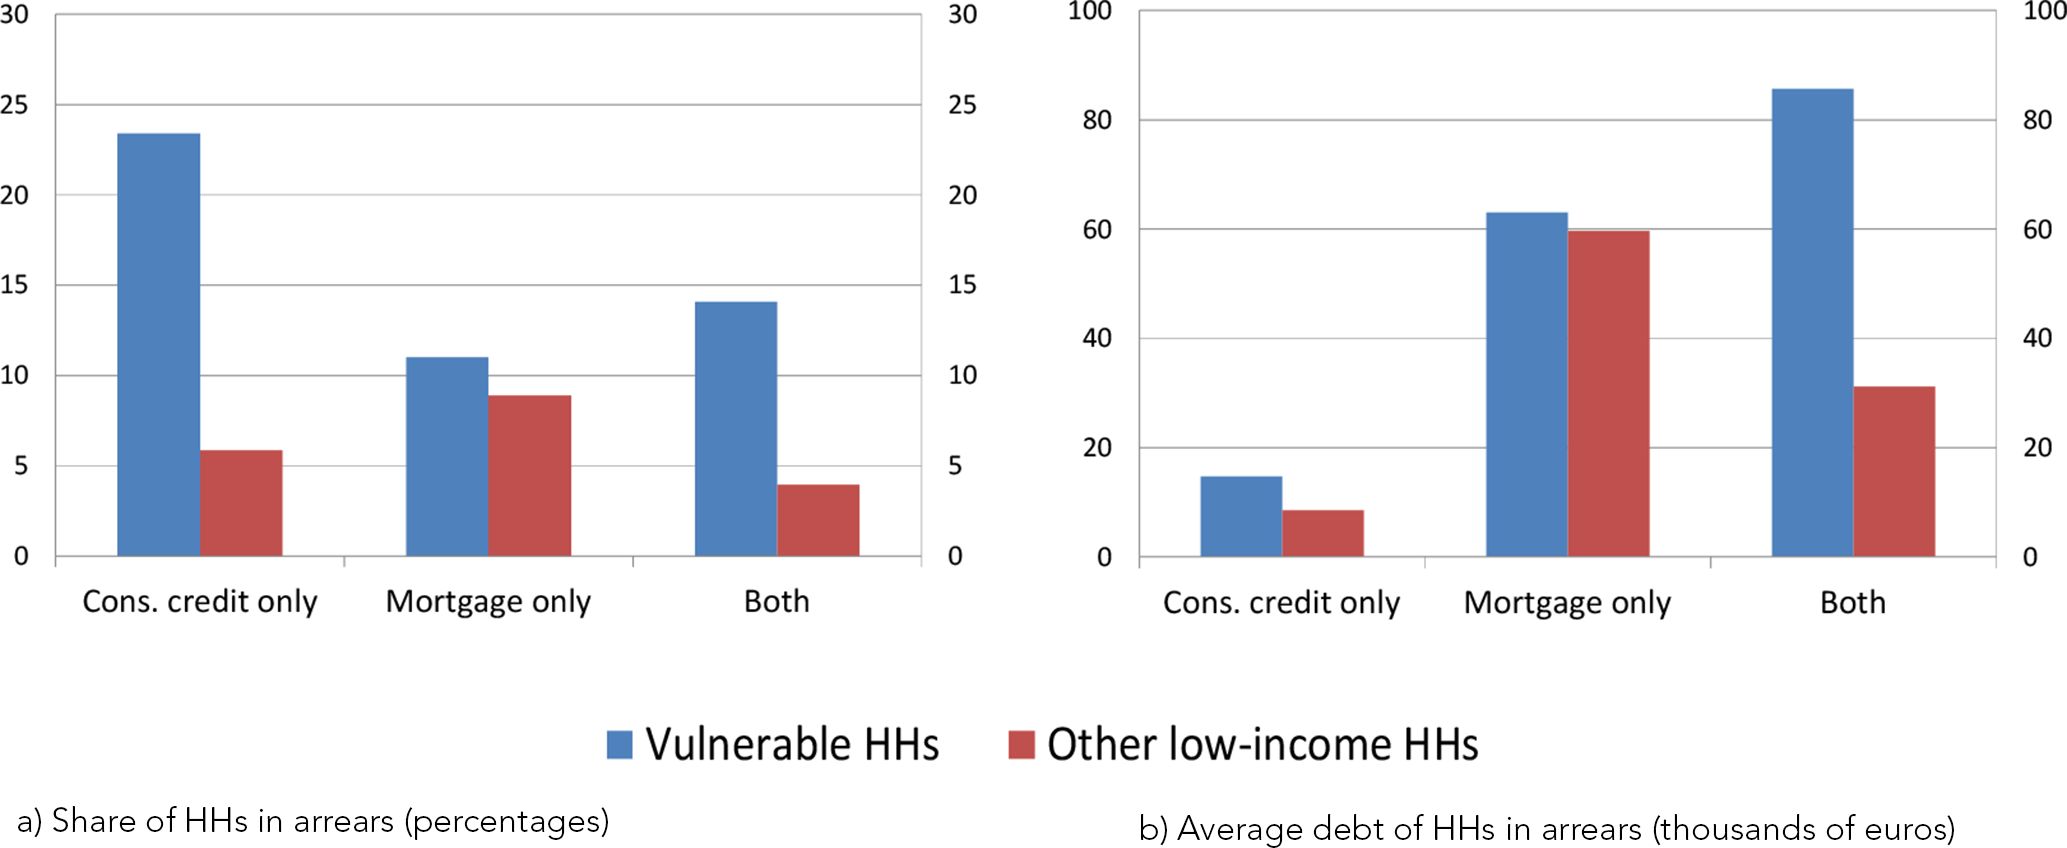
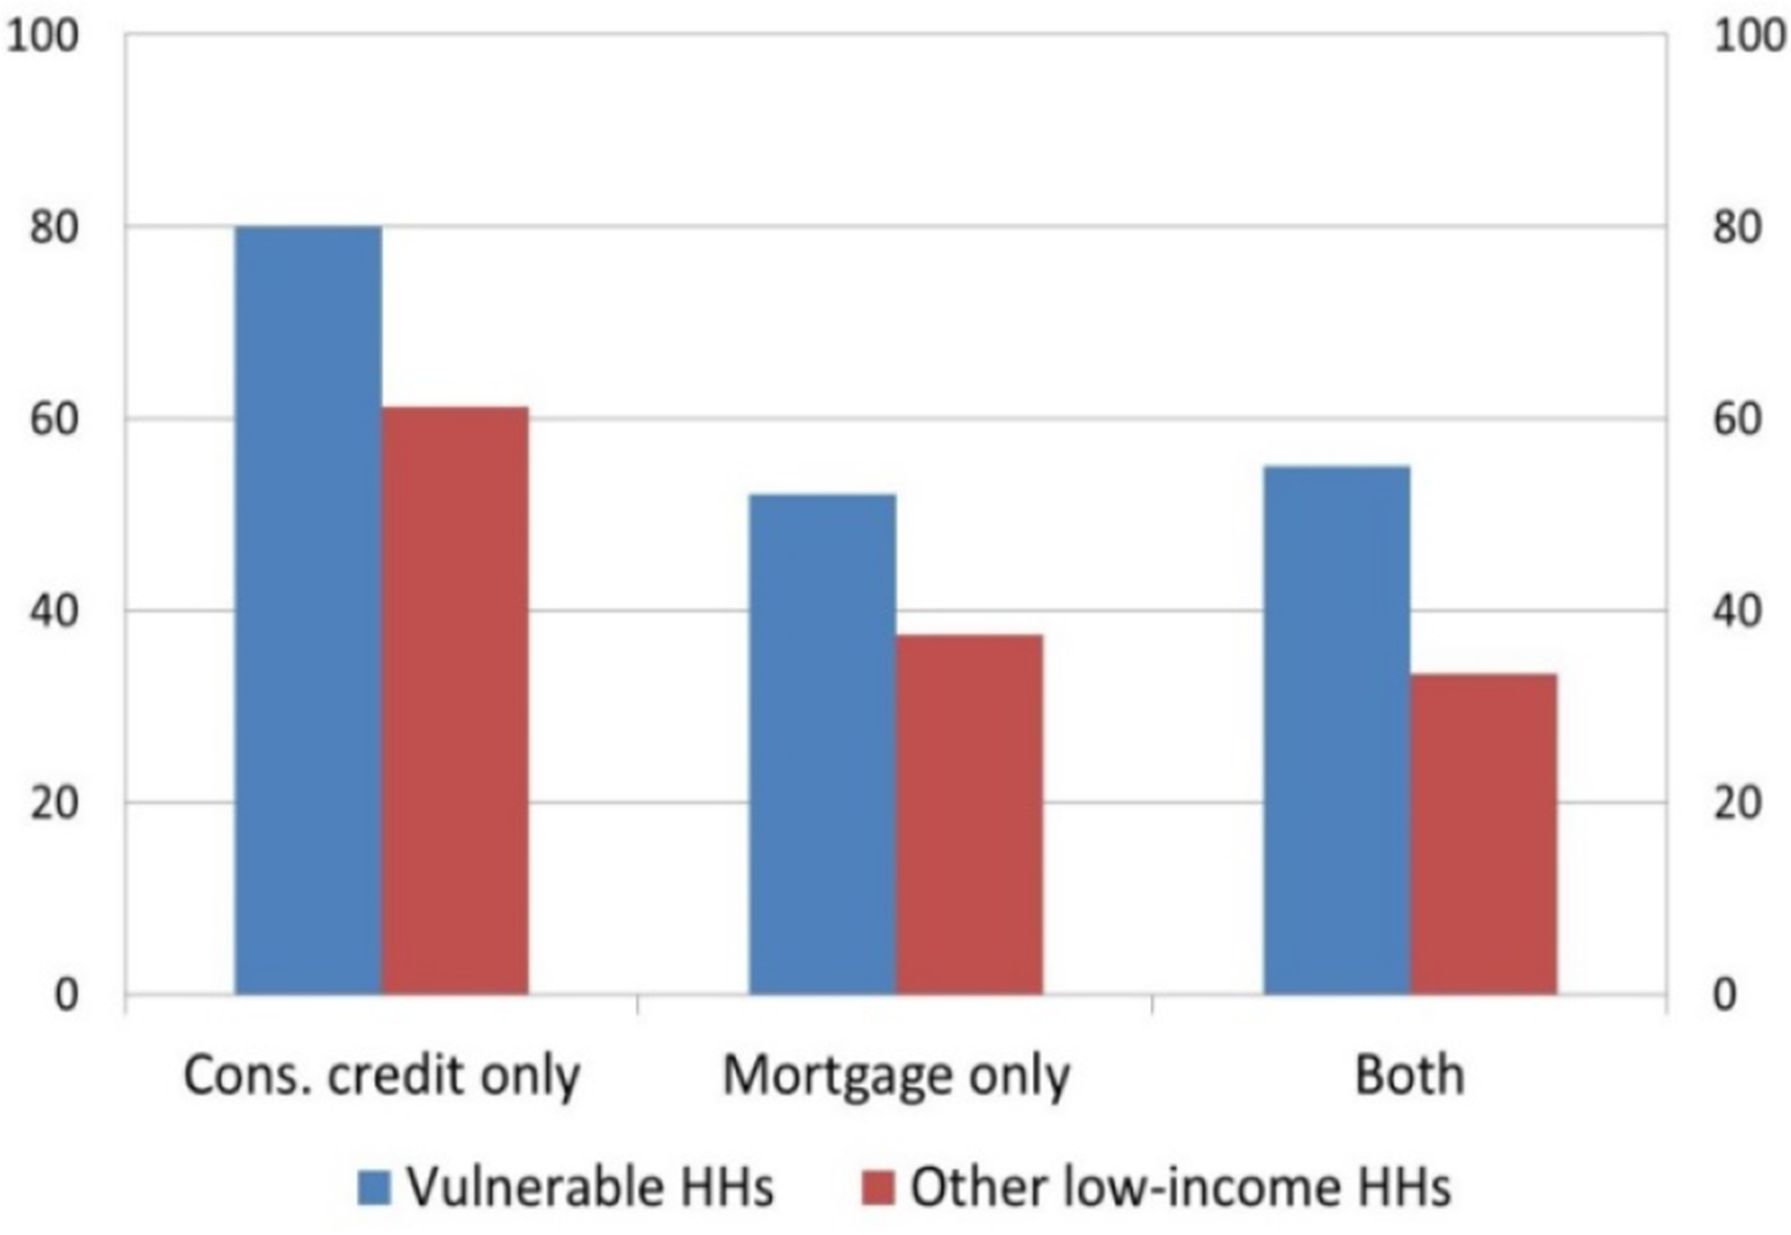
Financial vulnerability and arrears of more than 90 days (averages 2010-16). a) Share of HHs in arrears (percentages), b) Average debt of HHs in arrears (thousands of euros).
Notes: Our calculation based on SHIW data. Other low-income households include households with an income below the median of the population and a DSR below 30 per cent.

Subjective perception of economic difficulty (1) (percentages; averages 2010–16).
Notes: Our calculation based on SHIW data. (1) Share of households declaring that their income is not sufficient to see them through to the end of the month without difficulty.

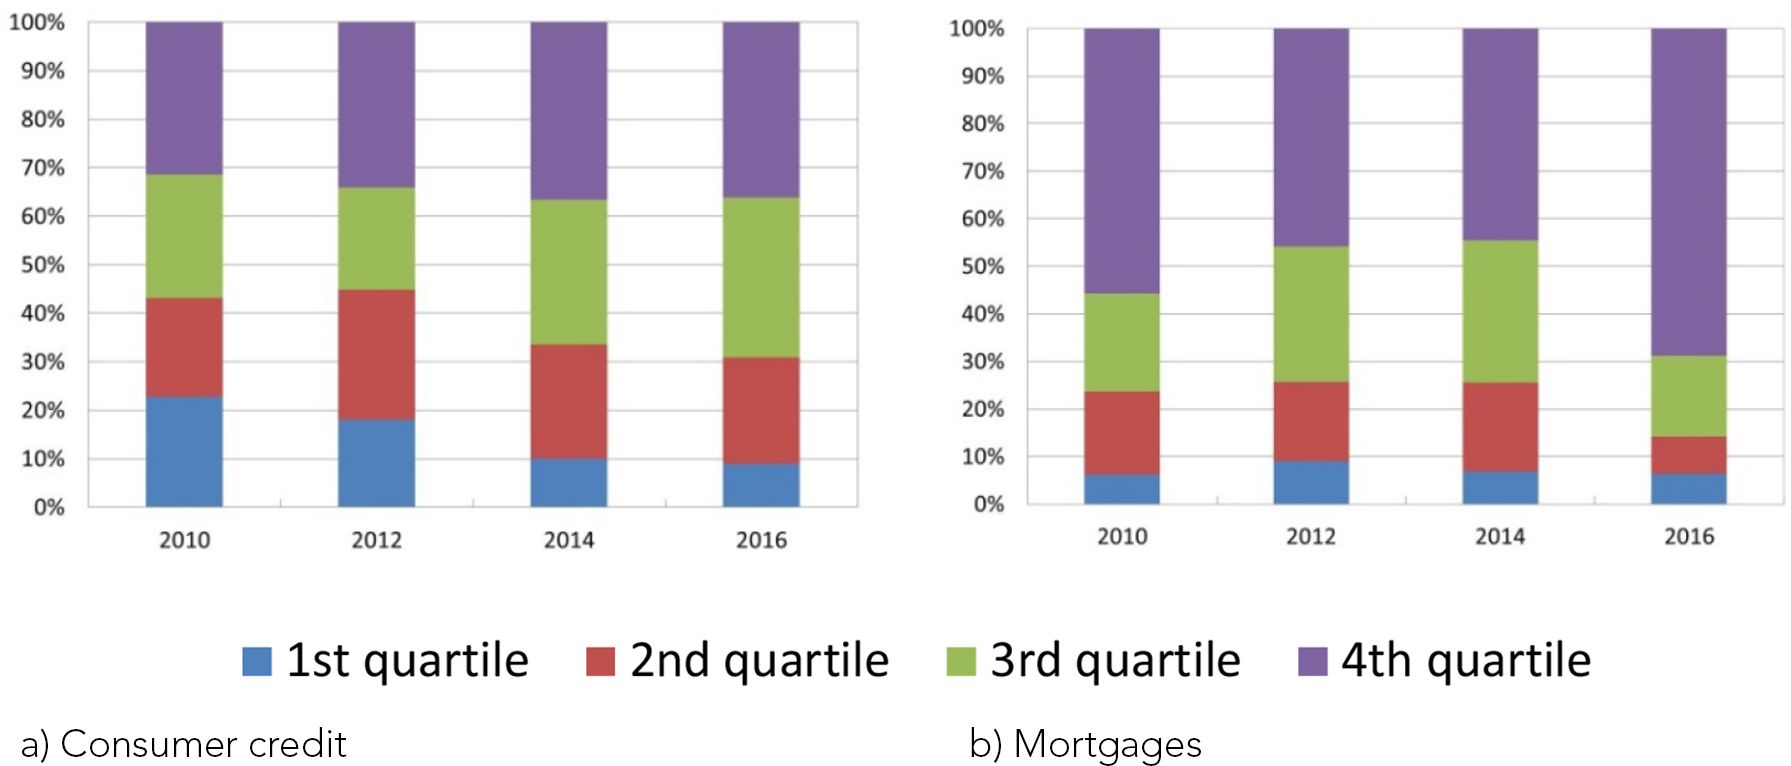
Household debt by income groups. a) Consumer credit, b) Mortgages.
Notes: Our calculation on SHIW data.

Distribution of theoretical and observed debt (1).
Notes: Our calculation based on SHIW data. (1) Observed debt refers to the actual SHIW outstanding debt for each household. Theoretical debt refers to the amount of debt that would be consistent with the installments paid by each household.

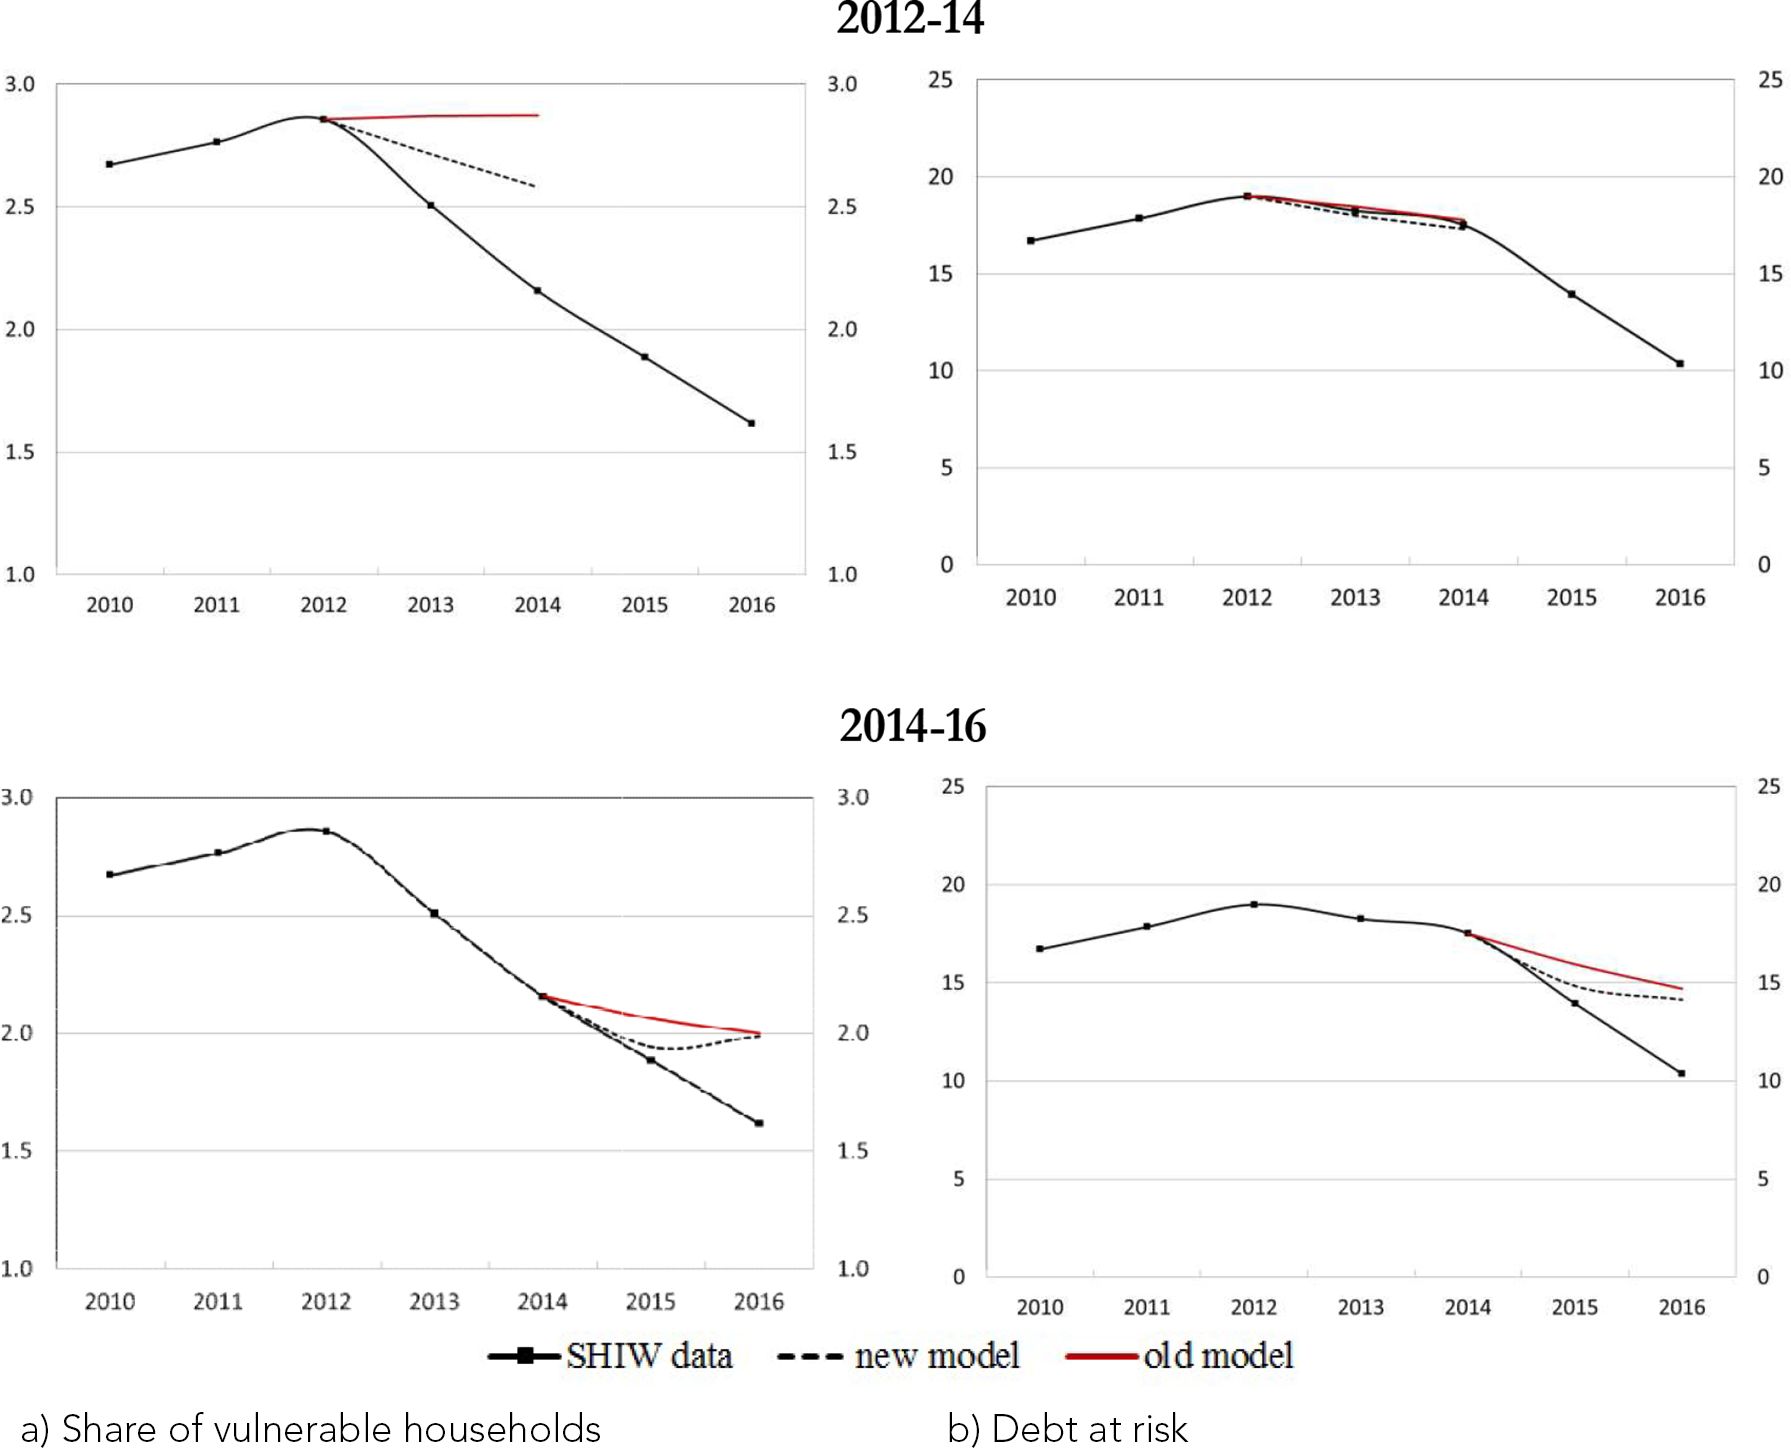
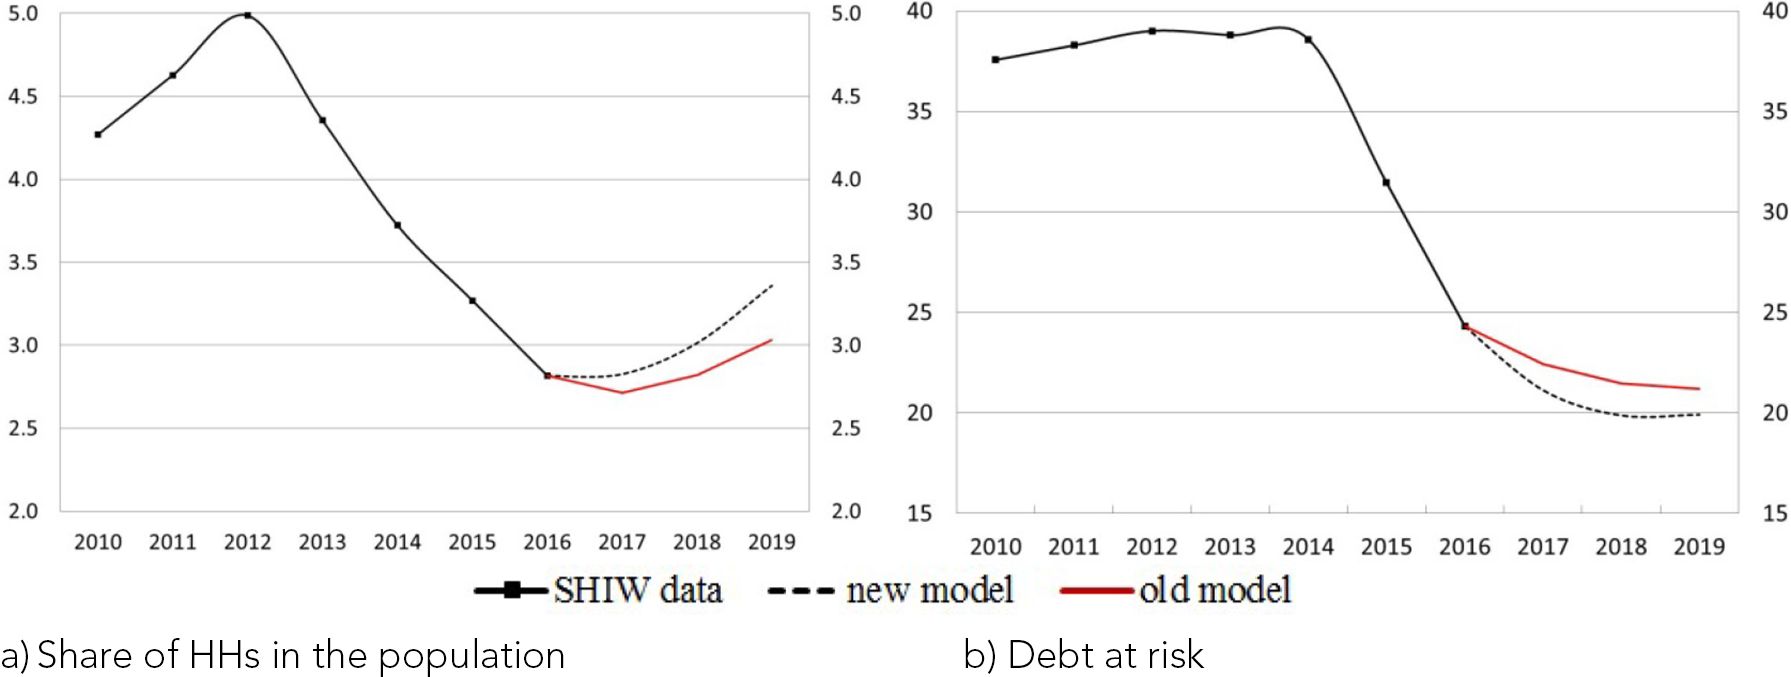
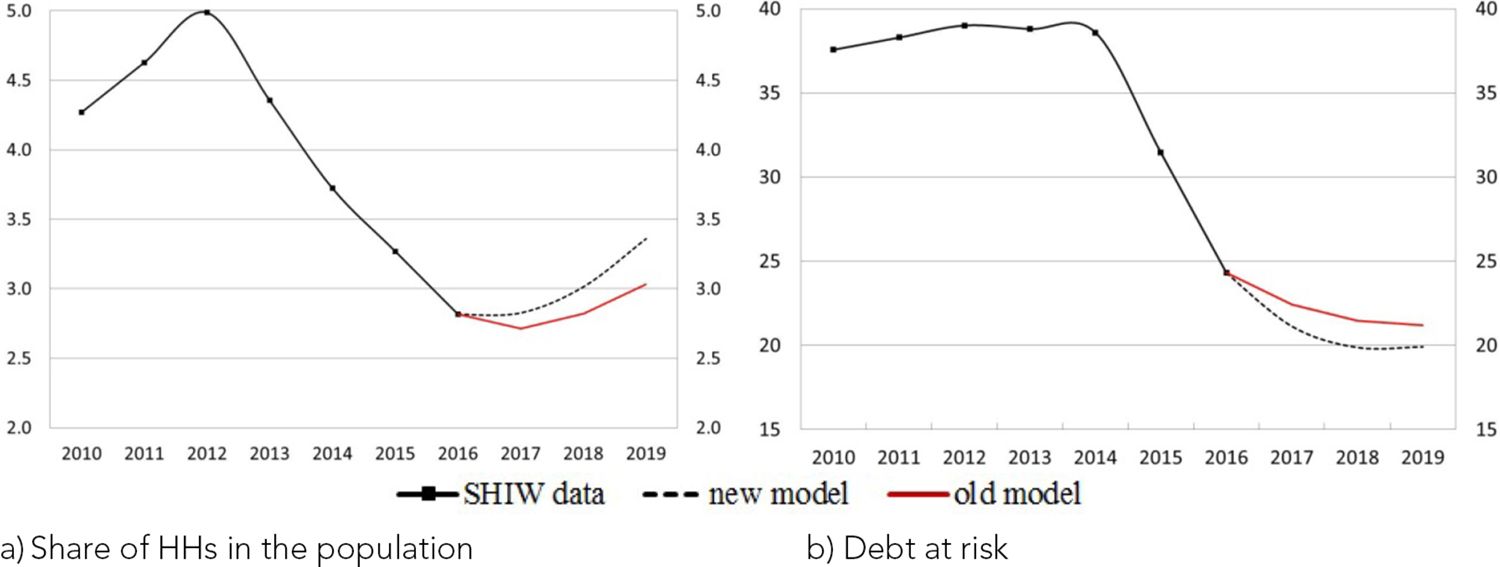
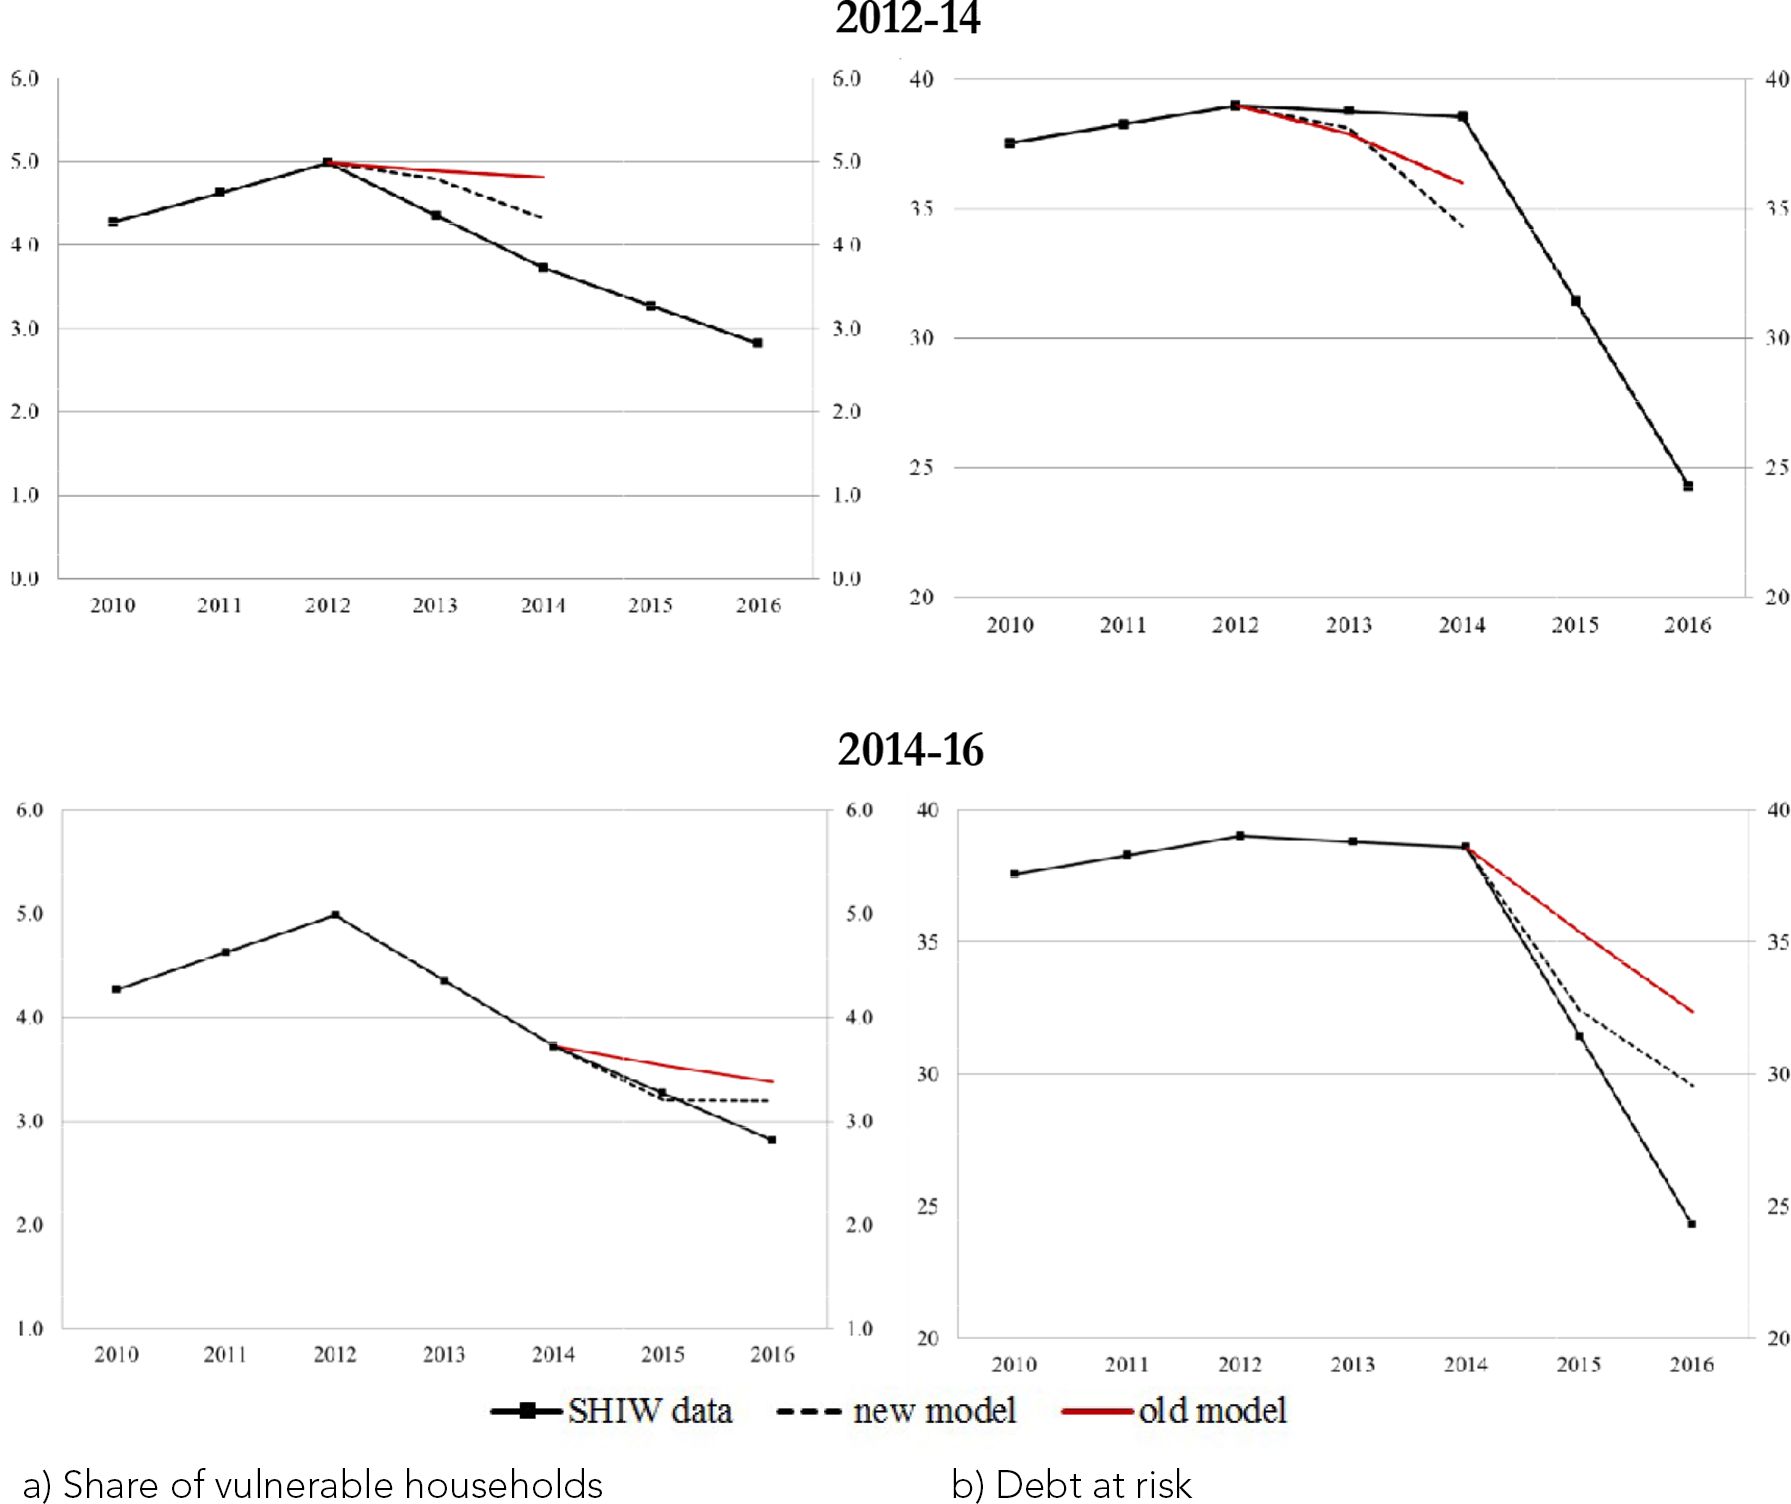
Backtest exercises – Vulnerability (percentages). a) Share of vulnerable households, b) Debt at risk.
Notes: Debt at risk refers to the share of debt held by vulnerable households. The black line with diamonds represents actual SHIW data; the red and the dotted lines represent the out-of-sample projections for the ‘old model’ and the ‘new model’ respectively. These projections correspond to the median values across 50 simulations for the two model specifications.

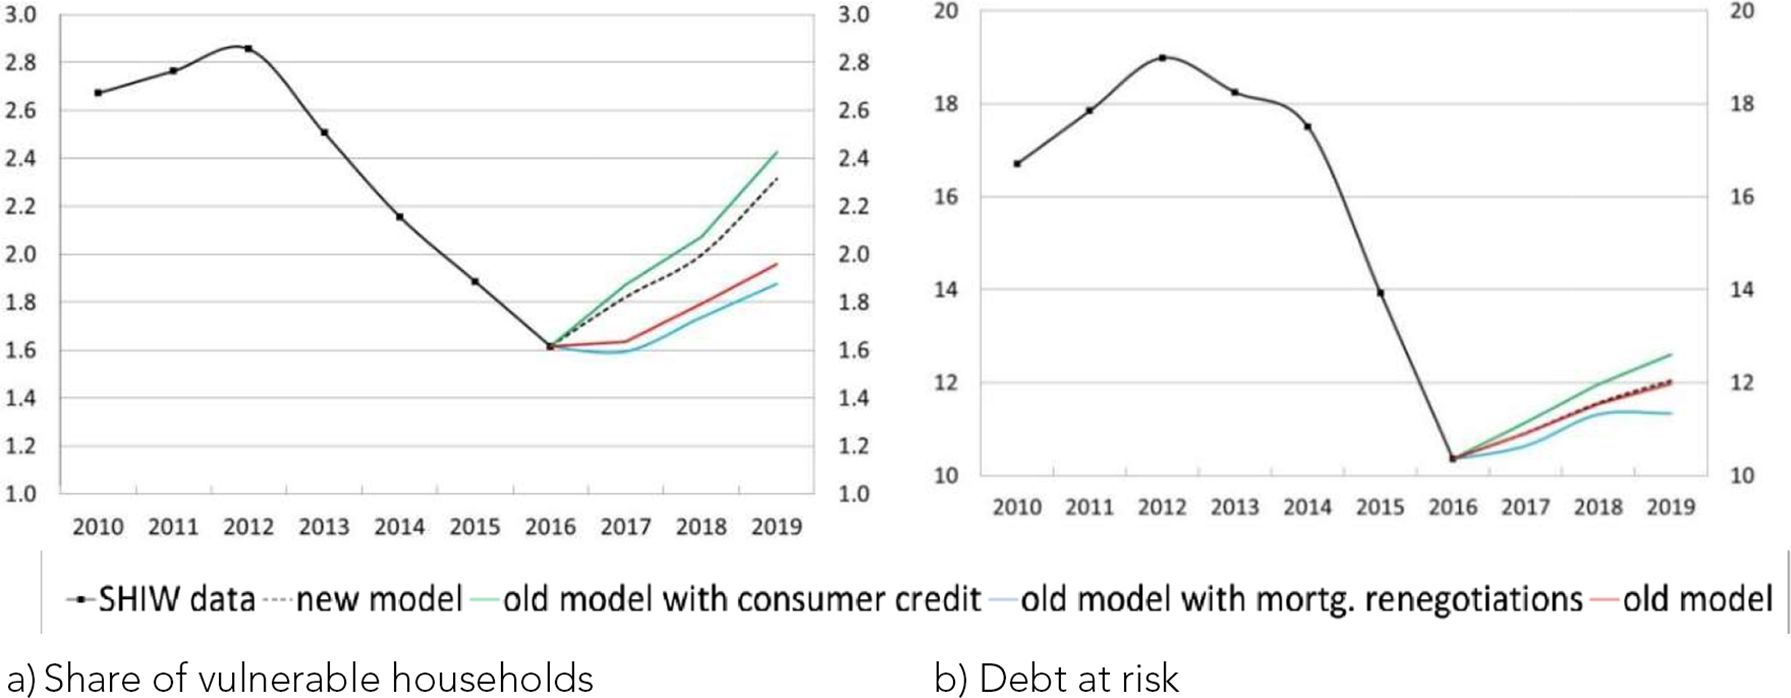
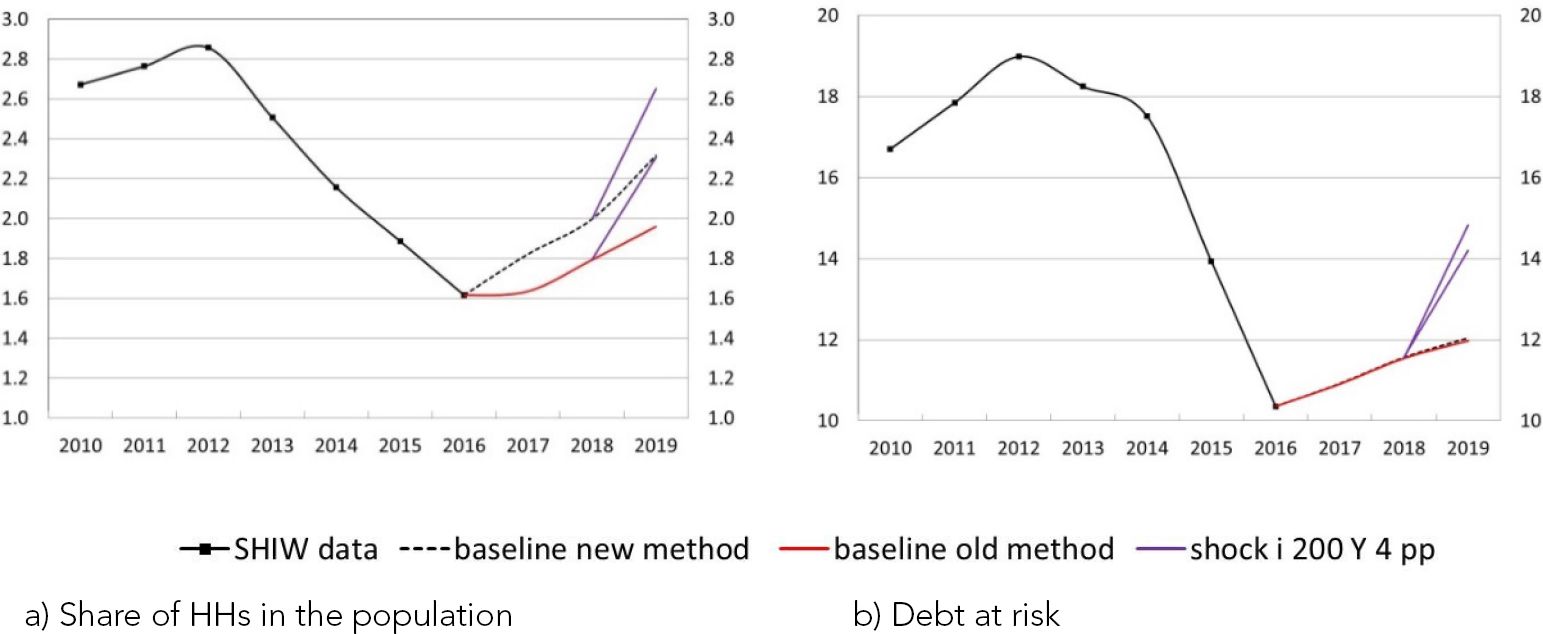
Vulnerability in the period 2016-2019 (percentages). a) Share of vulnerable households, b) Debt at risk.
Notes: Debt at risk refers to the share of debt held by vulnerable households.

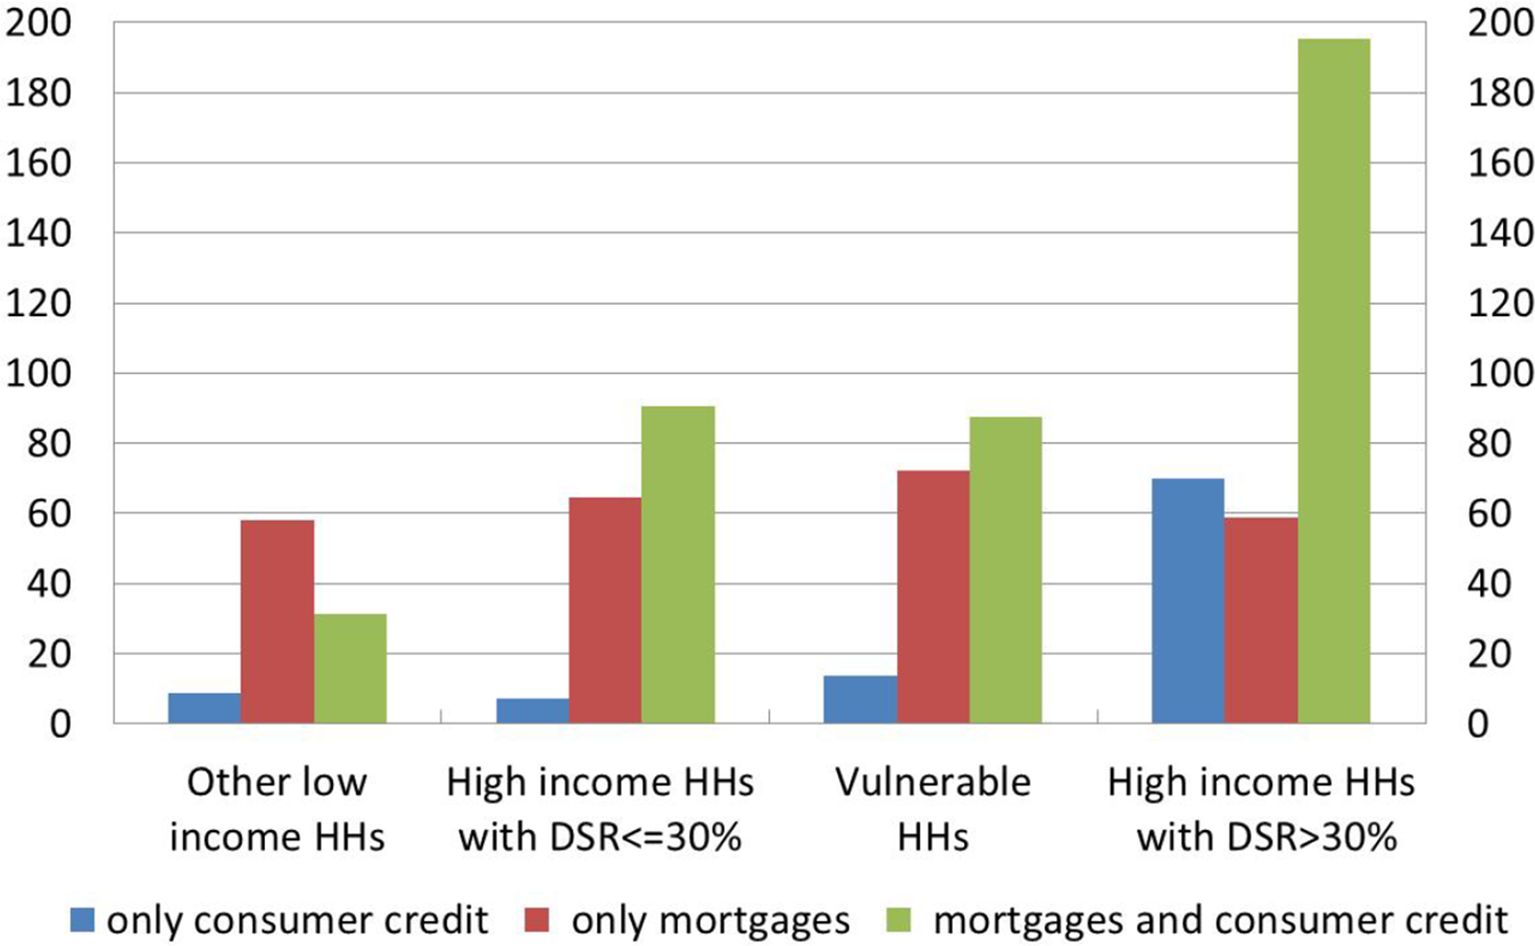
Average amount of debt among households in arrears (thousands of euros, average over 2010-16).
Notes: Our calculation based on SHIW data. High-income households are those with an income above the median of the population.
All households with DSR >30 per cent in the period 2016–2019 (percentages). a) Share of HHs in the population, b) Debt at risk.
Notes: Debt at risk refers to the share of debt held by households with DSR above 30 per cent.

Household debt service.
Source: Bank of Italy (2011).

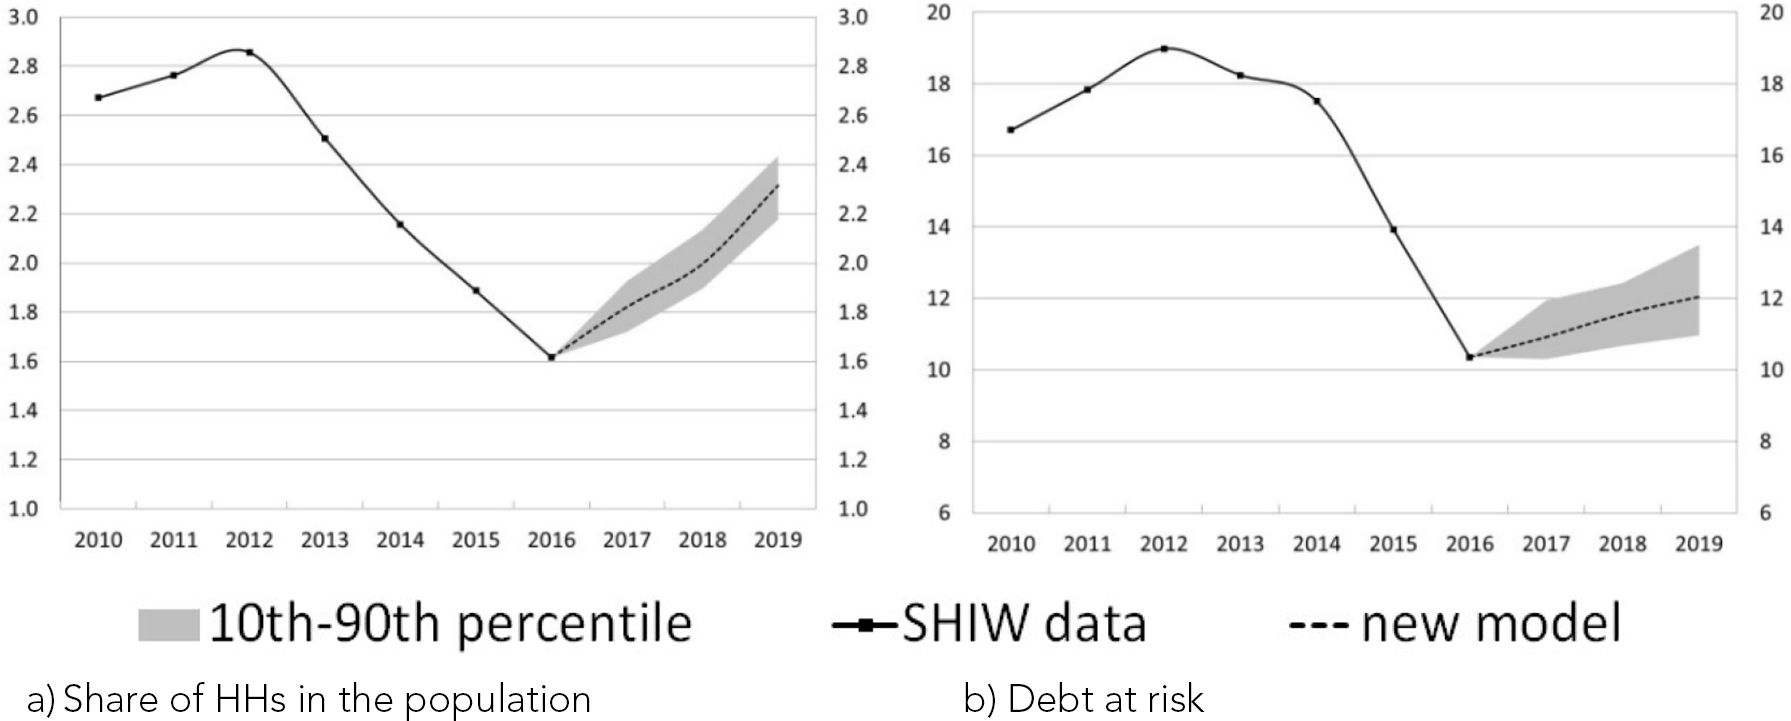
Confidence intervals: vulnerability in the period 2016-19 (percentages). a) Share of HHs in the population, b) Debt at risk.
Notes: Debt at risk refers to the share of debt held by vulnerable households.

Backtest excercises - All households with a DSR>30 per cent (percentages). a) Share of vulnerable households, b) Debt at risk.
Notes: Debt at risk refers to the share of debt held by households with a DSR above 30 per cent.

Vulnerability in the period 2016-2019 under adverse scenarios: Interest rates stress (+200 bps) and income stress (-4 p.p.) in 2019 (percentages). a) Share of HHs in the population, b) Debt at risk.
Notes: Debt at risk refers to the share of debt held by vulnerable households.
Tables
Loans to households (millions of euros and per cent)
| Mortgages | Consumer credit | Total loans | Percentage composition | |||||||
|---|---|---|---|---|---|---|---|---|---|---|
| Total | Non-performing | Total | Non-performing | Total | Non-performing | A/E | B/F | C/E | D/F | |
| (A) | (B) | (C) | (D) | (E) | (F) | |||||
| 2010 | 329,950 | 13,938 | 118,779 | 10,766 | 543,902 | 38,765 | 60.7 | 36 | 21.8 | 27.8 |
| 2011 | 345,406 | 16,055 | 118,476 | 11,792 | 565,345 | 46,760 | 61.1 | 34.3 | 21 | 25.2 |
| 2012 | 345,255 | 18,845 | 116,142 | 12,140 | 562,102 | 52,173 | 61.4 | 36.1 | 20.7 | 23.3 |
| 2013 | 341,952 | 21,728 | 111,937 | 12,088 | 554,170 | 57,161 | 61.7 | 38 | 20.2 | 21.1 |
| 2014 | 341,221 | 23,660 | 108,644 | 10,879 | 549,522 | 59,087 | 62.1 | 40 | 19.8 | 18.4 |
| 2015 | 342,698 | 25,530 | 109,993 | 9,632 | 551,824 | 60,922 | 62.1 | 41.9 | 19.9 | 15.8 |
| 2016 | 348,643 | 25,812 | 113,302 | 7,804 | 558,341 | 57,592 | 62.4 | 44.8 | 20.3 | 13.6 |
| 2017 | 355,906 | 23,588 | 121,992 | 7,035 | 567,262 | 49,521 | 62.7 | 47.6 | 21.5 | 14.2 |
| 2018-Q3 | 356,792 | 20,295 | 129,257 | 6,618 | 571,742 | 40,233 | 62.4 | 50.4 | 22.6 | 16.4 |
-
Source = Supervisory reports.
Household debt (averages 2010-16; euros and per cent)
| Consumer credit | Mortgage | |||
|---|---|---|---|---|
| Amount | Interest rate* | Amount | Interest rate* | |
| Vulnerable HHs | 10,001 | 5.0 | 80,734 | 4.3 |
| Other low-income HHs | 5,446 | 4.4 | 52,009 | 4.1 |
-
Notes: Our calculation based on SHIW data.
-
*
Interest rates are calculated as weighted averages of the amount borrowed. Other low-income households include households with an income below the median of the population and a DSR below 30 per cent.
Mortgage renegotiations (percentages)
| SHIW | MODEL* | |
|---|---|---|
| a) Share of households that renegotiate their mortgage terms among indebted households | ||
| 2014 | 5.0 | 5.4 |
| 2016 | 11.7 | 12.6 |
| b) Share of debt held by households that renegotiate their mortgage terms | ||
| 2014 | 4.0 | 2.8 |
| 2016 | 14.9 | 12.0 |
-
*
Averages over two years.
Distribution of households by income and DSR (percentages; averages over the period 2010-16)
| Share of households | Share of debt | |
|---|---|---|
| Vulnerable HHs | 2.3 | 15.8 |
| Other low-income HHs | 47.7 | 13.9 |
| High-income HHs with DSR >30% | 1.5 | 18.3 |
| High-income HHs with DSR ≤30% | 48.5 | 52.0 |
-
Notes: Our calculation based on SHIW data. High-income households are those with an income above the median of the population.
Indicators of indebted households (percentages; averages over the period 2010-16)
| Vulnerable HHs | Other low income HHs with DSR <30% | High income HHs with DSR >30% | High income HHs with DSR <30% | |
|---|---|---|---|---|
| Total wealth | 118416.5 | 97649.57 | 343556.8 | 364953.6 |
| Financial wealth | 4628.9 | 7228.245 | 26838.81 | 46315.7 |
| Liquid assets | 3468.2 | 5614.0 | 13404.5 | 21399.0 |
| Liquidity index (fa/instalment) | 0.795 | 6.440 | 0.828 | 15.117 |
| Debt to income | 4.041 | 0.118 | 3.166 | 0.200 |
| Debt to assets | 1.689 | 0.024 | 1.608 | 0.011 |
-
Notes: Our calculation based on SHIW data. fa indicates liquid financial assets. High-income households are those with an income above the median of the population.
Participation in the consumer credit market: Linear regression model
| Participation at time t-1 in consumer credit market | 0.328** (0) |
|---|---|
| Participation at time t-1 in the mortgage market | 0.086*** (4.12e-09) |
| Income quartile 2 | 0.027*** (0.00319) |
| Income quartile 3 | 0.037*** (0.000154) |
| Income quartile 4 | 0.041*** (0.000128) |
| Durable consumption class 2 | 0.044*** (0.000649) |
| Durable consumption class 3 | 0.055*** (2.91e-05) |
| Durable consumption class 4 | 0.081*** (1.14e-05) |
| Durable consumption class 5 | 0.212*** (0) |
| Constant | 0.023*** (1.34e-05) |
| Observations | 17,368 |
| R-squared | 0.182 |
-
Notes: Probability weights have been used.
-
Robust p-values in parentheses. ***P<0.1, **P<0.05, *P<0.01
Change in consumer credit amount: Linear regression model
| Growth rate of consumer loans in period T in italy | 452.014* (258.903) |
|---|---|
| Income quartile 1 | –56.722 (131.299) |
| Income quartile 2 | –79.546 (134.427) |
| Income quartile 3 | –78.194 (132.996) |
| Income quartile 4 | –110.160 (136.147) |
| Durable consumption class 1 | –56.990 (131.605) |
| Durable consumption class 2 | –52.810 (141.930) |
| Durable consumption class 3 | –84.604 (141.588) |
| Durable consumption class 5 | 1,204.870*** (194.763) |
| Observations | 17,368 |
| R-squared | 0.021 |
-
Notes: Probability weights have been used. Robust standard errors in parentheses.
-
***P<0.01, **P<0.005, *P<0.1
Spread: Linear regression model
| Primary school certificate | 2.067** (0.853) |
|---|---|
| Lower secondary school certificate | 1.518* (0.824) |
| Upper secondary school | 1.326 (0.825) |
| University degree | 1.069 (0.827) |
| Postgraduate qualification | 0.903 (0.851) |
| Centre | 0.159 (0.097) |
| South | 0.806*** (0.113) |
| Self-employed | 0.241** (0.113) |
| Not working | 0.269** (0.126) |
| Constant | –0.738 (0.824) |
| Observations | 2,593 |
| R-squared | 0.048 |
-
Notes: Robust standard errors in parentheses.
-
***P<0.1, **P<0.05, *P<0.01
Macroeconomic inputs
| Growth rate of income | Growth rate of mortgages | Growth rate of consumer credit | Annual change in 3-month Euribor | Annual change in 10-year IRS | Growth rate of durable consumption | |
|---|---|---|---|---|---|---|
| (%) | (%) | (%) | (basis points) | (basis points) | (%) | |
| (1) | (2) | (3) | (4) | (5) | (6) | |
| 2013 | 0.51 | −1.22 | −1.88 | 0.08 | −0.06 | −4.62 |
| 2014 | 0.74 | −0.80 | −0.85 | −0.19 | −0.45 | 6.39 |
| 2015 | 1.49 | 0.41 | 4.59 | −0.21 | −0.57 | 8.23 |
| 2016 | 1.47 | 1.79 | 8.25 | −0.19 | −0.35 | 5.01 |
| 2017 | 1.66 | 2.26 | 9.06 | −0.012 | 0.30 | 4.25 |
| 2018* | 2.77 | 2.61 | 9.01 | 0.025 | 0.16 | 0.16 |
| 2019* | 3.02 | 1.19 | 8.07 | 0.217 | 0.31 | 0.31 |
-
Notes: Historical data for 2013–17 are based on national accounts (Columns 1 and 6), supervisory reports (Columns 2 and 3) and MIR data (Columns 4 and 5). * indicates the macroeconomic projections for 2018–19 used in the paper, which may differ from realized data and from confidential forecasts based on the macroeconometric model developed at the Bank of Italy.
Data and code availability
The SHIW data are publicy available (https://www.bancaditalia.it/statistiche/tematiche/indagini-famiglie-imprese/bilanci-famiglie/distribuzione-microdati/index.html).
The code is proprietary to the Bank of Italy and cannot be shared.