Introducing CASCADEPOP: an open-source sociodemographic simulation platform for US health policy appraisal
- School of Health and Related Research, UK
- Department of Automatic Control and Systems Engineering, UK
- Institute for Mental Health Policy Research, Canada
- Heidelberg Institute of Global Health, Universitätsklinikum Heidelberg, Germany
- Alcohol Research Group (ARG), USA
- School of Clinical Dentistry, UK
- Dalla Lana School of Public Health and Department of Psychiatry, Canada
- Department of International Health Projects, Russian Federation
Figures

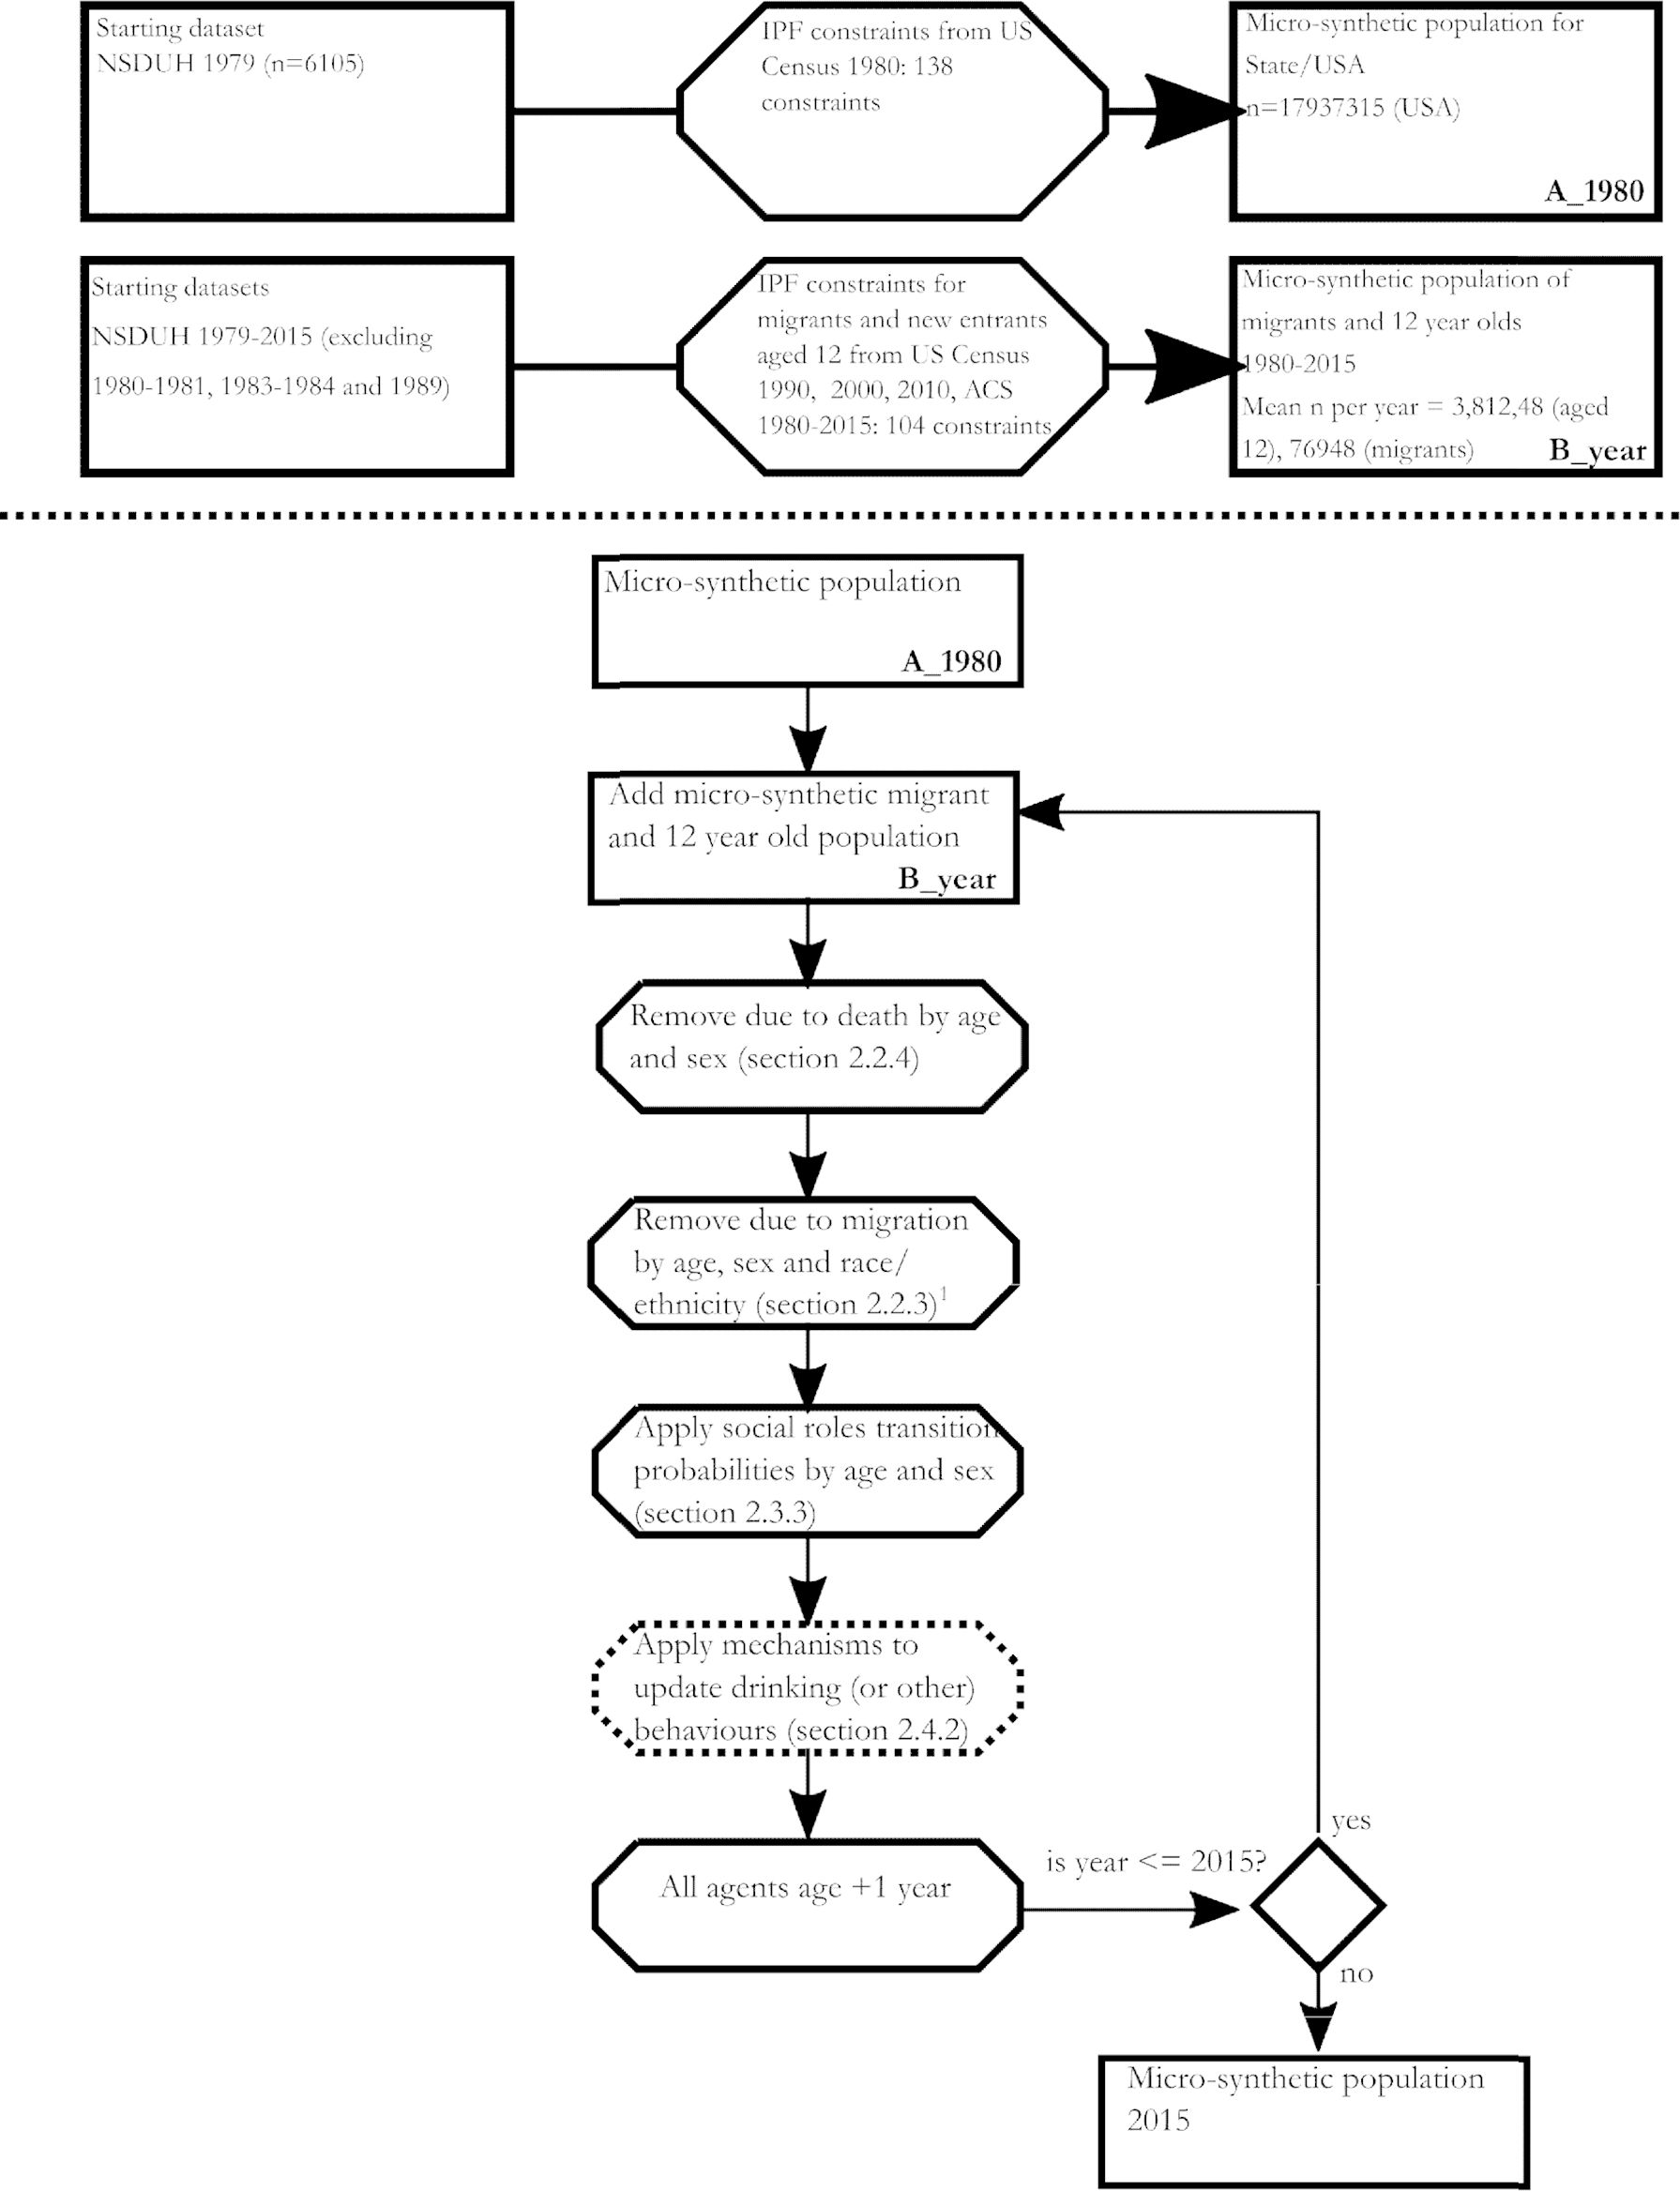
Schematic describing the steps taken to generate the baseline and migrant and 12-year-old populations over time, and the steps taken during each year of the microsimulation over time.

Validation of Micro-synthesis for the USA 1980:- modelled synthetic population compared to observed 1980 Census data for age, sex, race/ethnicity, education, social roles status and income.

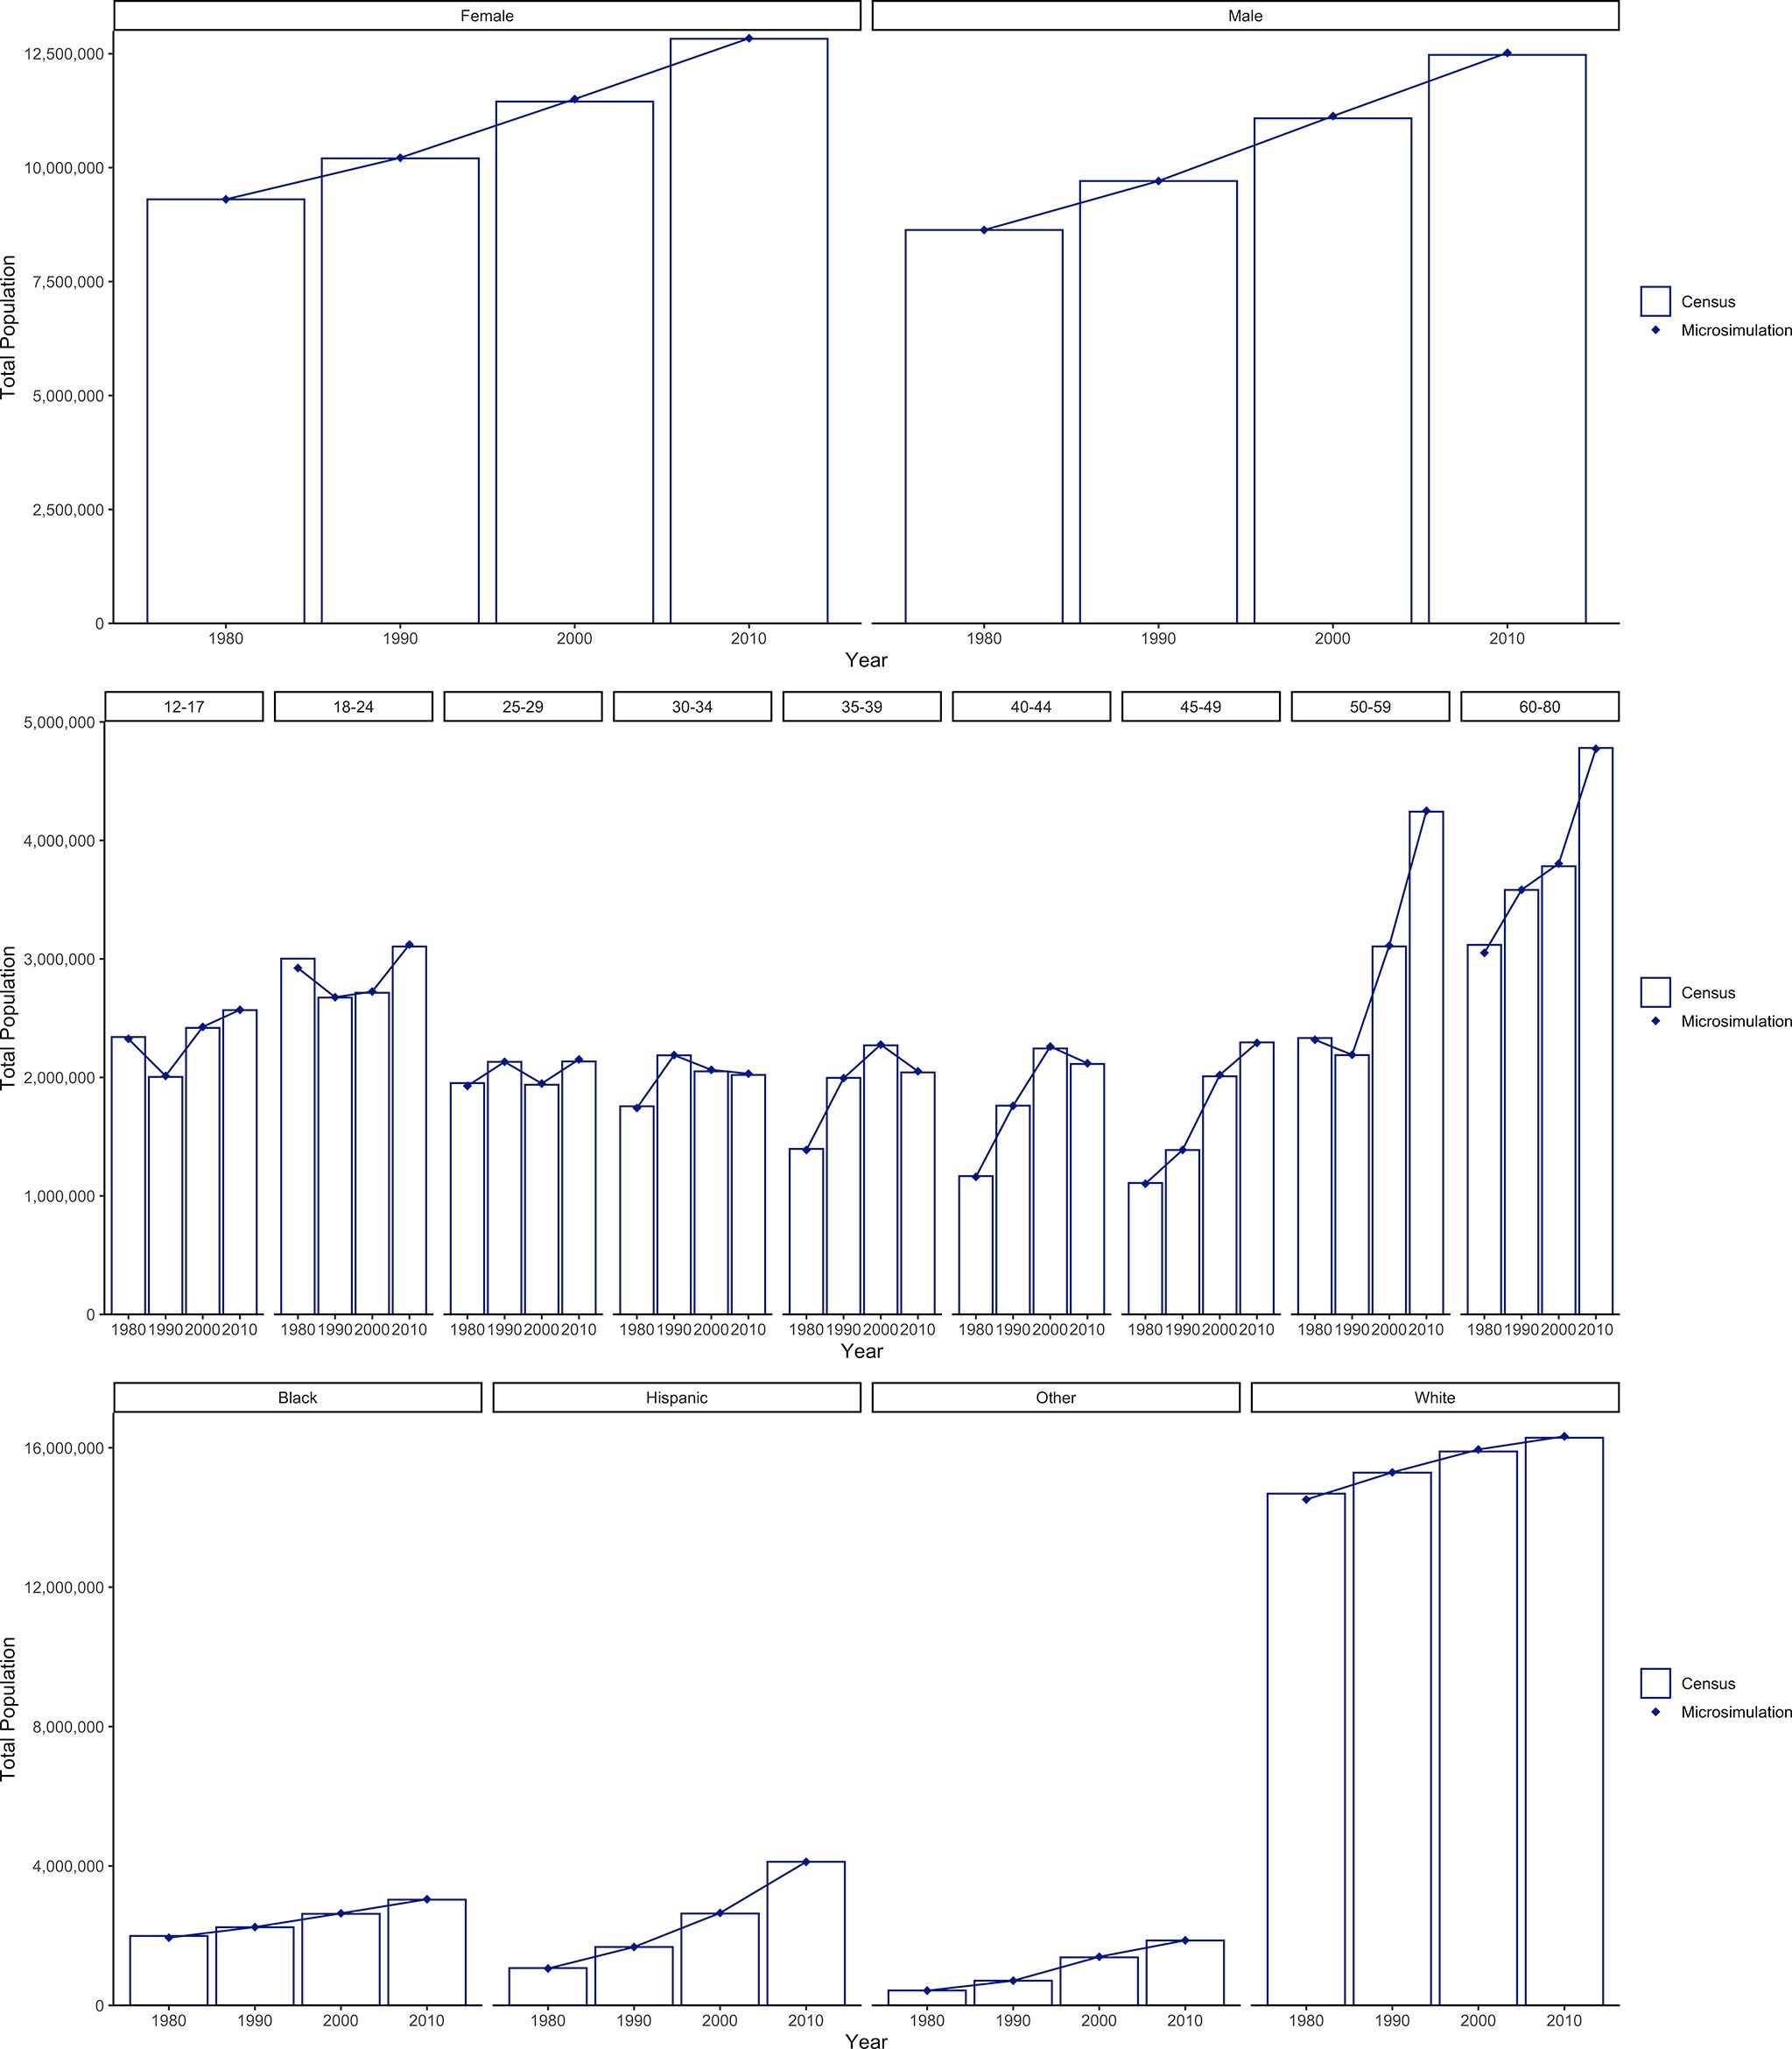
Validation over 30 years: Comparison of microsimulation population with observed US Census data by sex, age and race/ethnicity for the USA in 1980, 1990, 2000 and 2010.

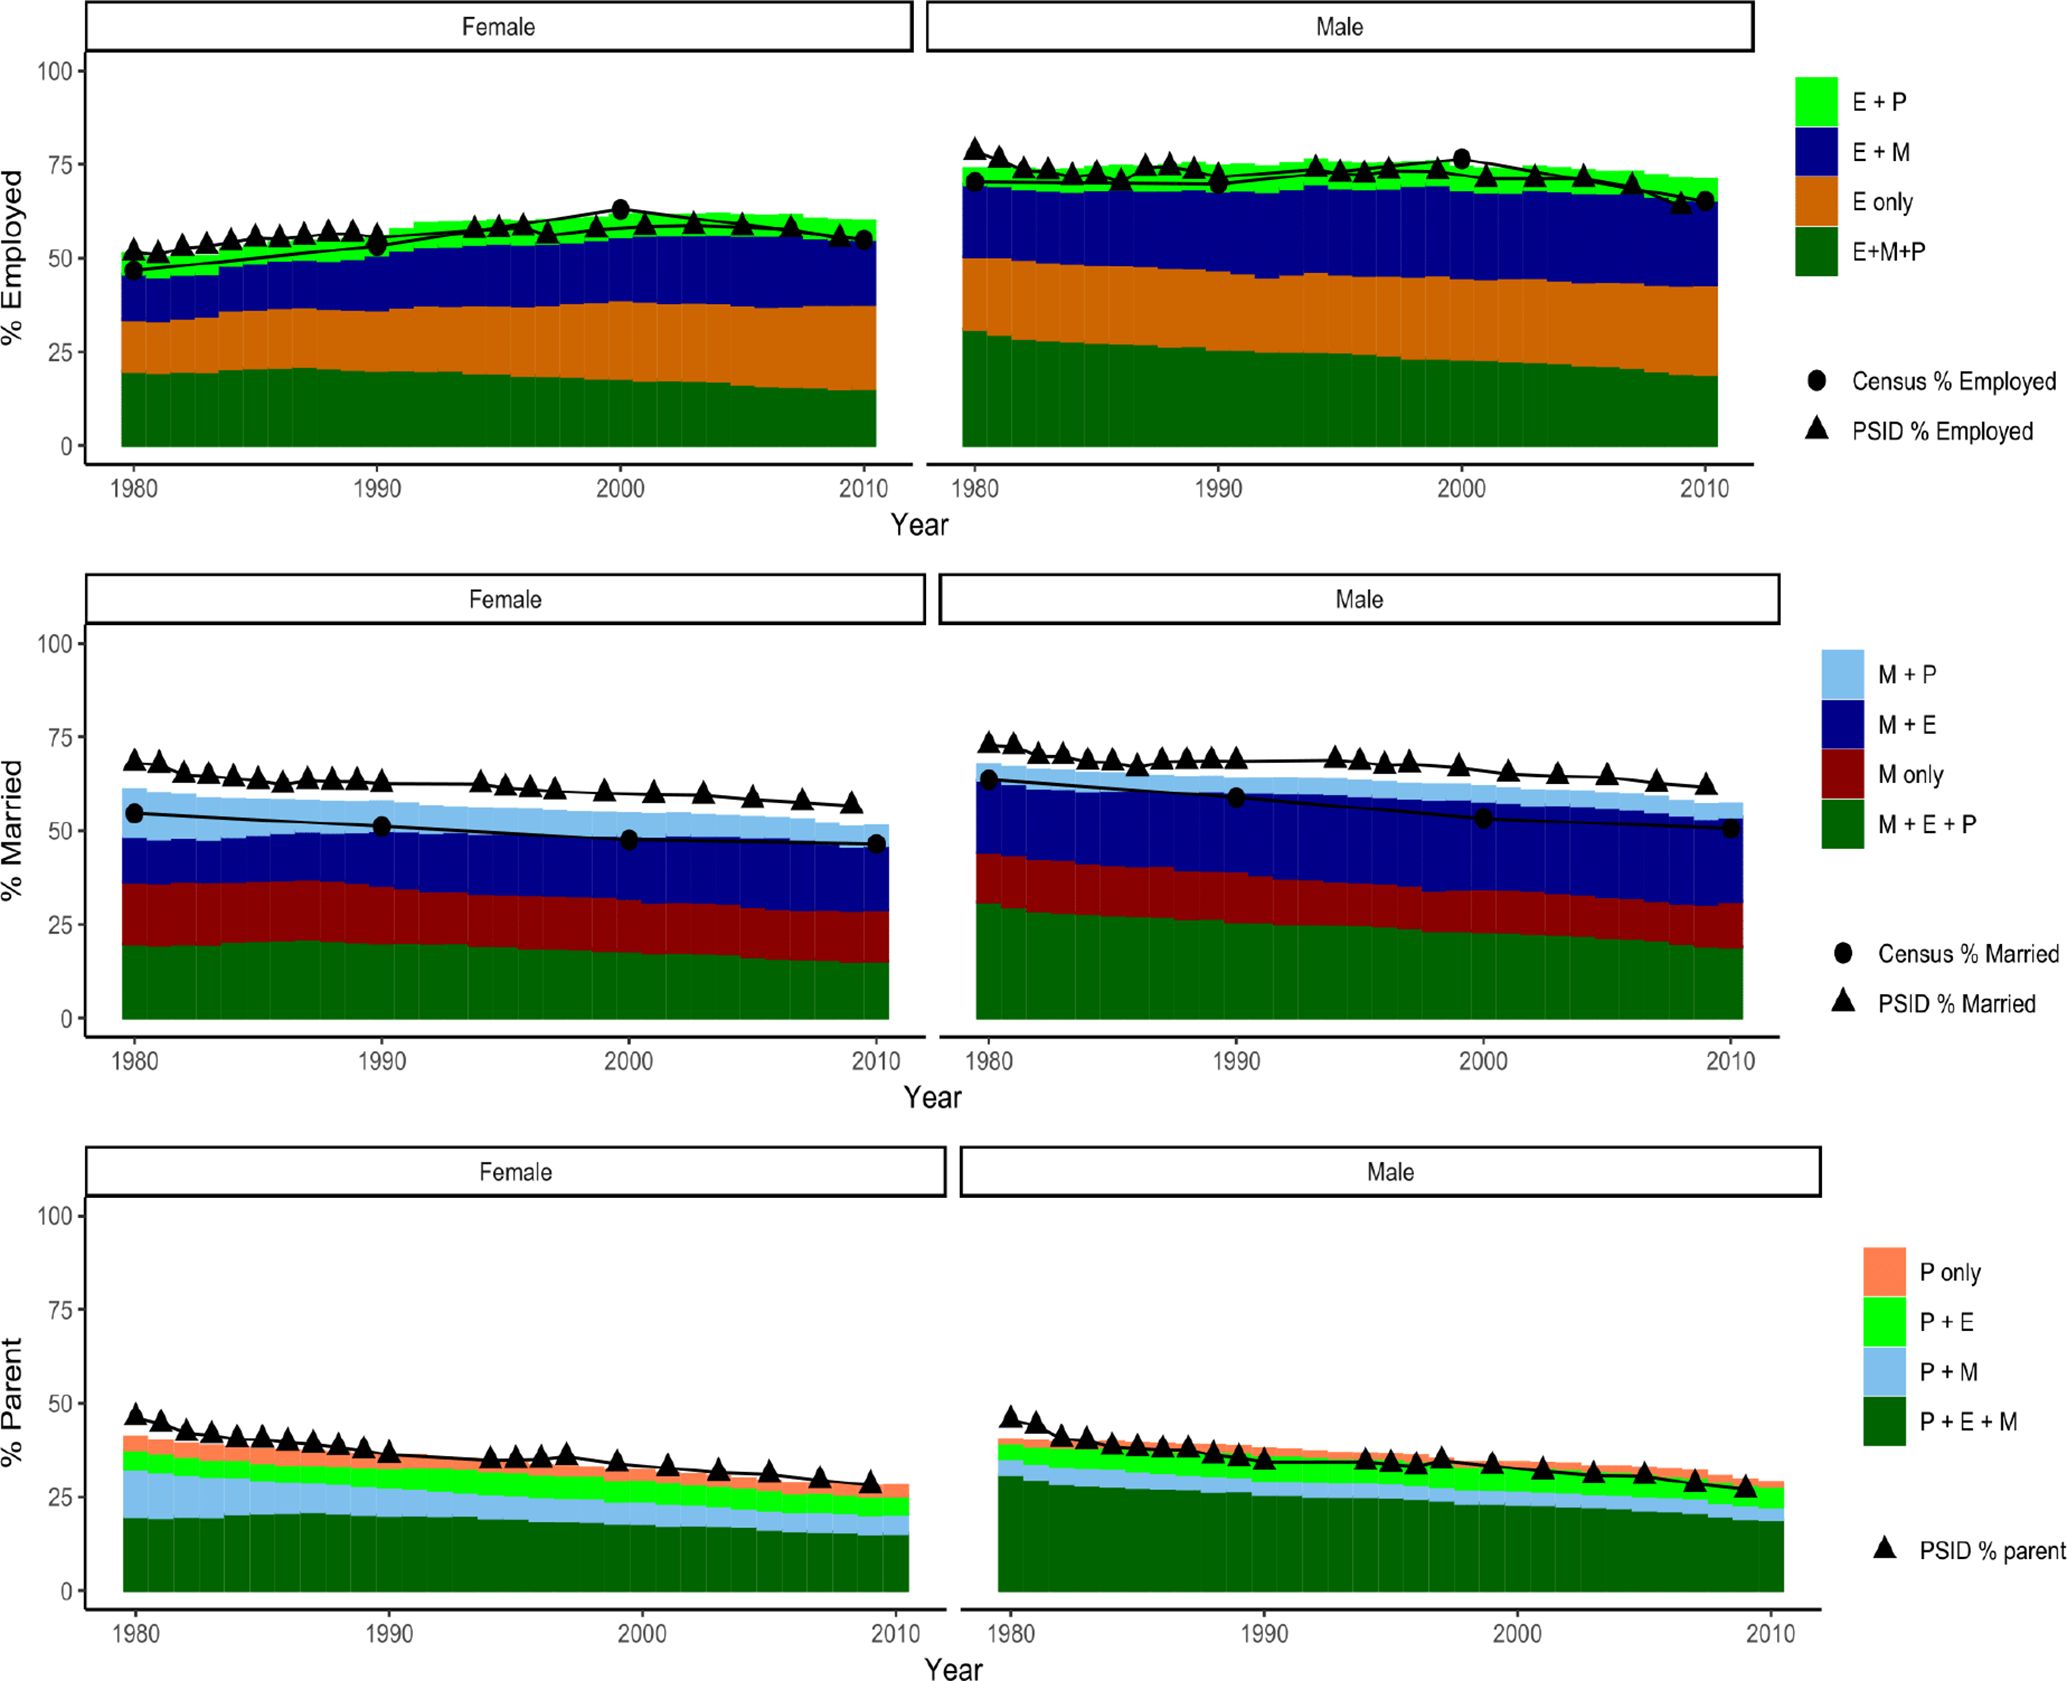
Validation over 30 years. Comparison of microsimulation population social roles with observed US Census data (employment and marriage) and PSID data (parenting) for the United States 1980-2010
Tables
Exemplar transition matrix for the period 1993-1999 for females aged 27.
| _ _ _ | _ _ P | _ M _ | E _ _ | _ M P | E M _ | E _ P | E M P | ||
|---|---|---|---|---|---|---|---|---|---|
| 1993-1999 | _ _ _ | 0.649 | 0.025 | 0.017 | 0.280 | 0.003 | 0.014 | 0.010 | 0.001 |
| 1993-1999 | _ _ P | 0.013 | 0.605 | <0.001 | 0.008 | 0.054 | <0.001 | 0.298 | 0.021 |
| 1993-1999 | _ M _ | 0.025 | 0.001 | 0.537 | 0.012 | 0.118 | 0.261 | 0.001 | 0.045 |
| 1993-1999 | E _ _ | 0.087 | 0.003 | 0.004 | 0.816 | 0.001 | 0.059 | 0.026 | 0.005 |
| 1993-1999 | _ M P | <0.001 | 0.010 | 0.005 | <0.001 | 0.677 | 0.003 | 0.007 | 0.297 |
| 1993-1999 | E M _ | 0.004 | <0.001 | 0.079 | 0.035 | 0.013 | 0.757 | 0.002 | 0.110 |
| 1993-1999 | E _ P | 0.003 | 0.091 | <0.001 | 0.030 | 0.006 | 0.001 | 0.817 | 0.051 |
| 1993-1999 | E M P | <0.001 | 0.002 | 0.001 | 0.001 | 0.083 | 0.013 | 0.025 | 0.876 |
Validation of Micro-synthesis for the USA 1980: modelled synthetic population compared to observed 1980 Census data for age, sex, race/ethnicity, education, social roles status and income.
| Female | Male | |||||
|---|---|---|---|---|---|---|
| Census | Micro-synthesis | Difference | Census | Micro-synthesis | Difference | |
| Age category | ||||||
| 12-13 | 350229 | 350205 | -0.007% | 363772 | 363800 | 0.009% |
| 14-17 | 791699 | 791646 | -0.007% | 819431 | 819457 | 0.003% |
| 18-19 | 428371 | 428374 | 0.001% | 416172 | 416174 | 0.001% |
| 20-22 | 643066 | 643061 | -0.001% | 614279 | 614288 | 0.001% |
| 23-24 | 417044 | 417041 | -0.001% | 404086 | 404082 | -0.001% |
| 25-28 | 788183 | 788182 | 0.001% | 764900 | 764913 | 0.002% |
| 29-30 | 377449 | 377447 | 0.001% | 366634 | 366636 | 0.001% |
| 31-34 | 698488 | 698489 | 0.001% | 673779 | 673785 | 0.001% |
| 35-39 | 708491 | 708494 | 0.001% | 678687 | 678684 | -0.001% |
| 40-44 | 594513 | 594520 | 0.001% | 565942 | 565942 | -0.001% |
| 45-49 | 568258 | 568258 | 0.001% | 534878 | 534884 | 0.001% |
| 50-59 | 1216357 | 1216358 | 0.001% | 1101383 | 1101380 | -0.001% |
| 60-80 | 1722769 | 1722765 | 0.001% | 1328453 | 1328450 | -0.001% |
| Race | ||||||
| Non-hispanic black | 1057394 | 1057385 | -0.001% | 884885 | 884883 | 0.001% |
| Hispanic | 538344 | 538341 | 0.001% | 519074 | 519080 | 0.001% |
| Non-hispanic other | 217081 | 217077 | -0.002% | 205423 | 205428 | 0.002% |
| Non-hispanic white | 7492101 | 7492037 | -0.001% | 7023014 | 7023084 | 0.001% |
| Education | ||||||
| High school graduate | 6737070 | 6736982 | -0.001% | 5927517 | 5927574 | 0.001% |
| Some college | 1565697 | 1565708 | 0.001% | 1361130 | 1361140 | 0.001% |
| College + | 1002151 | 1002150 | -0.001% | 1343748 | 1343761 | 0.001% |
| Social roles | ||||||
| Employed | 4172331 | 4172328 | 0.001% | 5688374 | 5688393 | 0.001% |
| Unemployed | 5132587 | 5132512 | -0.001% | 2944021 | 2944082 | 0.002% |
| Married | 4998998 | 4999000 | 0.000% | 5008429 | 5008440 | 0.000% |
| Unmarried | 4305920 | 4305840 | -0.002% | 3623966 | 3624035 | 0.002% |
| Not parent | 5854373 | 5854284 | -0.002% | 5510957 | 5511025 | 0.001% |
| Parent | 3450545 | 3450556 | 0.000% | 3121438 | 3121450 | 0.000% |
| Income category | ||||||
| $0-$6999 | 1162186 | 1162200 | 0.001% | 595240 | 595247 | 0.001% |
| $7000-$9999 | 728592 | 728572 | -0.003% | 525864 | 525871 | 0.001% |
| $10000-$14999 | 1170164 | 1170154 | -0.001% | 928740 | 928736 | 0.000% |
| $15000-$19999 | 1032560 | 1032568 | 0.001% | 1045736 | 1045737 | 0.000% |
| $20000-$24999 | 1054906 | 1054900 | -0.001% | 1100713 | 1100716 | 0.000% |
| $25000-$29999 | 1452311 | 1452312 | 0.000% | 1570514 | 1570508 | 0.000% |
| $30000+ | 1562268 | 1562283 | 0.001% | 1682380 | 1682403 | 0.001% |
| youth-no income | 1141928 | 1141851 | -0.007% | 1183202 | 1183257 | 0.005% |
Population counts of individuals holding social roles from the Census compared to the microsimulation.
| California | Minnesota | New York | Tennessee | Texas | US | |
|---|---|---|---|---|---|---|
| Social Role Combination | ||||||
| _ _ _ | 399,495 | 65,449 | 333,353 | 77,874 | 220,355 | 3,864,726 |
| _ _ P | 60,378 | 5,848 | 53,551 | 10,807 | 29,980 | 522,189 |
| _ M _ | 209,202 | 42,456 | 189,861 | 54,541 | 122,314 | 2,439,605 |
| E _ _ | 335,976 | 53,877 | 228,962 | 49,159 | 170,089 | 2,782,588 |
| _ M P | 162,057 | 22,544 | 111,788 | 32,301 | 102,662 | 1,484,920 |
| E M _ | 201,329 | 42,494 | 142,986 | 43,569 | 141,361 | 2,119,030 |
| E _ P | 123,002 | 16,391 | 97,333 | 18,978 | 55,532 | 1,026,699 |
| E M P | 430,076 | 76,084 | 277,627 | 82,297 | 279,061 | 3,999,107 |
| % difference versus observed data | ||||||
| Married | 0.0001% | 0.0008% | 0.0003% | 0.0024% | 0.0009% | 0.0001% |
| Not married | 0.0001% | 0.0010% | 0.0003% | 0.0032% | 0.0012% | 0.0001% |
| Employed | 0.0001% | 0.0013% | 0.0002% | 0.0016% | 0.0003% | 0.0000% |
| Not Employed | 0.0001% | 0.0018% | 0.0002% | 0.0017% | 0.0004% | 0.0000% |
| Parent | 0.0003% | 0.0017% | 0.0004% | 0.0044% | 0.0008% | 0.0001% |
| Not Parent | 0.0002% | 0.0010% | 0.0003% | 0.0028% | 0.0005% | 0.0001% |
-
Notes: each possible combination using the abbreviations E – employed, M – married, P – parent, _ - not
Implied baseline drinking prevalence, quantity, frequency and heavy drinking for each of the modelled geographies compared to US alcohol use data (NSDUH) with 95% CI.
| State | Alcohol use prevalence | Mean alcohol use quantity (grams per day) | Mean alcohol use frequency (days per month) | Mean 5+ drink days per month |
|---|---|---|---|---|
| California | 72.17% | 8.22 | 7.04 | 0.95 |
| Minnesota | 72.14% | 8.38 | 7.07 | 0.98 |
| New York | 70.01% | 8.09 | 6.94 | 0.96 |
| Tennessee | 68.88% | 8.16 | 6.91 | 0.99 |
| Texas | 71.58% | 7.90 | 6.79 | 0.94 |
| USA | 70.33% | 8.18 | 6.97 | 0.97 |
| NSDUH, 2019 data | 72.96% [70.58, 75.33] | 8.44 [7.75, 9.13] | 6.88 [6.44, 7.31] | 0.88 [0.77, 0.99] |
Validation over 30 years: Comparison of microsimulation population with observed US Census data by sex, age and race/ethnicity for the USA in 1990, 2000 and 2010.
| 1990 | 2000 | 2010 | |||||||
|---|---|---|---|---|---|---|---|---|---|
| Census | Microsimulation | Difference | Census | Microsimulation | Difference | Census | Microsimulation | Difference | |
| Non-hispanic black | 2242309 | 2247300 | 0.22% | 2626753 | 2640870 | 0.54% | 3032982 | 3045380 | 0.41% |
| Hispanic | 1675274 | 1674900 | -0.02% | 2635389 | 2652050 | 0.63% | 4119840 | 4118710 | -0.03% |
| Non-hispanic other | 707779 | 708070 | 0.04% | 1377643 | 1394650 | 1.23% | 1861652 | 1865980 | 0.23% |
| Non-hispanic white | 15285788 | 15293890 | 0.05% | 15893199 | 15950070 | 0.36% | 16287723 | 16328920 | 0.25% |
| Female | 10204297 | 10217040 | 0.12% | 11450460 | 11505330 | 0.48% | 12828100 | 12838960 | 0.08% |
| Male | 9706853 | 9707120 | 0.00% | 11082530 | 11132310 | 0.45% | 12474100 | 12520030 | 0.37% |
| 12-17 | 2004212 | 2012300 | 0.40% | 2417936 | 2426610 | 0.36% | 2567835 | 2570450 | 0.10% |
| 18-24 | 2673777 | 2676540 | 0.10% | 2714345 | 2724760 | 0.38% | 3104722 | 3121590 | 0.54% |
| 25-29 | 2131305 | 2131710 | 0.02% | 1938134 | 1948060 | 0.51% | 2134600 | 2151870 | 0.81% |
| 30-34 | 2186289 | 2188090 | 0.08% | 2051039 | 2063780 | 0.62% | 2021027 | 2031350 | 0.51% |
| 35-39 | 1996312 | 1993430 | -0.14% | 2270666 | 2276720 | 0.27% | 2042091 | 2051510 | 0.46% |
| 40-44 | 1761579 | 1760510 | -0.06% | 2244186 | 2260780 | 0.74% | 2113322 | 2118880 | 0.26% |
| 45-49 | 1387257 | 1387940 | 0.05% | 2009240 | 2020340 | 0.55% | 2295657 | 2290950 | -0.21% |
| 50-59 | 2188227 | 2190440 | 0.10% | 3105479 | 3112160 | 0.22% | 4242635 | 4249330 | 0.16% |
| 60-80 | 3582194 | 3583200 | 0.03% | 3781961 | 3804430 | 0.59% | 4780309 | 4773060 | -0.15% |
Validation over 30 years. Comparison of microsimulation population social roles with observed US Census data (employment and marriage) and PSID data (parenting) for the United States 1980-2010
| Female | Male | |||||
|---|---|---|---|---|---|---|
| % | 1990 | 2000 | 2010 | 1990 | 2000 | 2010 |
| E only | 16.10 | 20.86 | 22.52 | 21.07 | 21.69 | 23.91 |
| E + M | 14.71 | 16.78 | 17.21 | 20.93 | 23.40 | 22.63 |
| E + P | 5.09 | 5.89 | 5.04 | 6.71 | 6.03 | 5.37 |
| E + M + P | 20.03 | 18.05 | 15.26 | 25.81 | 23.08 | 19.01 |
| Total Employed | 55.93 | 61.57 | 60.02 | 74.52 | 74.20 | 70.92 |
| Employed Census | 53.27 | 63.06 | 54.89 | 69.79 | 76.43 | 65.16 |
| Employed PSID | 55.51 | 57.57 | 55.22 | 71.64 | 73.14 | 63.89 |
| Difference (Microsimulation and Census) | 2.66 | -1.49 | 5.13 | 4.73 | -2.24 | 5.76 |
| M only | 15.37 | 13.83 | 13.64 | 13.45 | 11.47 | 12.11 |
| M + E | 14.71 | 16.78 | 17.21 | 20.93 | 23.40 | 22.63 |
| M + P | 7.60 | 5.86 | 5.11 | 3.66 | 3.81 | 3.43 |
| M + E + P | 20.03 | 18.05 | 15.26 | 25.81 | 23.08 | 19.01 |
| Total Married | 57.71 | 54.51 | 51.22 | 63.85 | 61.76 | 57.17 |
| Married Census | 51.18 | 47.58 | 46.45 | 58.89 | 53.23 | 50.59 |
| Married PSID | 62.51 | 59.97 | 56.67 | 68.55 | 66.75 | 61.61 |
| Difference (Microsimulation and census) | 6.53 | 6.93 | 4.77 | 4.97 | 8.52 | 6.58 |
| P only | 3.36 | 2.20 | 2.55 | 1.69 | 1.25 | 1.12 |
| P + E | 5.09 | 5.89 | 5.04 | 6.71 | 6.03 | 5.37 |
| P + M | 7.60 | 5.86 | 5.11 | 3.66 | 3.81 | 3.43 |
| P + E + M | 20.03 | 18.05 | 15.26 | 25.81 | 23.08 | 19.01 |
| Total Parent | 36.08 | 31.99 | 27.96 | 37.87 | 34.17 | 28.93 |
| Parent PSID | 36.24 | 33.87 | 28.16 | 34.29 | 33.27 | 27.07 |
| Difference (Microsimulation and PSID) | -0.16 | -1.88 | -0.20 | 3.58 | 0.90 | 1.86 |
Census race/ethnicity categories and synthetic population re-coded race/ethnicity categories
| Micro-synthetic population category | Census 1980 race categorizations |
|---|---|
| White (non-hispanic) | Not Spanish origin: white |
| Black (non-hispanic) | Not Spanish origin: black |
| Other (non-hispanic) | Not Spanish origin: American Indian, Eskimo, Aleut, Asian, Pacific Islander |
| Hispanic origin | Spanish Origin |
Census and micro-synthesis employment categories
| Micro-synthetic population category | Census 1980 employment categorizations |
|---|---|
| Employed | Labor force: employed |
| Unemployed | Labor force: unemployed, not in labor force |
Exemplar Census constraints for California in 1980
| Black 12-13 Female |
Black 12-13 Male |
Black 14-17 Female |
Black 14-17 Male |
|
|---|---|---|---|---|
| California | 33005 | 33216 | 74293 | 73992 |
Example of NSDUH individuals re-coded for IPF procedure
| Black 12-13 Female |
Black 12-13 Male |
Black 14-17 Female |
Black 14-17 Male |
|
|---|---|---|---|---|
| NSDUH Individual 1 |
1 | 0 | 0 | 0 |
| NSDUH Individual 2 |
0 | 0 | 1 | 0 |
Weights for three exemplar NSDUH individuals for California
| NSDUH individual | California weight |
|---|---|
| Individual 1 | 5591.98 |
| Individual 2 | 2916.01 |
| Individual 3 | 3010.67 |
Transition count matrix; number of single transitions between social roles states available in PSID
| To | |||||||||
|---|---|---|---|---|---|---|---|---|---|
| Year period | From | _ _ _ | _ _ P | _ M _ | E _ _ | _ M P | E M _ | E _ P | E M P |
| 1979-1983 | _ _ _ | 5660 | 73 | 98 | 1670 | 2 | 117 | 32 | 2 |
| 1979-1983 | _ _ P | 50 | 984 | 1 | 19 | 70 | 0 | 357 | 7 |
| 1979-1983 | _ M _ | 187 | 0 | 9778 | 15 | 279 | 1040 | 0 | 114 |
| 1979-1983 | E _ _ | 1327 | 63 | 88 | 9229 | 4 | 683 | 188 | 33 |
| 1979-1983 | _ M P | 10 | 63 | 324 | 16 | 7123 | 125 | 35 | 2456 |
| 1979-1983 | E M _ | 25 | 13 | 1899 | 278 | 298 | 12523 | 25 | 987 |
| 1979-1983 | E _ P | 46 | 326 | 0 | 237 | 15 | 22 | 2256 | 110 |
| 1979-1983 | E M P | 8 | 14 | 123 | 91 | 1983 | 1127 | 237 | 22725 |
| 1984-1992 | _ _ _ | 7916 | 115 | 121 | 1924 | 20 | 142 | 87 | 4 |
| 1984-1992 | _ _ P | 91 | 1253 | 3 | 22 | 75 | 4 | 523 | 34 |
| 1984-1992 | _ M _ | 363 | 3 | 15513 | 86 | 332 | 1929 | 2 | 225 |
| 1984-1992 | E _ _ | 1954 | 66 | 108 | 14990 | 11 | 1027 | 418 | 58 |
| 1984-1992 | _ M P | 8 | 66 | 394 | 9 | 5680 | 134 | 37 | 3028 |
| 1984-1992 | E M _ | 67 | 2 | 2659 | 340 | 183 | 16588 | 14 | 1383 |
| 1984-1992 | E _ P | 35 | 562 | 4 | 300 | 36 | 19 | 3261 | 173 |
| 1984-1992 | E M P | 2 | 33 | 177 | 50 | 2663 | 1811 | 257 | 27641 |
| 1993-1999 | _ _ _ | 9464 | 86 | 98 | 1699 | 11 | 117 | 52 | 22 |
| 1993-1999 | _ _ P | 104 | 988 | 3 | 55 | 58 | 1 | 389 | 43 |
| 1993-1999 | _ M _ | 437 | 1 | 13984 | 41 | 181 | 1200 | 12 | 75 |
| 1993-1999 | E _ _ | 1561 | 74 | 95 | 13410 | 18 | 882 | 338 | 119 |
| 1993-1999 | _ M P | 7 | 44 | 291 | 15 | 3979 | 85 | 22 | 1661 |
| 1993-1999 | E M _ | 64 | 0 | 2096 | 438 | 180 | 18679 | 24 | 1109 |
| 1993-1999 | E _ P | 68 | 298 | 0 | 552 | 36 | 24 | 3600 | 187 |
| 1993-1999 | E M P | 8 | 37 | 97 | 104 | 1363 | 1560 | 300 | 21779 |
| 2000-2007 | _ _ _ | 8660 | 136 | 157 | 2108 | 54 | 197 | 131 | 139 |
| 2000-2007 | _ _ P | 257 | 624 | 14 | 114 | 68 | 2 | 332 | 54 |
| 2000-2007 | _ M _ | 1010 | 31 | 11729 | 96 | 219 | 1398 | 31 | 169 |
| 2000-2007 | E _ _ | 2119 | 122 | 159 | 12412 | 121 | 1258 | 580 | 660 |
| 2000-2007 | _ M P | 94 | 74 | 496 | 78 | 2709 | 329 | 97 | 1634 |
| 2000-2007 | E M _ | 227 | 15 | 3320 | 738 | 393 | 15780 | 59 | 1901 |
| 2000-2007 | E _ P | 138 | 311 | 23 | 823 | 52 | 160 | 2348 | 344 |
| 2000-2007 | E M P | 97 | 40 | 512 | 422 | 1339 | 3549 | 386 | 16740 |
| 2008-2015 | _ _ _ | 5660 | 73 | 98 | 1670 | 2 | 117 | 32 | 2 |
| 2008-2015 | _ _ P | 50 | 984 | 1 | 19 | 70 | 0 | 357 | 7 |
| 2008-2015 | _ M _ | 187 | 0 | 9778 | 15 | 279 | 1040 | 0 | 114 |
| 2008-2015 | E _ _ | 1327 | 63 | 88 | 9229 | 4 | 683 | 188 | 33 |
| 2008-2015 | _ M P | 10 | 63 | 324 | 16 | 7123 | 125 | 35 | 2456 |
| 2008-2015 | E M _ | 25 | 13 | 1899 | 278 | 298 | 12523 | 25 | 987 |
| 2008-2015 | E _ P | 46 | 326 | 0 | 237 | 15 | 22 | 2256 | 110 |
| 2008-2015 | E M P | 8 | 14 | 123 | 91 | 1983 | 1127 | 237 | 22725 |
Transition intensities with hazard ratios (95% CI). Baselines are with covariates set to 01
| Transition | Baseline | Sex (male=1) | Age | Age squared | |
|---|---|---|---|---|---|
| 1979-1983 | _ _ _ > _ _ _ | -0.192 (-0.207, -0.178) | - | - | - |
| 1979-1983 | _ _ _ > _ _ P | 0.005 (0.004, 0.007) | 1.373 (1.231, 1.531) | 3.567 (1.912, 6.654) | 0.034 (0.015, 0.081) |
| 1979-1983 | _ _ _ > _ M _ | 0.015 (0.012, 0.019) | 0.944 (0.840, 1.062) | 0.703 (0.430, 1.149) | 0.585 (0.307, 1.113) |
| 1979-1983 | _ _ _ > E _ _ | 0.172 (0.158, 0.186) | 1.696 (1.584, 1.815) | 2.452 (1.942, 3.095) | 0.114 (0.085, 0.151) |
| 1979-1983 | _ _ P > _ _ _ | 0.053 (0.040, 0.072) | 0.963 (0.867, 1.070) | 17.507 (9.658, 31.733) | 0.193 (0.100, 0.373) |
| 1979-1983 | _ _ P > _ _ P | -0.227 (-0.252, -0.204) | - | - | - |
| 1979-1983 | _ _ P > _ M P | 0.029 (0.023, 0.038) | 0.944 (0.840, 1.062) | 0.703 (0.430, 1.149) | 0.585 (0.307, 1.113) |
| 1979-1983 | _ _ P > E _ P | 0.144 (0.129, 0.162) | 1.696 (1.584, 1.815) | 2.452 (1.942, 3.095) | 0.114 (0.085, 0.151) |
| 1979-1983 | _ M _ > _ _ _ | 0.022 (0.018, 0.026) | 0.531 (0.463, 0.608) | 0.068 (0.046, 0.101) | 14.837 (9.459, 23.271) |
| 1979-1983 | _ M _ > _ M _ | -0.231 (-0.244, -0.218) | - | - | - |
| 1979-1983 | _ M _ > _ M P | 0.040 (0.035, 0.047) | 0.802 (0.672, 0.957) | 0.018 (0.011, 0.030) | 14.050 (8.195, 24.089) |
| 1979-1983 | _ M _ > E M _ | 0.169 (0.158, 0.180) | 1.696 (1.584, 1.815) | 2.452 (1.942, 3.095) | 0.114 (0.085, 0.151) |
| 1979-1983 | E _ _ > _ _ _ | 0.220 (0.207, 0.234) | 0.544 (0.514, 0.575) | 0.024 (0.020, 0.028) | 93.597 (75.799, 115.573) |
| 1979-1983 | E _ _ > E _ _ | -0.259 (-0.274, -0.245) | - | - | - |
| 1979-1983 | E _ _ > E M _ | 0.036 (0.031, 0.042) | 0.944 (0.840, 1.062) | 0.703 (0.430, 1.149) | 0.585 (0.307, 1.113) |
| 1979-1983 | E _ _ > E _ P | 0.003 (0.003, 0.004) | 1.373 (1.231, 1.531) | 3.567 (1.912, 6.654) | 0.034 (0.015, 0.081) |
| 1979-1983 | _ M P > _ _ P | 0.009 (0.007, 0.012) | 0.531 (0.463, 0.608) | 0.068 (0.046, 0.101) | 14.837 (9.459, 23.271) |
| 1979-1983 | _ M P > _ M _ | 0.049 (0.043, 0.055) | 1.247 (1.044, 1.488) | 55.195 (33.654, 90.524) | 0.071 (0.042, 0.122) |
| 1979-1983 | _ M P > _ M P | -0.195 (-0.206, -0.185) | - | - | - |
| 1979-1983 | _ M P > E M P | 0.137 (0.129, 0.146) | 1.696 (1.584, 1.815) | 2.452 (1.942, 3.095) | 0.114 (0.085, 0.151) |
| 1979-1983 | E M _ > _ M _ | 0.280 (0.266, 0.294) | 0.544 (0.514, 0.575) | 0.024 (0.020, 0.028) | 93.597 (75.799, 115.573) |
| 1979-1983 | E M _ > E _ _ | 0.033 (0.029, 0.038) | 0.531 (0.463, 0.608) | 0.068 (0.046, 0.101) | 14.837 (9.459, 23.271) |
| 1979-1983 | E M _ > E M _ | -0.337 (-0.352, -0.321) | - | - | - |
| 1979-1983 | E M _ > E M P | 0.024 (0.020, 0.029) | 1.373 (1.231, 1.531) | 3.567 (1.912, 6.654) | 0.034 (0.015, 0.081) |
| 1979-1983 | E _ P > _ _ P | 0.308 (0.275, 0.345) | 0.544 (0.514, 0.575) | 0.024 (0.020, 0.028) | 93.597 (75.799, 115.573) |
| 1979-1983 | E _ P > E _ _ | 0.167 (0.144, 0.193) | 0.963 (0.867, 1.070) | 17.507 (9.658, 31.733) | 0.193 (0.100, 0.373) |
| 1979-1983 | E _ P > E _ P | -0.500 (-0.544, -0.460) | - | - | - |
| 1979-1983 | E _ P > E M P | 0.025 (0.020, 0.031) | 0.944 (0.840, 1.062) | 0.703 (0.430, 1.149) | 0.585 (0.307, 1.113) |
| 1979-1983 | E M P > _ M P | 0.254 (0.240, 0.270) | 0.544 (0.514, 0.575) | 0.024 (0.020, 0.028) | 93.597 (75.799, 115.573) |
| 1979-1983 | E M P > E M _ | 0.070 (0.062, 0.080) | 0.963 (0.867, 1.070) | 17.507 (9.658, 31.733) | 0.193 (0.100, 0.373) |
| 1979-1983 | E M P > E _ P | 0.020 (0.017, 0.023) | 0.531 (0.463, 0.608) | 0.068 (0.046, 0.101) | 14.837 (9.459, 23.271) |
| 1979-1983 | E M P > E M P | -0.345 (-0.363, -0.327) | - | - | - |
| 1984-1992 | _ _ _ > _ _ _ | -0.222 (-0.236 , -0.209) | - | - | - |
| 1984-1992 | _ _ _ > _ _ P | 0.010 (0.008, 0.012) | 1.315 (1.204, 1.436) | 10.677 (6.477, 17.601) | 0.010 (0.005, 0.020) |
| 1984-1992 | _ _ _ > _ M _ | 0.022 (0.019, 0.027) | 0.896 (0.813, 0.988) | 1.339 (0.900, 1.993) | 0.248 (0.146, 0.422) |
| 1984-1992 | _ _ _ > E _ _ | 0.190 (0.178, 0.204) | 1.972 (1.869, 2.080) | 3.950 (3.253, 4.797) | 0.071 (0.056, 0.089) |
| 1984-1992 | _ _ P > _ _ _ | 0.062 (0.050, 0.078) | 1.057 (0.970, 1.152) | 22.273 (12.836, 38.648) | 0.192 (0.104, 0.352) |
| 1984-1992 | _ _ P > _ _ P | -0.259 (-0.281, -0.238) | - | - | - |
| 1984-1992 | _ _ P > _ M P | 0.029 (0.023, 0.037) | 0.896 (0.813, 0.988) | 1.339 (0.900 1.993) | 0.248 (0.146, 0.422) |
| 1984-1992 | _ _ P > E _ P | 0.167 (0.152, 0.184) | 1.972 (1.869, 2.080) | 3.950 (3.253, 4.797) | 0.071 (0.056, 0.089) |
| 1984-1992 | _ M _ > _ _ _ | 0.031 (0.027, 0.035) | 0.557 (0.496, 0.626) | 0.086 (0.063, 0.117) | 10.938 (7.845, 15.252) |
| 1984-1992 | _ M _ > _ M _ | -0.272 (-0.285, -0.260) | - | - | - |
| 1984-1992 | _ M _ > _ M P | 0.037 (0.033, 0.043) | 1.132 (0.972, 1.317) | 0.010 (0.006, 0.015) | 23.864 (15.108, 37.697) |
| 1984-1992 | _ M _ > E M _ | 0.205 (0.194, 0.216) | 1.972 (1.869, 2.080) | 3.950 (3.253, 4.797) | 0.071 (0.056, 0.089) |
| 1984-1992 | E _ _ > _ _ _ | 0.217 (0.206, 0.229) | 0.695 (0.662, 0.729) | 0.057 (0.047, 0.068) | 36.814 (29.972, 45.219) |
| 1984-1992 | E _ _ > E _ _ | -0.253 (-0.265, -0.241) | - | - | - |
| 1984-1992 | E _ _ > E M _ | 0.031 (0.027, 0.036) | 0.896 (0.813, 0.988) | 1.339 (0.900, 1.993) | 0.248 (0.146, 0.422) |
| 1984-1992 | E _ _ > E _ P | 0.005 (0.004, 0.006) | 1.315 (1.204, 1.436) | 10.677 (6.477, 17.601) | 0.010 (0.005, 0.020) |
| 1984-1992 | _ M P > _ _ P | 0.012 (0.009, 0.015) | 0.557 (0.496, 0.626) | 0.086 (0.063, 0.117) | 10.938 (7.845, 15.252) |
| 1984-1992 | _ M P > _ M _ | 0.058 (0.051, 0.065) | 0.884 (0.759, 1.029) | 101.940 (66.119, 157.168) | 0.042 (0.027, 0.066) |
| 1984-1992 | _ M P > _ M P | -0.263 (-0.276, -0.251) | - | - | - |
| 1984-1992 | _ M P > E M P | 0.194 (0.184, 0.205) | 1.972 (1.869, 2.080) | 3.950 (3.253, 4.797) | 0.071 (0.056, 0.089) |
| 1984-1992 | E M _ > _ M _ | 0.271 (0.259, 0.284) | 0.695 (0.662, 0.729) | 0.057 (0.047, 0.068) | 36.814 (29.972, 45.219) |
| 1984-1992 | E M _ > E _ _ | 0.031 (0.028, 0.035) | 0.557 (0.496, 0.626) | 0.086 (0.063, 0.117) | 10.938 (7.845, 15.252) |
| 1984-1992 | E M _ > E M _ | -0.327 (-0.340, -0.314) | - | - | - |
| 1984-1992 | E M _ > E M P | 0.024 (0.021, 0.028) | 1.315 (1.204, 1.436) | 10.677 (6.477, 17.601) | 0.010 (0.005, 0.020) |
| 1984-1992 | E _ P > _ _ P | 0.349 (0.319, 0.382) | 0.695 (0.662, 0.729) | 0.057 (0.047, 0.068) | 36.814 (29.972, 45.219) |
| 1984-1992 | E _ P > E _ _ | 0.144 (0.125, 0.166) | 1.057 (0.970, 1.152) | 22.273 (12.836, 38.648) | 0.192 (0.104, 0.352) |
| 1984-1992 | E _ P > E _ P | -0.516 (-0.555, -0.481) | - | - | - |
| 1984-1992 | E _ P > E M P | 0.024 (0.020, 0.029) | 0.896 (0.813, 0.988) | 1.339 (0.900, 1.993) | 0.248 (0.146, 0.422) |
| 1984-1992 | E M P > _ M P | 0.253 (0.240, 0.267) | 0.695 (0.662, 0.729) | 0.057 (0.047, 0.068) | 36.814 (29.972, 45.219) |
| 1984-1992 | E M P > E M _ | 0.092 (0.082, 0.102) | 1.057 (0.970, 1.152) | 22.273 (12.836, 38.648) | 0.192 (0.104, 0.352) |
| 1984-1992 | E M P > E _ P | 0.014 (0.012, 0.016) | 0.557 (0.496, 0.626) | 0.086 (0.063, 0.117) | 10.938 (7.845, 15.252) |
| 1984-1992 | E M P > E M P | -0.359 (-0.376, -0.343) | - | - | - |
| 1993-1999 | _ _ _ > _ _ _ | -0.167 (-0.178, -0.156) | - | - | - |
| 1993-1999 | _ _ _ > _ _ P | 0.004 (0.003, 0.005) | 1.291 (1.175, 1.419) | 26.756 (14.879, 48.114) | 0.002 (0.001, 0.005) |
| 1993-1999 | _ _ _ > _ M _ | 0.012 (0.010, 0.015) | 1.068 (0.966, 1.181) | 0.809 (0.562, 1.165) | 0.525 (0.328, 0.841) |
| 1993-1999 | _ _ _ > E _ _ | 0.151 (0.140, 0.162) | 1.459 (1.369, 1.555) | 2.730 (2.251, 3.311) | 0.117 (0.094, 0.147) |
| 1993-1999 | _ _ P > _ _ _ | 0.070 (0.058, 0.085) | 1.195 (1.099, 1.299) | 26.429 (15.612, 44.741) | 0.097 (0.055, 0.173) |
| 1993-1999 | _ _ P > _ _ P | -0.273 (-0.297, -0.251) | - | - | - |
| 1993-1999 | _ _ P > _ M P | 0.037 (0.029, 0.047) | 1.068 (0.966, 1.181) | 0.809 (0.562, 1.165) | 0.525 (0.328, 0.841) |
| 1993-1999 | _ _ P > E _ P | 0.166 (0.149, 0.184) | 1.459 (1.369, 1.555) | 2.730 (2.251, 3.311) | 0.117 (0.094, 0.147) |
| 1993-1999 | _ M _ > _ _ _ | 0.029 (0.025, 0.033) | 0.610 (0.548, 0.678) | 0.074 (0.056, 0.099) | 12.452 (9.324, 16.628) |
| 1993-1999 | _ M _ > _ M _ | -0.226 (-0.238, -0.214) | - | - | - |
| 1993-1999 | _ M _ > _ M P | 0.037 (0.032, 0.042) | 0.889 (0.747, 1.059) | 0.020 (0.012, 0.033) | 13.229 (7.930, 22.067) |
| 1993-1999 | _ M _ > E M _ | 0.160 (0.150, 0.171) | 1.459 (1.369, 1.555) | 2.730 (2.251, 3.311) | 0.117 (0.094, 0.147) |
| 1993-1999 | E _ _ > _ _ _ | 0.145 (0.137, 0.154) | 0.652 (0.617, 0.690) | 0.040 (0.033, 0.048) | 45.233 (37.009, 55.285) |
| 1993-1999 | E _ _ > E _ _ | -0.182 (-0.191, -0.173) | - | - | - |
| 1993-1999 | E _ _ > E M _ | 0.033 (0.030, 0.037) | 1.068 (0.966, 1.181) | 0.809 (0.562, 1.165) | 0.525 (0.328, 0.841) |
| 1993-1999 | E _ _ > E _ P | 0.003 (0.003, 0.004) | 1.291 (1.175, 1.419) | 26.756 (14.879, 48.114) | 0.002 (0.001, 0.005) |
| 1993-1999 | _ M P > _ _ P | 0.011 (0.008, 0.014) | 0.610 (0.548, 0.678) | 0.074 (0.056, 0.099) | 12.452 (9.324, 16.628) |
| 1993-1999 | _ M P > _ M _ | 0.047 (0.041, 0.054) | 1.125 (0.945, 1.339) | 49.583 (30.151, 81.538) | 0.076 (0.045, 0.126) |
| 1993-1999 | _ M P > _ M P | -0.209 (-0.221, -0.198) | - | - | - |
| 1993-1999 | _ M P > E M P | 0.151 (0.142, 0.160) | 1.459 (1.369, 1.555) | 2.730 (2.251, 3.311) | 0.117 (0.094, 0.147) |
| 1993-1999 | E M _ > _ M _ | 0.151 (0.144, 0.159) | 0.652 (0.617, 0.690) | 0.040 (0.033, 0.048) | 45.233 (37.009, 55.285) |
| 1993-1999 | E M _ > E _ _ | 0.031 (0.028, 0.034) | 0.610 (0.548, 0.678) | 0.074 (0.056, 0.099) | 12.452 (9.324, 16.628) |
| 1993-1999 | E M _ > E M _ | -0.196 (-0.204, -0.187) | - | - | - |
| 1993-1999 | E M _ > E M P | 0.013 (0.011, 0.016) | 1.291 (1.175, 1.419) | 26.756 (14.879, 48.114) | 0.002 (0.001, 0.005) |
| 1993-1999 | E _ P > _ _ P | 0.158 (0.141, 0.177) | 0.652 (0.617, 0.690) | 0.040 (0.033, 0.048) | 45.233 (37.009, 55.285) |
| 1993-1999 | E _ P > E _ _ | 0.129 (0.115, 0.145) | 1.195 (1.099, 1.299) | 26.429 (15.612, 44.741) | 0.097 (0.055, 0.173) |
| 1993-1999 | E _ P > E _ P | -0.314 (-0.338, -0.292) | - | - | - |
| 1993-1999 | E _ P > E M P | 0.026 (0.022, 0.031) | 1.068 (0.966, 1.181) | 0.809 (0.562, 1.165) | 0.525 (0.328, 0.841) |
| 1993-1999 | E M P > _ M P | 0.131 (0.123, 0.140) | 0.652 (0.617, 0.690) | 0.040 (0.033, 0.048) | 45.233 (37.009, 55.285) |
| 1993-1999 | E M P > E M _ | 0.055 (0.049, 0.061) | 1.195 (1.099, 1.299) | 26.429 (15.612, 44.741) | 0.097 (0.055, 0.173) |
| 1993-1999 | E M P > E _ P | 0.020 (0.018, 0.023) | 0.610 (0.548, 0.678) | 0.074 (0.056, 0.099) | 12.452 (9.324, 16.628) |
| 1993-1999 | E M P > E M P | -0.207 (-0.218, -0.196) | - | - | - |
| 2000-2007 | _ _ _ > _ _ _ | -0.125 (-0.134, -0.118) | - | - | - |
| 2000-2007 | _ _ _ > _ _ P | 0.005 (0.004, 0.006) | 1.120 (1.029, 1.219) | 7.516 (4.755, 11.880) | 0.014 (0.008, 0.025) |
| 2000-2007 | _ _ _ > _ M _ | 0.011 (0.009, 0.013) | 1.010 (0.919, 1.111) | 2.309 (1.570, 3.396) | 0.132 (0.079, 0.221) |
| 2000-2007 | _ _ _ > E _ _ | 0.110 (0.102, 0.118) | 1.409 (1.320, 1.504) | 2.023 (1.682, 2.433) | 0.163 (0.132, 0.201) |
| 2000-2007 | _ _ P > _ _ _ | 0.104 (0.090, 0.120) | 1.019 (0.941, 1.103) | 91.910 (55.787, 151.423) | 0.036 (0.021, 0.059) |
| 2000-2007 | _ _ P > _ _ P | -0.238 (-0.259, -0.218) | - | - | - |
| 2000-2007 | _ _ P > _ M P | 0.023 (0.017, 0.030) | 1.010 (0.919, 1.111) | 2.309 (1.570, 3.396) | 0.132 (0.079, 0.221) |
| 2000-2007 | _ _ P > E _ P | 0.111 (0.098, 0.125) | 1.409 (1.320, 1.504) | 2.023 (1.682, 2.433) | 0.163 (0.132, 0.201) |
| 2000-2007 | _ M _ > _ _ _ | 0.021 (0.018, 0.024) | 0.593 (0.531, 0.661) | 0.151 (0.111, 0.207) | 6.699 (4.963, 9.043) |
| 2000-2007 | _ M _ > _ M _ | -0.203 (-0.214, -0.192) | - | - | - |
| 2000-2007 | _ M _ > _ M P | 0.036 (0.031, 0.042) | 0.901 (0.756, 1.073) | 0.026 (0.016, 0.043) | 8.191 (4.894, 13.710) |
| 2000-2007 | _ M _ > E M _ | 0.146 (0.137, 0.156) | 1.409 (1.320, 1.504) | 2.023 (1.682, 2.433) | 0.163 (0.132, 0.201) |
| 2000-2007 | E _ _ > _ _ _ | 0.095 (0.090, 0.101) | 0.759 (0.718, 0.802) | 0.064 (0.054, 0.077) | 21.372 (17.771, 25.702) |
| 2000-2007 | E _ _ > E _ _ | -0.125 (-0.131, -0.119) | - | - | - |
| 2000-2007 | E _ _ > E M _ | 0.024 (0.021, 0.026) | 1.010 (0.919, 1.111) | 2.309 (1.570, 3.396) | 0.132 (0.079, 0.221) |
| 2000-2007 | E _ _ > E _ P | 0.006 (0.005, 0.007) | 1.120 (1.029, 1.219) | 7.516 (4.755, 11.880) | 0.014 (0.008, 0.025) |
| 2000-2007 | _ M P > _ _ P | 0.016 (0.013, 0.021) | 0.593 (0.531, 0.661) | 0.151 (0.111, 0.207) | 6.699 (4.963, 9.043) |
| 2000-2007 | _ M P > _ M _ | 0.038 (0.033, 0.044) | 1.110 (0.932, 1.323) | 38.684 (23.429, 63.870) | 0.122 (0.073, 0.204) |
| 2000-2007 | _ M P > _ M P | -0.165 (-0.175, -0.156) | - | - | - |
| 2000-2007 | _ M P > E M P | 0.111 (0.104, 0.119) | 1.409 (1.320, 1.504) | 2.023 (1.682, 2.433) | 0.163 (0.132, 0.201) |
| 2000-2007 | E M _ > _ M _ | 0.109 (0.104, 0.115) | 0.759 (0.718, 0.802) | 0.064 (0.054, 0.077) | 21.372 (17.771, 25.702) |
| 2000-2007 | E M _ > E _ _ | 0.025 (0.023, 0.028) | 0.593 (0.531, 0.661) | 0.151 (0.111, 0.207) | 6.699 (4.963, 9.043) |
| 2000-2007 | E M _ > E M _ | -0.158 (-0.166, -0.152) | - | - | - |
| 2000-2007 | E M _ > E M P | 0.024 (0.021, 0.027) | 1.120 (1.029, 1.219) | 7.516 (4.755, 11.880) | 0.014 (0.008, 0.025) |
| 2000-2007 | E _ P > _ _ P | 0.112 (0.099, 0.126) | 0.759 (0.718, 0.802) | 0.064 (0.054, 0.077) | 21.372 (17.771, 25.702) |
| 2000-2007 | E _ P > E _ _ | 0.093 (0.084, 0.105) | 1.019 (0.941, 1.103) | 91.910 (55.787, 151.423) | 0.036 (0.021, 0.059) |
| 2000-2007 | E _ P > E _ P | -0.232 (-0.249, -0.215) | - | - | - |
| 2000-2007 | E _ P > E M P | 0.027 (0.023, 0.031) | 1.010 (0.919, 1.111) | 2.309 (1.570, 3.396) | 0.132 (0.079, 0.221) |
| 2000-2007 | E M P > _ M P | 0.079 (0.073, 0.084) | 0.759 (0.718, 0.802) | 0.064 (0.054, 0.077) | 21.372 (17.771, 25.702) |
| 2000-2007 | E M P > E M _ | 0.053 (0.048, 0.058) | 1.019 (0.941, 1.103) | 91.910 (55.787, 151.423) | 0.036 (0.021, 0.059) |
| 2000-2007 | E M P > E _ P | 0.013 (0.011, 0.015) | 0.593 (0.531, 0.661) | 0.151 (0.111, 0.207) | 6.699 (4.963, 9.043) |
| 2000-2007 | E M P > E M P | -0.144 (-0.152, -0.137) | - | - | - |
| 2008-2015 | _ _ _ > _ _ _ | -0.123 (-0.130, -0.116) | - | - | - |
| 2008-2015 | _ _ _ > _ _ P | 0.005 (0.004, 0.006) | 0.901 (0.814, 0.996) | 11.595 (6.733, 19.969) | 0.007 (0.004, 0.015) |
| 2008-2015 | _ _ _ > _ M _ | 0.007 (0.005, 0.008) | 0.959 (0.855, 1.076) | 3.233 (1.984, 5.266) | 0.092 (0.049, 0.174) |
| 2008-2015 | _ _ _ > E _ _ | 0.112 (0.105, 0.119) | 1.300 (1.225, 1.380) | 1.776 (1.488, 2.121) | 0.191 (0.156, 0.234) |
| 2008-2015 | _ _ P > _ _ _ | 0.114 (0.099, 0.132) | 1.130 (1.036, 1.231) | 23.441 (14.377, 38.219) | 0.122 (0.074, 0.203) |
| 2008-2015 | _ _ P > _ _ P | -0.261 (-0.284, -0.240) | - | - | - |
| 2008-2015 | _ _ P > _ M P | 0.018 (0.013, 0.024) | 0.959 (0.855, 1.076) | 3.233 (1.984, 5.266) | 0.092 (0.049, 0.174) |
| 2008-2015 | _ _ P > E _ P | 0.129 (0.115, 0.145) | 1.300 (1.225, 1.380) | 1.776 (1.488, 2.121) | 0.191 (0.156, 0.234) |
| 2008-2015 | _ M _ > _ _ _ | 0.036 (0.031, 0.040) | 0.572 (0.518, 0.632) | 0.053 (0.041, 0.068) | 14.804 (11.634, 18.839) |
| 2008-2015 | _ M _ > _ M _ | -0.198 (-0.209, -0.188) | - | - | - |
| 2008-2015 | _ M _ > _ M P | 0.029 (0.025, 0.034) | 0.856 (0.725, 1.011) | 0.051 (0.030, 0.087) | 5.022 (2.997, 8.414) |
| 2008-2015 | _ M _ > E M _ | 0.133 (0.125, 0.142) | 1.300 (1.225, 1.380) | 1.776 (1.488, 2.121) | 0.191 (0.156, 0.234) |
| 2008-2015 | E _ _ > _ _ _ | 0.117 (0.111, 0.123) | 0.780 (0.741, 0.822) | 0.110 (0.094, 0.128) | 12.971 (11.070, 15.199) |
| 2008-2015 | E _ _ > E _ _ | -0.135 (-0.141, -0.129) | - | - | - |
| 2008-2015 | E _ _ > E M _ | 0.015 (0.013, 0.017) | 0.959 (0.855, 1.076) | 3.233 (1.984, 5.266) | 0.092 (0.049, 0.174) |
| 2008-2015 | E _ _ > E _ P | 0.003 (0.003, 0.004) | 0.901 (0.814, 0.996) | 11.595 (6.733, 19.969) | 0.007 (0.004, 0.015) |
| 2008-2015 | _ M P > _ _ P | 0.010 (0.007, 0.014) | 0.572 (0.518, 0.632) | 0.053 (0.041, 0.068) | 14.804 (11.634, 18.839) |
| 2008-2015 | _ M P > _ M _ | 0.045 (0.039, 0.052) | 1.168 (0.989, 1.379) | 19.491 (11.548, 32.898) | 0.199 (0.119, 0.334) |
| 2008-2015 | _ M P > _ M P | -0.171 (-0.181, -0.161) | - | - | - |
| 2008-2015 | _ M P > E M P | 0.116 (0.108, 0.124) | 1.300 (1.225, 1.380) | 1.776 (1.488, 2.121) | 0.191 (0.156, 0.234) |
| 2008-2015 | E M _ > _ M _ | 0.111 (0.105, 0.117) | 0.780 (0.741, 0.822) | 0.110 (0.094, 0.128) | 12.971 (11.070, 15.199) |
| 2008-2015 | E M _ > E _ _ | 0.031 (0.028, 0.034) | 0.572 (0.518, 0.632) | 0.053 (0.041, 0.068) | 14.804 (11.634, 18.839) |
| 2008-2015 | E M _ > E M _ | -0.163 (-0.171, -0.156) | - | - | - |
| 2008-2015 | E M _ > E M P | 0.021 (0.018, 0.024) | 0.901 (0.814, 0.996) | 11.595 (6.733, 19.969) | 0.007 (0.004, 0.015) |
| 2008-2015 | E _ P > _ _ P | 0.130 (0.116, 0.146) | 0.780 (0.741, 0.822) | 0.110 (0.094, 0.128) | 12.971 (11.070, 15.199) |
| 2008-2015 | E _ P > E _ _ | 0.100 (0.089, 0.113) | 1.130 (1.036, 1.231) | 23.441 (14.377, 38.219) | 0.122 (0.074, 0.203) |
| 2008-2015 | E _ P > E _ P | -0.253 (-0.273, -0.234) | - | - | - |
| 2008-2015 | E _ P > E M P | 0.022 (0.019, 0.027) | 0.959 (0.855, 1.076) | 3.233 (1.984, 5.266) | 0.092 (0.049, 0.174) |
| 2008-2015 | E M P > _ M P | 0.079 (0.074, 0.085) | 0.780 (0.741, 0.822) | 0.110 (0.094, 0.128) | 12.971 (11.070, 15.199) |
| 2008-2015 | E M P > E M _ | 0.056 (0.051, 0.062) | 1.130 (1.036, 1.231) | 23.441 (14.377, 38.219) | 0.122 (0.074, 0.203) |
| 2008-2015 | E M P > E _ P | 0.019 (0.016, 0.021) | 0.572 (0.518, 0.632) | 0.053 (0.041, 0.068) | 14.804 (11.634, 18.839) |
| 2008-2015 | E M P > E M P | -0.154 (-0.163, -0.146) | - | - | - |
-
1_ =1 _ = not currently holding role, E= Employed, M = Married, P= Parent.
Summary of error between micro-simulated and Census population for 1990 by demographic category.
| California 1990 | Total | Male | Female | Black | White | Hispanic | Other |
|---|---|---|---|---|---|---|---|
| Micro-simulated population | 2346930 | 1174600 | 1172330 | 196620 | 1449040 | 475800 | 225470 |
| Census population | 2372956 | 1191852 | 1181104 | 163098 | 1403873 | 570837 | 235147 |
| % difference | -1.1% | -1.4% | -0.7% | +20.5% | +3.2% | -16.6% | -4.1% |
-
Notes: positive values indicate that the microsimulation has over-estimated. Negative values indicate the microsimulation has under estimated.
Comparison of Census 1980 and Micro-synthesis demographic categories for California
| Female | Male | |||||
|---|---|---|---|---|---|---|
| Census | Micro-synthesis | % difference | Census | Micro-synthesis | % difference | |
| 12-13 | 34319 | 34321 | -0.01% | 35516 | 35516 | -0.01% |
| 14-17 | 78235 | 78235 | -0.01% | 80271 | 80265 | 0.00% |
| 18-19 | 43149 | 43149 | 0.00% | 42496 | 42495 | 0.01% |
| 20-22 | 67427 | 67427 | 0.00% | 67082 | 67081 | 0.00% |
| 23-24 | 46233 | 46234 | 0.00% | 46481 | 46482 | 0.00% |
| 25-28 | 88104 | 8813 | 0.00% | 88702 | 88702 | 0.00% |
| 29-30 | 42761 | 42761 | 0.00% | 42895 | 42896 | 0.00% |
| 31-34 | 78497 | 78497 | 0.00% | 77893 | 77893 | 0.00% |
| 35-39 | 77326 | 77327 | 0.00% | 76723 | 76724 | 0.00% |
| 40-44 | 63134 | 63133 | 0.00% | 62340 | 62340 | 0.00% |
| 45-49 | 58371 | 58372 | 0.00% | 57422 | 57422 | 0.00% |
| 50-59 | 124046 | 124046 | 0.00% | 114417 | 114418 | 0.00% |
| 60-80 | 162490 | 162492 | 0.00% | 129435 | 129435 | 0.00% |
| Black | 71332 | 71333 | 0.00% | 63901 | 63901 | 0.00% |
| Hispanic | 162686 | 162687 | 0.00% | 163695 | 163696 | 0.00% |
| Other | 63678 | 63678 | -0.01% | 60735 | 60736 | 0.00% |
| White | 666395 | 666398 | 0.00% | 633346 | 633341 | 0.00% |
| High school graduate | 641079 | 641084 | 0.00% | 549945 | 549939 | 0.00% |
| Some college | 202229 | 202231 | 0.00% | 198391 | 198391 | 0.00% |
| College + | 120782 | 120780 | 0.00% | 173343 | 173344 | 0.00% |
| employed | 456422 | 456420 | 0.000% | 622114 | 622114 | 0.000% |
| unemployed | 507669 | 507675 | 0.001% | 299565 | 299560 | -0.002% |
| married | 496685 | 496686 | 0.000% | 501221 | 501222 | 0.000% |
| unmarried | 467406 | 467410 | 0.001% | 420458 | 420452 | -0.001% |
| not parent | 587778 | 587782 | 0.001% | 572818 | 572811 | -0.001% |
| parent | 376313 | 376314 | 0.000% | 348861 | 348863 | 0.000% |
| $0-$6999 | 116207 | 116208 | 0.001% | 63197 | 63196 | -0.001% |
| $7000-$9999 | 73902 | 73904 | 0.002% | 56098 | 56099 | 0.002% |
| $10000-$14999 | 132318 | 132317 | 0.000% | 97953 | 97953 | 0.000% |
| $15000-$19999 | 105334 | 105334 | 0.000% | 110883 | 110882 | -0.002% |
| $20000-$24999 | 111145 | 111145 | 0.000% | 118663 | 118664 | 0.001% |
| $25000-$29999 | 151786 | 151784 | -0.001% | 171233 | 171234 | 0.000% |
| $30000+ | 160845 | 160845 | 0.000% | 187861 | 187862 | 0.001% |
| youth-no income | 112554 | 112556 | 0.003% | 115788 | 115781 | -0.006% |
Comparison of Census 1980 and Micro-synthesis demographic categories for Minnesota
| Female | Male | |||||
|---|---|---|---|---|---|---|
| Census | Micro-synthesis | % difference | Census | Micro-synthesis | % difference | |
| 12-13 | 27241 | 27238 | -0.01% | 28255 | 28253 | -0.01% |
| 14-17 | 61564 | 61556 | -0.01% | 63441 | 63440 | 0.00% |
| 18-19 | 32127 | 32128 | 0.00% | 30794 | 30796 | 0.01% |
| 20-22 | 47405 | 47406 | 0.00% | 43889 | 43890 | 0.00% |
| 23-24 | 30533 | 30533 | 0.00% | 28029 | 28030 | 0.00% |
| 25-28 | 58583 | 58584 | 0.00% | 54319 | 54320 | 0.00% |
| 29-30 | 29450 | 29451 | 0.00% | 27114 | 27114 | 0.00% |
| 31-34 | 55495 | 55496 | 0.00% | 50642 | 50643 | 0.00% |
| 35-39 | 57839 | 57841 | 0.00% | 52096 | 52096 | 0.00% |
| 40-44 | 48834 | 48835 | 0.00% | 44256 | 44256 | 0.00% |
| 45-49 | 47692 | 47692 | 0.00% | 42947 | 42948 | 0.00% |
| 50-59 | 104535 | 104537 | 0.00% | 91546 | 91545 | 0.00% |
| 60-80 | 147327 | 147327 | 0.00% | 107702 | 107703 | 0.00% |
| Black | 99616 | 99617 | 0.00% | 77367 | 77368 | 0.00% |
| Hispanic | 67549 | 67549 | 0.00% | 56821 | 56820 | 0.00% |
| Other | 16987 | 16986 | -0.01% | 16640 | 16640 | 0.00% |
| White | 564477 | 564474 | 0.00% | 514208 | 514209 | 0.00% |
| High school graduate | 529602 | 529597 | 0.00% | 443144 | 443145 | 0.00% |
| Some college | 125710 | 125712 | 0.00% | 104317 | 104318 | 0.00% |
| College + | 93318 | 93319 | 0.00% | 117574 | 117576 | 0.00% |
| employed | 82042 | 82039 | -0.004% | 106867 | 106868 | 0.001% |
| unemployed | 81373 | 81373 | -0.001% | 49791 | 49794 | 0.006% |
| married | 91259 | 91256 | -0.003% | 91588 | 91588 | 0.000% |
| unmarried | 72157 | 72155 | -0.002% | 65070 | 65074 | 0.006% |
| not parent | 104887 | 104886 | -0.001% | 100877 | 100881 | 0.003% |
| parent | 58529 | 58526 | -0.005% | 55781 | 55781 | 0.001% |
| $0-$6999 | 16634 | 16632 | -0.008% | 9321 | 9321 | -0.009% |
| $7000-$9999 | 11580 | 11579 | -0.014% | 8827 | 8827 | 0.000% |
| $10000-$14999 | 19356 | 19357 | 0.004% | 16283 | 16283 | -0.004% |
| $15000-$19999 | 18250 | 18249 | -0.008% | 18769 | 18769 | -0.003% |
| $20000-$24999 | 18958 | 18958 | -0.002% | 20074 | 20075 | 0.005% |
| $25000-$29999 | 27461 | 27461 | 0.000% | 29382 | 29382 | 0.001% |
| $30000+ | 29991 | 29990 | -0.003% | 31826 | 31827 | 0.002% |
| youth-no income | 21183 | 21184 | 0.005% | 22172 | 22176 | 0.018% |
Comparison of Census 1980 and Micro-synthesis demographic categories for New York
| Female | Male | |||||
|---|---|---|---|---|---|---|
| Census | Micro-synthesis | % difference | Census | Micro-synthesis | % difference | |
| 12-13 | 27241 | 27238 | -0.01% | 28255 | 28253 | -0.01% |
| 14-17 | 61564 | 61556 | -0.01% | 63441 | 63440 | 0.00% |
| 18-19 | 32127 | 32128 | 0.00% | 30794 | 30796 | 0.01% |
| 20-22 | 47405 | 47406 | 0.00% | 43889 | 43890 | 0.00% |
| 23-24 | 30533 | 30533 | 0.00% | 28029 | 28030 | 0.00% |
| 25-28 | 58583 | 58584 | 0.00% | 54319 | 54320 | 0.00% |
| 29-30 | 29450 | 29451 | 0.00% | 27114 | 27114 | 0.00% |
| 31-34 | 55495 | 55496 | 0.00% | 50642 | 50643 | 0.00% |
| 35-39 | 57839 | 57841 | 0.00% | 52096 | 52096 | 0.00% |
| 40-44 | 48834 | 48835 | 0.00% | 44256 | 44256 | 0.00% |
| 45-49 | 47692 | 47692 | 0.00% | 42947 | 42948 | 0.00% |
| 50-59 | 104535 | 104537 | 0.00% | 91546 | 91545 | 0.00% |
| 60-80 | 147327 | 147327 | 0.00% | 107702 | 107703 | 0.00% |
| Black | 99616 | 99617 | 0.00% | 77367 | 77368 | 0.00% |
| Hispanic | 67549 | 67549 | 0.00% | 56821 | 56820 | 0.00% |
| Other | 16987 | 16986 | -0.01% | 16640 | 16640 | 0.00% |
| White | 564477 | 564474 | 0.00% | 514208 | 514209 | 0.00% |
| High school graduate | 529602 | 529597 | 0.00% | 443144 | 443145 | 0.00% |
| Some college | 125710 | 125712 | 0.00% | 104317 | 104318 | 0.00% |
| College + | 93318 | 93319 | 0.00% | 117574 | 117576 | 0.00% |
| employed | 324473 | 324476 | 0.001% | 421505 | 421509 | 0.001% |
| unemployed | 424158 | 424151 | -0.002% | 243530 | 243530 | 0.000% |
| married | 360180 | 360187 | 0.002% | 360048 | 360051 | 0.001% |
| unmarried | 388451 | 388441 | -0.003% | 304988 | 304988 | 0.000% |
| not parent | 478148 | 478139 | -0.002% | 433012 | 433013 | 0.000% |
| parent | 270483 | 270488 | 0.002% | 232024 | 232026 | 0.001% |
| $0-$6999 | 105097 | 105099 | 0.001% | 50391 | 50391 | 0.001% |
| $7000-$9999 | 63228 | 63228 | -0.001% | 41904 | 41904 | 0.001% |
| $10000-$14999 | 98860 | 98863 | 0.003% | 72189 | 72191 | 0.002% |
| $15000-$19999 | 81467 | 81469 | 0.001% | 79584 | 79585 | 0.001% |
| $20000-$24999 | 81939 | 81940 | 0.001% | 82614 | 82615 | 0.002% |
| $25000-$29999 | 110219 | 110219 | 0.000% | 118694 | 118694 | 0.000% |
| $30000+ | 119011 | 119013 | 0.002% | 127961 | 127963 | 0.001% |
| youth-no income | 88805 | 88794 | -0.013% | 91696 | 91694 | -0.003% |
Comparison of Census 1980 and Micro-synthesis demographic categories for Tennessee
| Female | Male | |||||
|---|---|---|---|---|---|---|
| Census | Micro-synthesis | % difference | Census | Micro-synthesis | % difference | |
| 12-13 | 7062 | 7062 | -0.01% | 7376 | 7375 | -0.01% |
| 14-17 | 16008 | 16011 | -0.01% | 16635 | 16633 | 0.00% |
| 18-19 | 8663 | 8663 | 0.00% | 8392 | 8392 | 0.01% |
| 20-22 | 12939 | 12939 | 0.00% | 12203 | 12203 | 0.00% |
| 23-24 | 8385 | 8386 | 0.00% | 7934 | 7935 | 0.00% |
| 25-28 | 15954 | 15953 | 0.00% | 15000 | 14999 | 0.00% |
| 29-30 | 7568 | 7567 | 0.00% | 7283 | 7283 | 0.00% |
| 31-34 | 14319 | 14319 | 0.00% | 13590 | 13591 | 0.00% |
| 35-39 | 14687 | 14687 | 0.00% | 13948 | 13948 | 0.00% |
| 40-44 | 12653 | 12653 | 0.00% | 11861 | 11861 | 0.00% |
| 45-49 | 12032 | 12033 | 0.00% | 10884 | 10883 | 0.00% |
| 50-59 | 24527 | 24527 | 0.00% | 21601 | 21601 | 0.00% |
| 60-80 | 35567 | 35566 | 0.00% | 26752 | 26752 | 0.00% |
| Black | 29365 | 29365 | 0.00% | 23977 | 23978 | 0.00% |
| Hispanic | 1347 | 1347 | 0.00% | 1227 | 1226 | 0.00% |
| Other | 969 | 969 | -0.01% | 919 | 920 | 0.00% |
| White | 158686 | 158691 | 0.00% | 147339 | 147335 | 0.00% |
| High school graduate | 148035 | 148038 | 0.00% | 131070 | 131067 | 0.00% |
| Some college | 25913 | 25913 | 0.00% | 21497 | 21496 | 0.00% |
| College + | 16420 | 16420 | 0.00% | 20896 | 20897 | 0.00% |
| employed | 82113 | 82113 | 0.000% | 110522 | 110523 | 0.000% |
| unemployed | 108255 | 108259 | 0.004% | 62942 | 62937 | -0.007% |
| married | 105877 | 105877 | 0.000% | 105925 | 105924 | 0.000% |
| unmarried | 84491 | 84495 | 0.005% | 67539 | 67535 | -0.006% |
| not parent | 118870 | 118873 | 0.003% | 110051 | 110048 | -0.003% |
| parent | 71498 | 71499 | 0.001% | 63413 | 63412 | -0.001% |
| $0-$6999 | 24557 | 24556 | -0.004% | 12456 | 12456 | -0.004% |
| $7000-$9999 | 15018 | 15019 | 0.003% | 10596 | 10596 | 0.001% |
| $10000-$14999 | 22960 | 22961 | 0.005% | 18886 | 18886 | 0.001% |
| $15000-$19999 | 21447 | 21447 | 0.000% | 21310 | 21310 | 0.001% |
| $20000-$24999 | 21576 | 21575 | -0.003% | 22217 | 22217 | -0.001% |
| $25000-$29999 | 29785 | 29786 | 0.003% | 31355 | 31354 | -0.004% |
| $30000+ | 31952 | 31951 | -0.002% | 32629 | 32629 | 0.002% |
| youth-no income | 23070 | 23074 | 0.018% | 24012 | 24008 | -0.013% |
Comparison of Census 1980 and Micro-synthesis demographic categories for Texas
| Female | Male | |||||
|---|---|---|---|---|---|---|
| Census | Micro-synthesis | % difference | Census | Micro-synthesis | % difference | |
| 12-13 | 22357 | 22358 | -0.01% | 23270 | 23271 | -0.01% |
| 14-17 | 49894 | 49898 | -0.01% | 51592 | 51585 | 0.00% |
| 18-19 | 27180 | 27179 | 0.00% | 26834 | 26834 | 0.01% |
| 20-22 | 41451 | 41451 | 0.00% | 40474 | 40475 | 0.00% |
| 23-24 | 27802 | 27802 | 0.00% | 27631 | 27631 | 0.00% |
| 25-28 | 52002 | 52003 | 0.00% | 51844 | 51844 | 0.00% |
| 29-30 | 24265 | 24264 | 0.00% | 24162 | 24163 | 0.00% |
| 31-34 | 44007 | 44006 | 0.00% | 43471 | 43469 | 0.00% |
| 35-39 | 44166 | 44166 | 0.00% | 43097 | 43098 | 0.00% |
| 40-44 | 36665 | 36664 | 0.00% | 35275 | 35276 | 0.00% |
| 45-49 | 34670 | 34670 | 0.00% | 33095 | 33095 | 0.00% |
| 50-59 | 68693 | 68694 | 0.00% | 62974 | 62974 | 0.00% |
| 60-80 | 91746 | 91746 | 0.00% | 72024 | 72025 | 0.00% |
| Black | 66501 | 66499 | 0.00% | 57637 | 57639 | 0.00% |
| Hispanic | 107300 | 107300 | 0.00% | 103714 | 103715 | 0.00% |
| Other | 7612 | 7612 | -0.01% | 7592 | 7591 | 0.00% |
| White | 383487 | 383493 | 0.00% | 366805 | 366799 | 0.00% |
| employed | 261540 | 261539 | 0.000% | 378302 | 378304 | 0.001% |
| unemployed | 303362 | 303367 | 0.002% | 157447 | 157441 | -0.004% |
| married | 320345 | 320344 | 0.000% | 322254 | 322255 | 0.000% |
| unmarried | 244557 | 244562 | 0.002% | 213495 | 213490 | -0.002% |
| not parent | 337557 | 337565 | 0.002% | 326571 | 326565 | -0.002% |
| parent | 227344 | 227341 | -0.001% | 209179 | 209180 | 0.001% |
| $0-$6999 | 66610 | 66610 | 0.001% | 33977 | 33979 | 0.005% |
| $7000-$9999 | 43731 | 43730 | -0.003% | 33648 | 33649 | 0.003% |
| $10000-$14999 | 75175 | 75175 | 0.001% | 57245 | 57245 | -0.001% |
| $15000-$19999 | 61536 | 61536 | 0.000% | 65138 | 6513 | 0.002% |
| $20000-$24999 | 64147 | 64148 | 0.001% | 70621 | 70620 | -0.002% |
| $25000-$29999 | 87815 | 87814 | -0.001% | 97645 | 97646 | 0.001% |
| $30000+ | 93634 | 93633 | -0.001% | 102609 | 102609 | 0.000% |
| youth-no income | 72251 | 72256 | 0.007% | 74863 | 74856 | -0.009% |
Validation over 30 years: Comparison of microsimulation population with observed California Census data by sex, age and race/ethnicity for California in 1990, 2000 and 2010.
| 1990 | 2000 | 2010 | |||||||
|---|---|---|---|---|---|---|---|---|---|
| Census | Microsimulation | % difference | Census | Microsimulation | % difference | Census | Microsimulation | % difference | |
| Non-hispanic black | 163098 | 163478 | 0.23 | 170935 | 173171 | 1.31 | 179650 | 177566 | -1.16 |
| Hispanic | 570837 | 564918 | -1.04 | 802547 | 808682 | 0.76 | 1070392 | 1077090 | 0.63 |
| Non-hispanic other | 235147 | 232372 | -1.18 | 395669 | 394494 | -0.30 | 501662 | 502613 | 0.19 |
| Non-hispanic white | 1403873 | 1398203 | -0.40 | 1309368 | 1323264 | 1.06 | 1261488 | 1271241 | 0.77 |
| Female | 1181104 | 1175748 | -0.45 | 1340856 | 1344843 | 0.30 | 1510682 | 1509581 | -0.07 |
| Male | 1191852 | 1183223 | -0.72 | 1337663 | 1354768 | 1.28 | 1502511 | 1518929 | 1.09 |
| 12-17 | 230157 | 227814 | -1.02 | 296664 | 291532 | -1.73 | 323851 | 319253 | -1.42 |
| 18-24 | 341225 | 334686 | -1.92 | 336603 | 333629 | -0.89 | 392295 | 385753 | -1.67 |
| 25-29 | 285405 | 286916 | 0.53 | 254354 | 254657 | 0.12 | 274440 | 270831 | -1.32 |
| 30-34 | 283231 | 282833 | -0.14 | 268552 | 270008 | 0.54 | 257346 | 258745 | 0.54 |
| 35-39 | 250094 | 249908 | -0.07 | 281474 | 290364 | 3.16 | 257357 | 259482 | 0.83 |
| 40-44 | 213837 | 211583 | -1.05 | 267059 | 273110 | 2.26 | 260913 | 260811 | -0.04 |
| 45-49 | 162052 | 162067 | 0.01 | 233179 | 239895 | 2.89 | 268981 | 281130 | 4.52 |
| 50-59 | 241594 | 243693 | 0.87 | 346709 | 350082 | 0.97 | 476684 | 485139 | 1.77 |
| 60-80 | 365356 | 359471 | -1.61 | 393923 | 396334 | 0.62 | 501322 | 507366 | 1.21 |
Validation over 30 years: Comparison of microsimulation population with observed Minnesota Census data by sex, age and race/ethnicity for Minnesota in 1990, 2000 and 2010.
| 1990 | 2000 | 2010 | |||||||
|---|---|---|---|---|---|---|---|---|---|
| Census | Microsimulation | % difference | Census | Microsimulation | % difference | Census | Microsimulation | % difference | |
| Non-hispanic black | 6585 | 6613 | 0.42 | 12412 | 12545 | 1.07 | 20170 | 20227 | 0.28 |
| Hispanic | 3716 | 3739 | 0.64 | 10196 | 10280 | 0.82 | 17537 | 17282 | -1.45 |
| Non-hispanic other | 8618 | 8570 | -0.56 | 19182 | 19124 | -0.30 | 27438 | 27444 | 0.02 |
| Non-hispanic white | 324322 | 324449 | 0.04 | 351064 | 351462 | 0.11 | 361567 | 362328 | 0.21 |
| Female | 174474 | 174489 | 0.01 | 197125 | 197426 | 0.15 | 213592 | 213807 | 0.10 |
| Male | 168769 | 168884 | 0.07 | 195730 | 195985 | 0.13 | 213122 | 213474 | 0.17 |
| 12-17 | 35025 | 35087 | 0.18 | 45125 | 45167 | 0.09 | 43186 | 43218 | 0.08 |
| 18-24 | 44280 | 44418 | 0.31 | 47043 | 47326 | 0.60 | 50279 | 49878 | -0.80 |
| 25-29 | 38175 | 38182 | 0.02 | 31982 | 32263 | 0.88 | 37268 | 37250 | -0.05 |
| 30-34 | 39798 | 39742 | -0.14 | 35331 | 35398 | 0.19 | 34290 | 34459 | 0.49 |
| 35-39 | 36127 | 36138 | 0.03 | 41249 | 41298 | 0.12 | 32819 | 32640 | -0.54 |
| 40-44 | 30481 | 30420 | -0.20 | 41169 | 41105 | -0.15 | 35290 | 35665 | 1.06 |
| 45-49 | 23705 | 23774 | 0.29 | 36424 | 36402 | -0.06 | 40620 | 40662 | 0.10 |
| 50-59 | 36447 | 36504 | 0.16 | 52830 | 52729 | -0.19 | 75128 | 75155 | 0.04 |
| 60-80 | 59202 | 59104 | -0.17 | 61699 | 61719 | 0.03 | 77831 | 78351 | 0.67 |
Validation over 30 years: Comparison of microsimulation population with observed New York Census data by sex, age and race/ethnicity for New York in 1990, 2000 and 2010.
| 1990 | 2000 | 2010 | |||||||
|---|---|---|---|---|---|---|---|---|---|
| Census | Microsimulation | % difference | Census | Microsimulation | % difference | Census | Microsimulation | % difference | |
| Non-hispanic black | 203411 | 203766 | 0.17 | 220719 | 222012 | 0.59 | 228852 | 229342 | 0.21 |
| Hispanic | 172834 | 172456 | -0.22 | 222108 | 222888 | 0.35 | 272005 | 273095 | 0.40 |
| Non-hispanic other | 61089 | 61337 | 0.40 | 124280 | 124349 | 0.06 | 153691 | 154913 | 0.80 |
| Non-hispanic white | 1024415 | 1025457 | 0.10 | 959074 | 961237 | 0.23 | 934043 | 937438 | 0.36 |
| Female | 761670 | 761875 | 0.03 | 790144 | 791188 | 0.13 | 817689 | 819644 | 0.24 |
| Male | 700079 | 701141 | 0.15 | 736038 | 739298 | 0.44 | 770903 | 775144 | 0.55 |
| 12-17 | 136200 | 136168 | -0.02 | 154810 | 155244 | 0.28 | 152705 | 152433 | -0.18 |
| 18-24 | 195342 | 195446 | 0.05 | 176545 | 177476 | 0.53 | 198351 | 197888 | -0.23 |
| 25-29 | 156461 | 156771 | 0.20 | 130472 | 130603 | 0.10 | 138017 | 138531 | 0.37 |
| 30-34 | 157357 | 157366 | 0.01 | 145259 | 145251 | -0.01 | 127916 | 128229 | 0.24 |
| 35-39 | 142646 | 142724 | 0.05 | 156608 | 157221 | 0.39 | 125412 | 125733 | 0.26 |
| 40-44 | 129822 | 129878 | 0.04 | 150821 | 150918 | 0.06 | 135589 | 136657 | 0.79 |
| 45-49 | 104231 | 104498 | 0.26 | 134113 | 135044 | 0.69 | 145876 | 146118 | 0.17 |
| 50-59 | 168346 | 168855 | 0.30 | 214380 | 215146 | 0.36 | 265733 | 267341 | 0.60 |
| 60-80 | 271342 | 271310 | -0.01 | 263170 | 263583 | 0.16 | 298991 | 301858 | 0.96 |
Validation over 30 years: Comparison of microsimulation population with observed Tennessee Census data by sex, age and race/ethnicity for Tennessee in 1990, 2000 and 2010.
| 1990 | 2000 | 2010 | |||||||
|---|---|---|---|---|---|---|---|---|---|
| Census | Microsimulation | % difference | Census | Microsimulation | % difference | Census | Microsimulation | % difference | |
| Non-hispanic black | 58944 | 59118 | 0.29 | 71218 | 72081 | 1.21 | 83928 | 84558 | 0.75 |
| Hispanic | 2510 | 2638 | 5.08 | 9501 | 9813 | 3.27 | 20757 | 20408 | -1.69 |
| Non-hispanic other | 3330 | 3293 | -1.13 | 9852 | 9412 | -4.47 | 14876 | 13982 | -6.01 |
| Non-hispanic white | 329997 | 330040 | 0.01 | 369846 | 369830 | 0.00 | 397473 | 397650 | 0.04 |
| Female | 205013 | 205311 | 0.15 | 235860 | 236255 | 0.17 | 264499 | 264319 | -0.07 |
| Male | 189770 | 189778 | 0.00 | 224559 | 224881 | 0.14 | 252538 | 252279 | -0.10 |
| 12-17 | 40625 | 40802 | 0.43 | 46594 | 46712 | 0.25 | 50588 | 50958 | 0.73 |
| 18-24 | 52765 | 53048 | 0.54 | 54885 | 55152 | 0.49 | 60636 | 61647 | 1.67 |
| 25-29 | 40297 | 40215 | -0.21 | 40382 | 40665 | 0.70 | 41768 | 42291 | 1.25 |
| 30-34 | 40934 | 40907 | -0.07 | 41207 | 41344 | 0.33 | 40631 | 41241 | 1.50 |
| 35-39 | 38632 | 38674 | 0.11 | 45332 | 45356 | 0.05 | 42362 | 42421 | 0.14 |
| 40-44 | 35466 | 35428 | -0.11 | 44920 | 45124 | 0.45 | 43050 | 42886 | -0.38 |
| 45-49 | 28655 | 28733 | 0.27 | 41270 | 41055 | -0.52 | 46708 | 46310 | -0.85 |
| 50-59 | 46060 | 46138 | 0.17 | 66815 | 66972 | 0.23 | 87434 | 86703 | -0.84 |
| 60-80 | 71345 | 71144 | -0.28 | 79010 | 78756 | -0.32 | 103857 | 102141 | -1.65 |
Validation over 30 years: Comparison of microsimulation population with observed Texas Census data by sex, age and race/ethnicity for Texas in 1990, 2000 and 2010.
| 1990 | 2000 | 2010 | |||||||
|---|---|---|---|---|---|---|---|---|---|
| Census | Microsimulation | % difference | Census | Microsimulation | % difference | Census | Microsimulation | % difference | |
| Non-hispanic black | 150605 | 151745 | 0.76 | 184182 | 186782 | 1.41 | 231568 | 234354 | 1.20 |
| Hispanic | 318866 | 315727 | -0.98 | 496386 | 496677 | 0.06 | 707160 | 705827 | -0.19 |
| Non-hispanic other | 30092 | 30105 | 0.04 | 69796 | 70057 | 0.37 | 109792 | 110317 | 0.48 |
| Non-hispanic white | 833485 | 835227 | 0.21 | 897181 | 896111 | -0.12 | 946896 | 950742 | 0.41 |
| Female | 676865 | 678536 | 0.25 | 827750 | 828635 | 0.11 | 1004674 | 1006934 | 0.22 |
| Male | 656185 | 654268 | -0.29 | 819796 | 820992 | 0.15 | 990744 | 994306 | 0.36 |
| 12-17 | 151020 | 152366 | 0.89 | 194815 | 195371 | 0.29 | 224420 | 224980 | 0.25 |
| 18-24 | 189084 | 190275 | 0.63 | 219888 | 221856 | 0.89 | 257296 | 258752 | 0.57 |
| 25-29 | 153274 | 153165 | -0.07 | 159152 | 161364 | 1.39 | 185303 | 185649 | 0.19 |
| 30-34 | 155343 | 154084 | -0.81 | 157056 | 157573 | 0.33 | 176043 | 176824 | 0.44 |
| 35-39 | 137252 | 136045 | -0.88 | 168888 | 167637 | -0.74 | 176358 | 177412 | 0.60 |
| 40-44 | 116650 | 117079 | 0.37 | 163335 | 163100 | -0.14 | 169479 | 169548 | 0.04 |
| 45-49 | 90658 | 90565 | -0.10 | 141617 | 141005 | -0.43 | 176046 | 176132 | 0.05 |
| 50-59 | 138364 | 138433 | 0.05 | 209148 | 209162 | 0.01 | 309779 | 309683 | -0.03 |
| 60-80 | 201403 | 200792 | -0.30 | 233645 | 232559 | -0.46 | 320689 | 322260 | 0.49 |
Data and code availability
The National Survey on Drug Use and Health is publicly available and can be accessed from the Substance Abuse and Mental Health Data Archive https://datafiles.samhsa.gov/
The Panel Study of Income Dynamics is publicly available and can be accessed from the Institute for Social Research, University of Michigan https://simba.isr.umich.edu/data/data.aspx
U.S Census data is publicly available and can be accessed from IPUMS National Historic Geographic Information Service https://data2.nhgis.org/main
The American Community survey is publicly available and can be accessed from IPUMS-USA https://usa.ipums.org/usa/
Mortality data is publicly available and can be accessed from the Center for Disease Control and Prevention https://wonder.cdc.gov/mortSQL.html
The CASCADE-POP model is licensed under the GNU General Public License version 3 and the code is available open source at https://bitbucket.org/r01cascade/ijm_cascadepop/
On publication, the code for the model will be made available via an online public repository.