
This article contains 6 figures and 1 table.
Figures
Tables
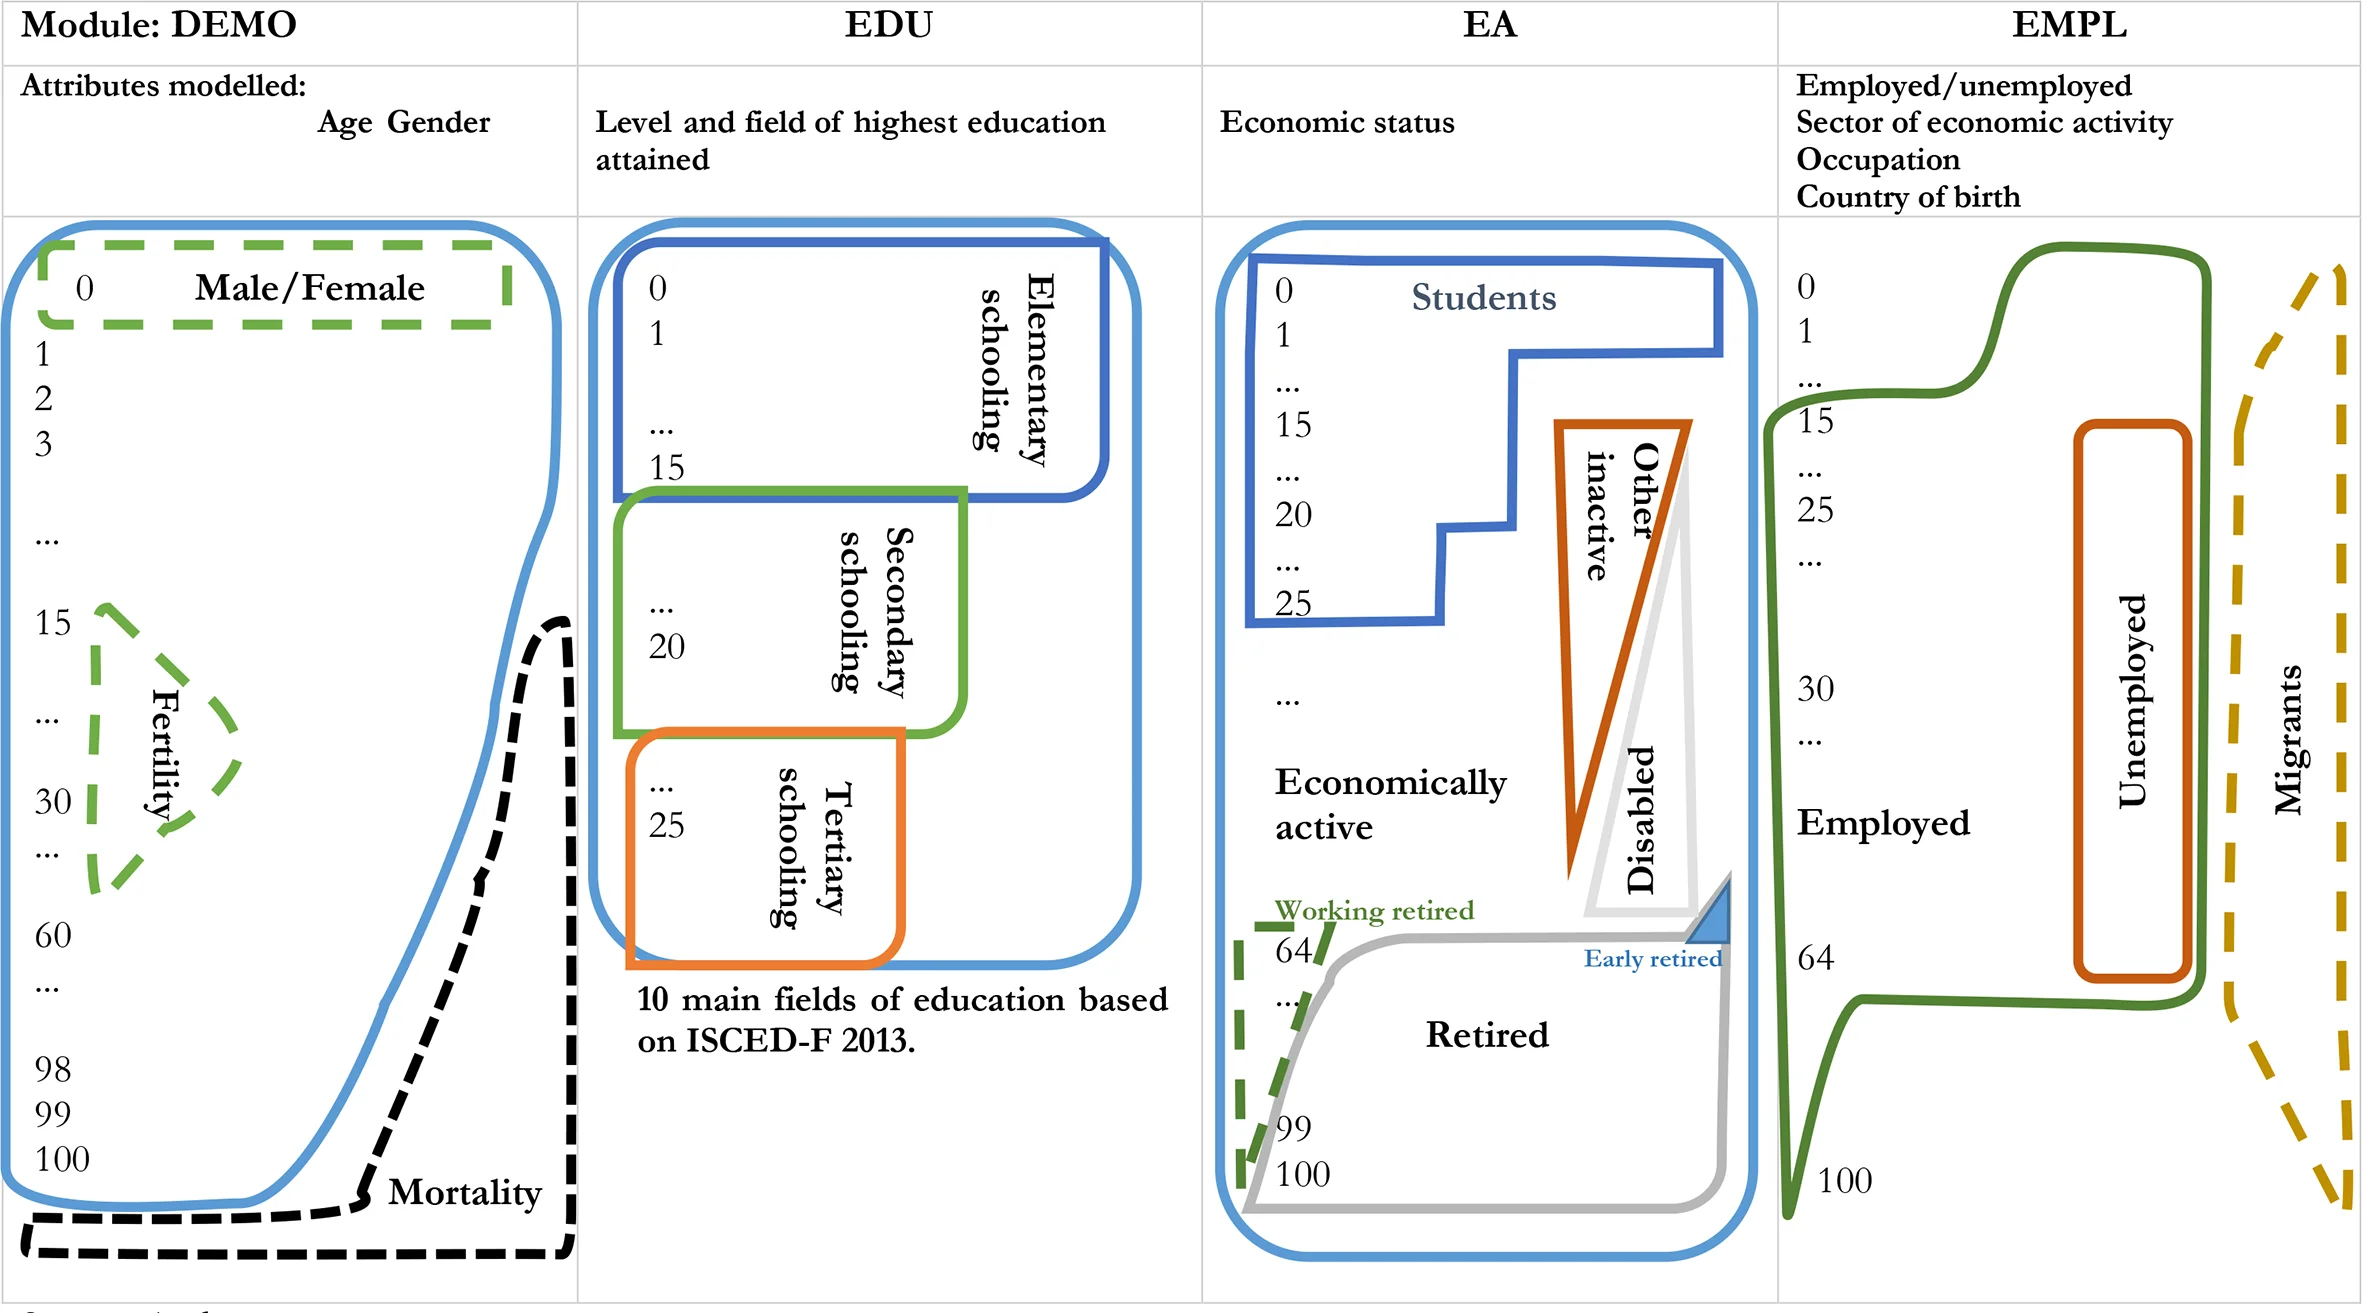
| Variable | Values |
|---|---|
| Gender | MaleFemale |
| Age | In years |
| Highest level of education achieved | Primary Lower secondary Upper secondary Post-secondary Tertiary |
| Field of highest education achieved | 10 fields (based on ISCED-F 2013) |
| Economic status in the current period | Employed Unemployed Student Retired Disabled Inactive |
| Economic status one year ago | |
| Economic sector of employment in the current period | 18 sectors (based on NACE 2.0) |
| Economic sector of employment one year ago | |
| Occupational group | 3 groups* (based on ISCO 08 skill levels) (ISCO1-3; ISCO 4-8; ISCO 9) |
| Occupational group one year ago | |
| Country of birth | Native EU Non-EU |
Source: Model SLAMM.
Corresponding to the skill levels of the ISCO classification allows constructing indicators of skills mismatch (ILO, 2012, p. 12).