IrpetDin. A Dynamic Microsimulation Model for Italy and the Region of Tuscany
- Istituto Regionale Programmazione Economica della Toscana, Italy
Figures

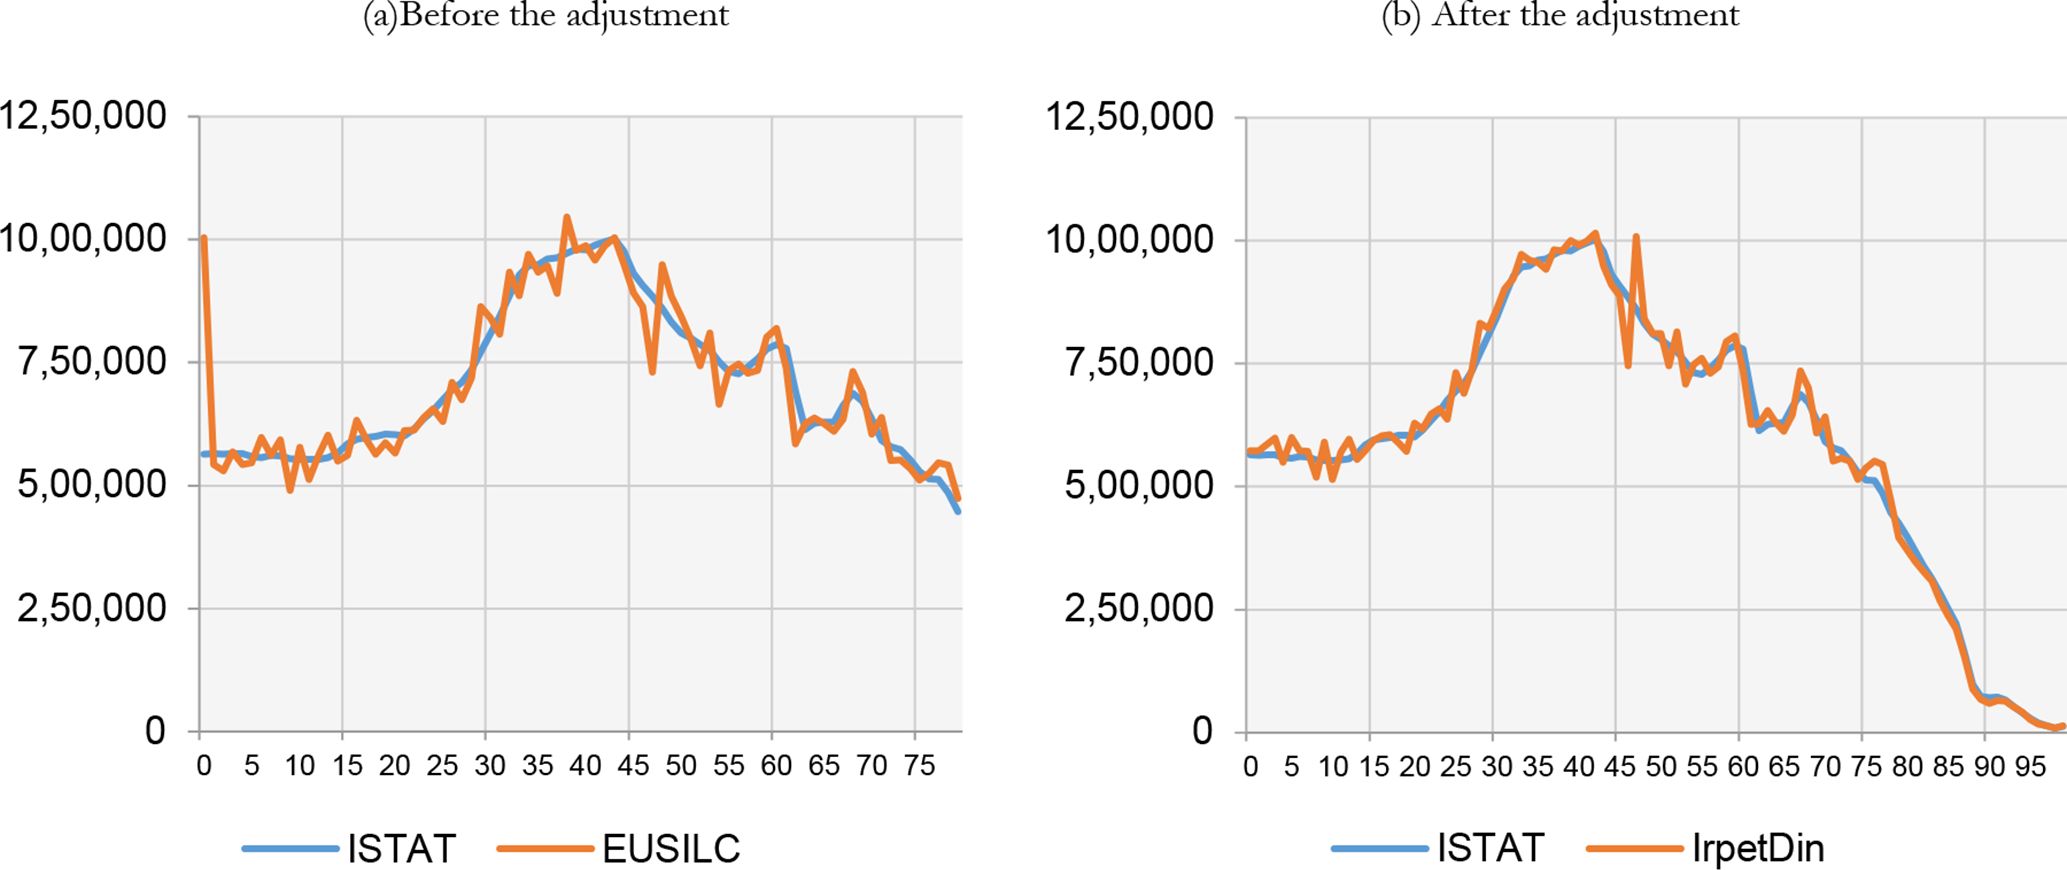
Italian population by age. Italy.

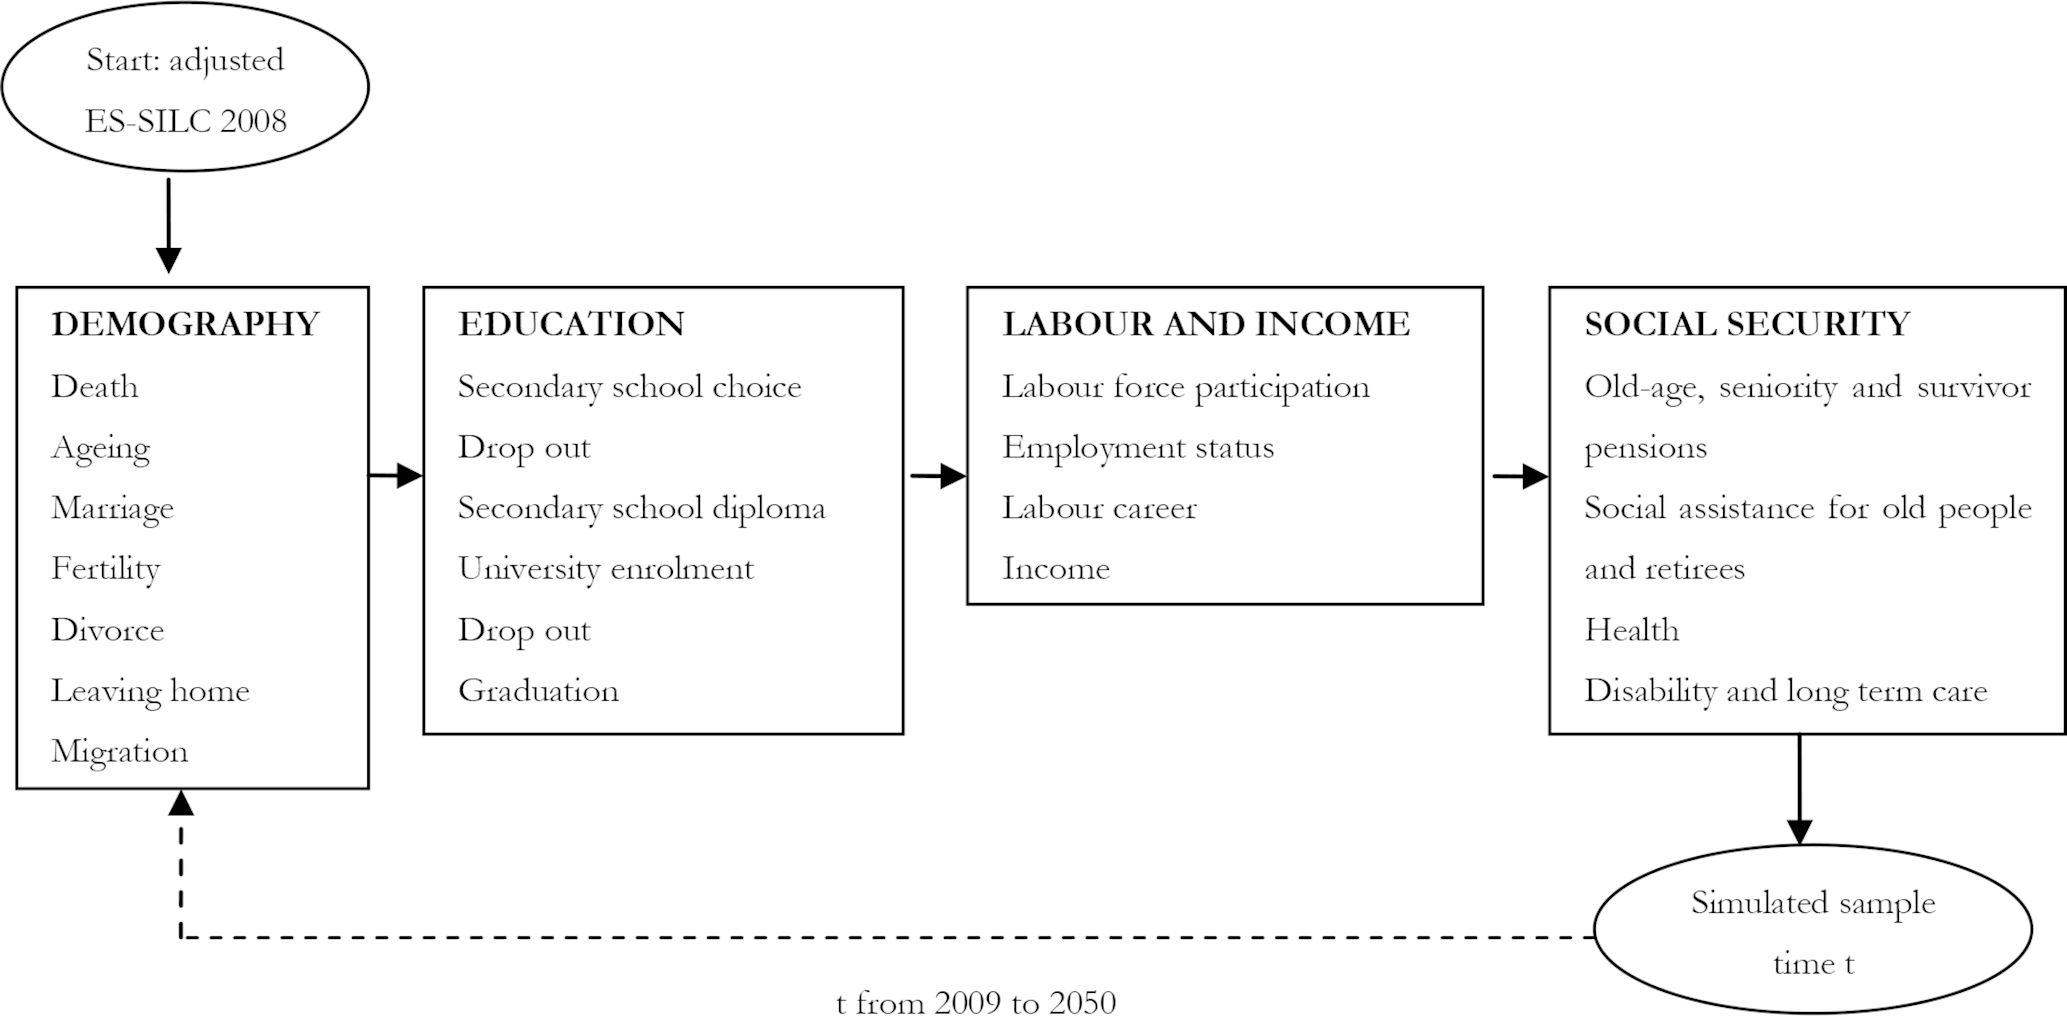
IrpetDin’s structure.

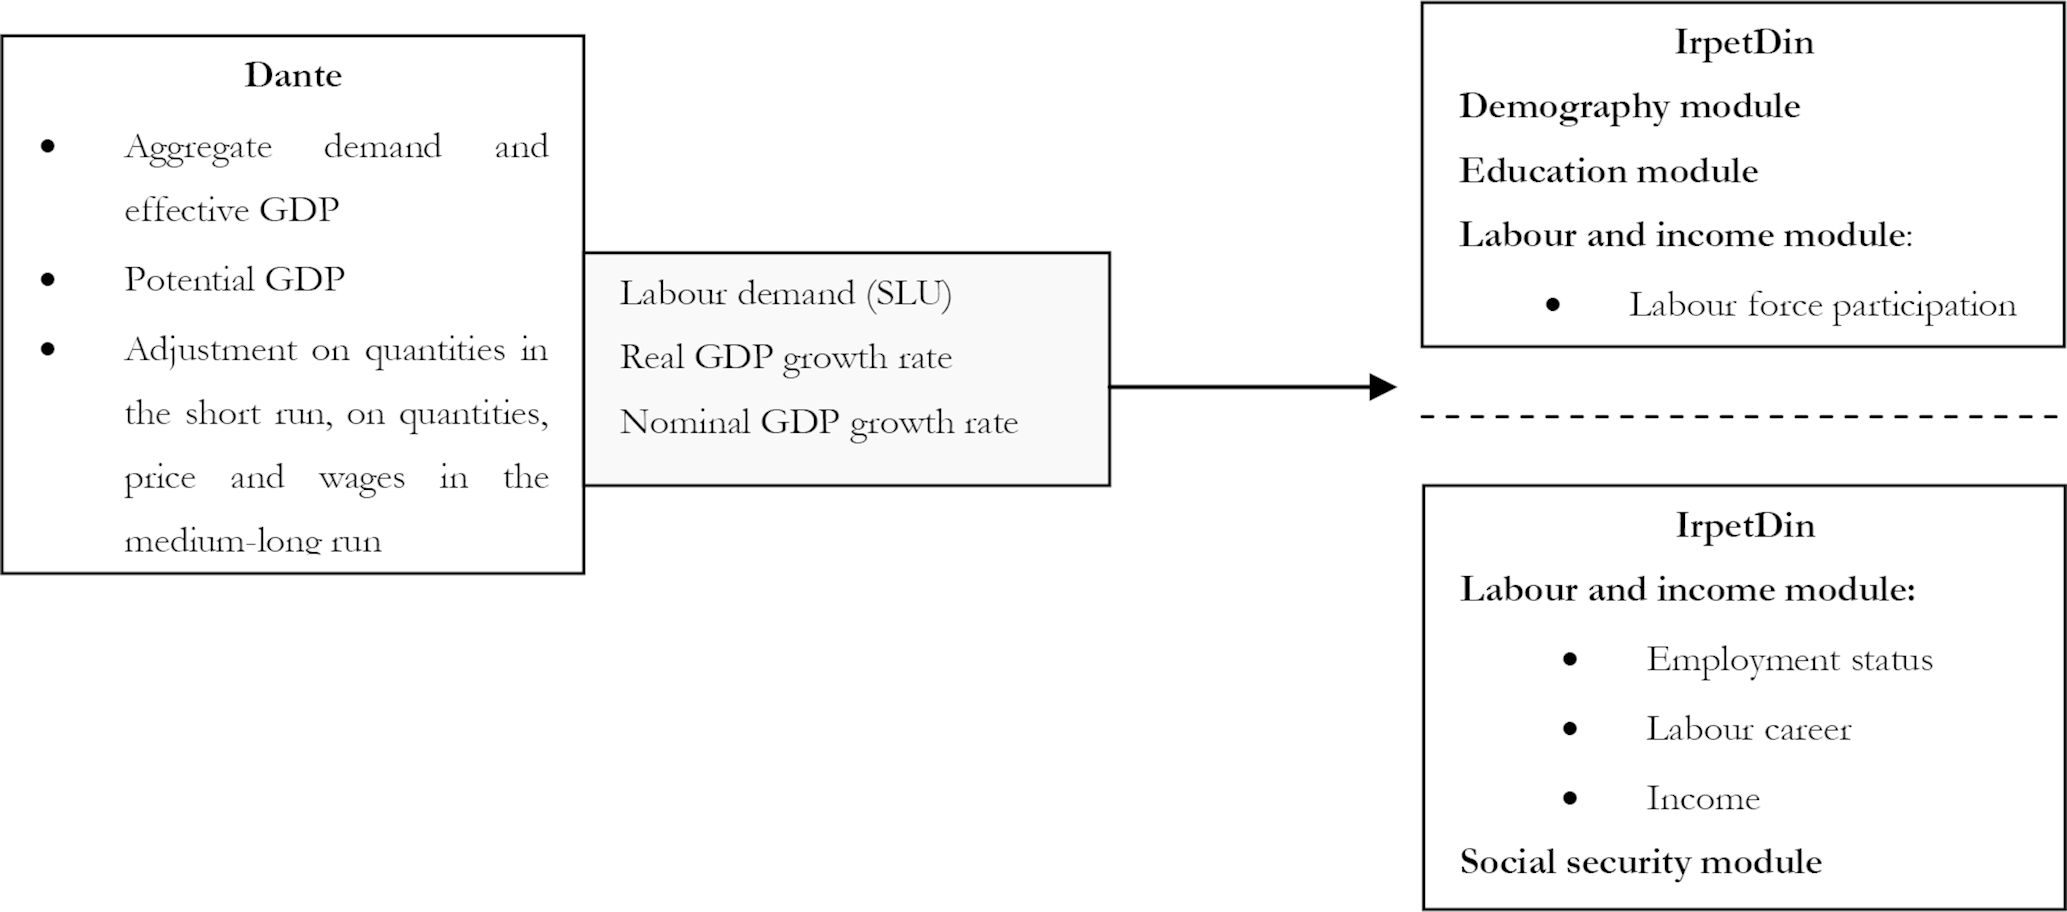
IrpetDin’s alignements to Dante.

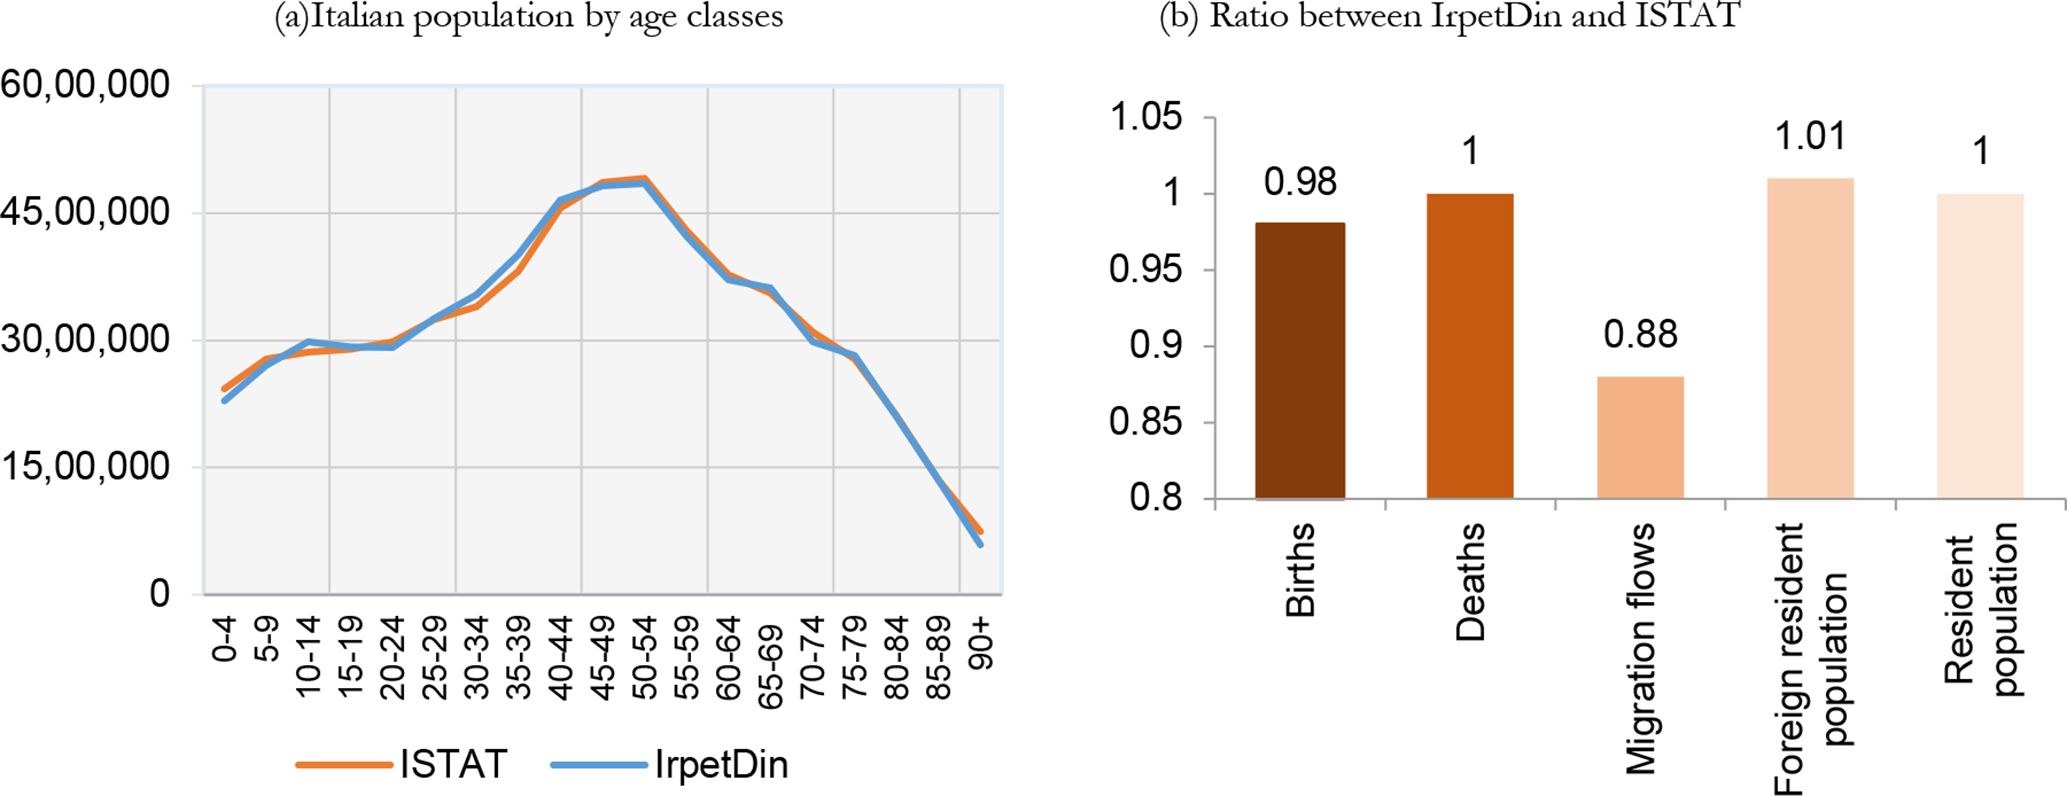
Validation of demography. Year 2017. Italy.

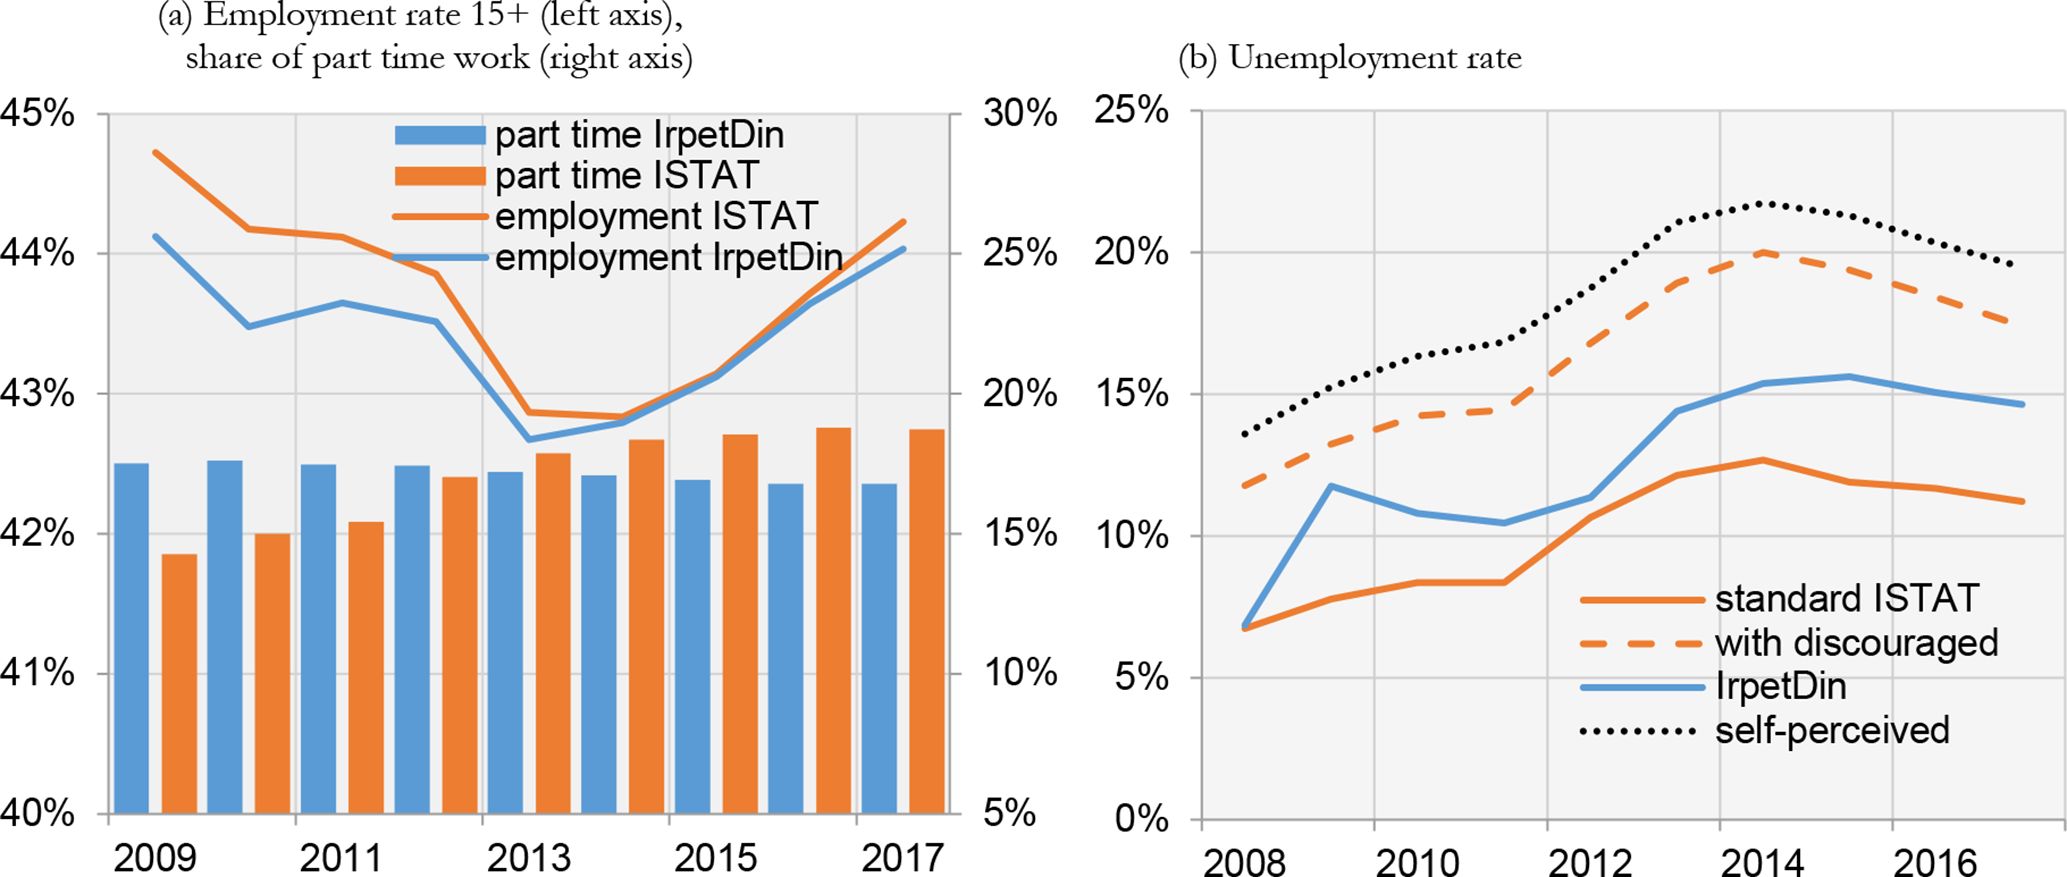
Validation of labour market indicators. Italy.

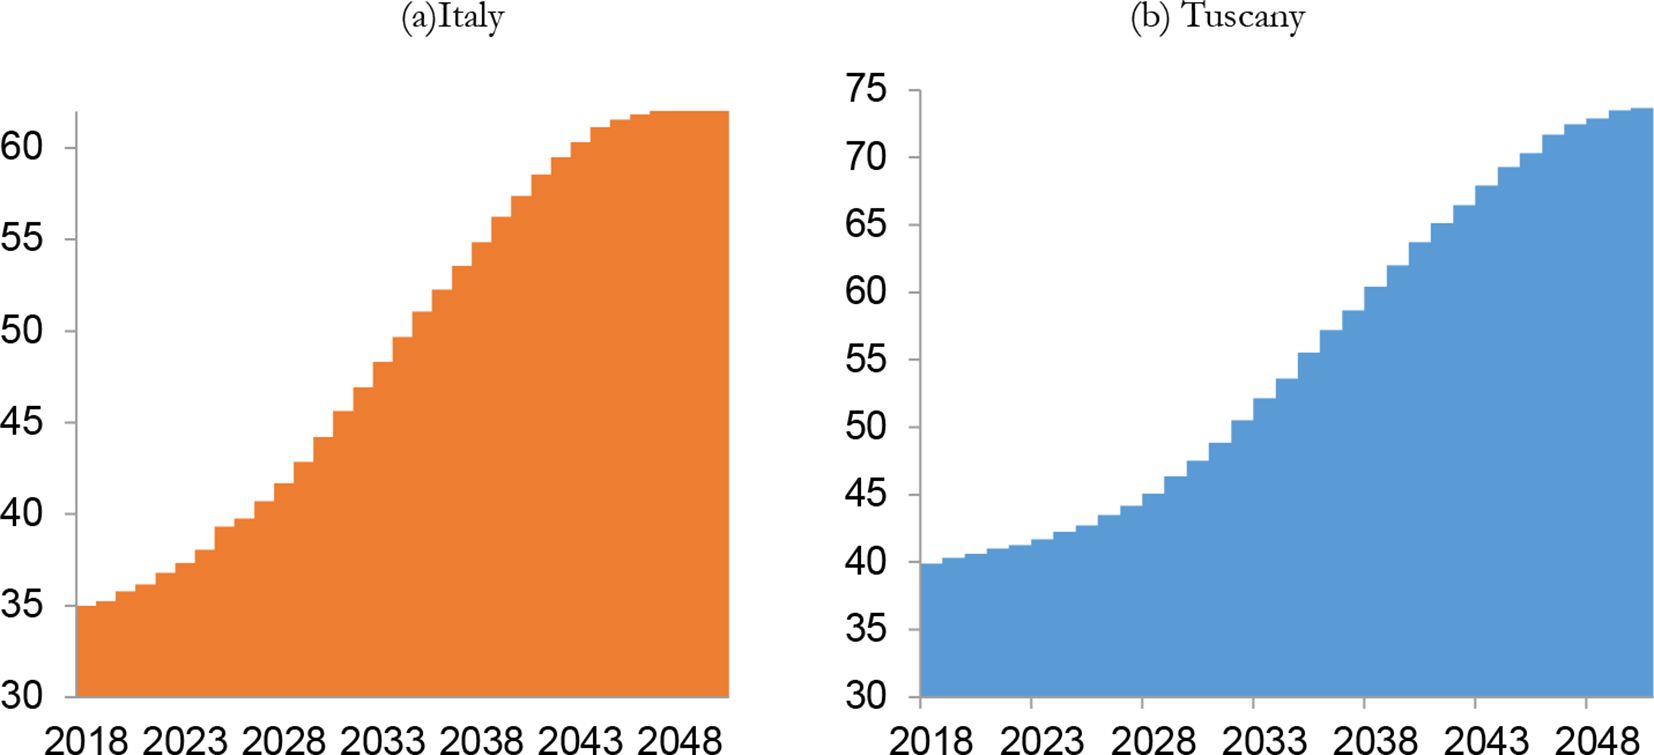
Demographic dependence for Italy and Tuscany (%).
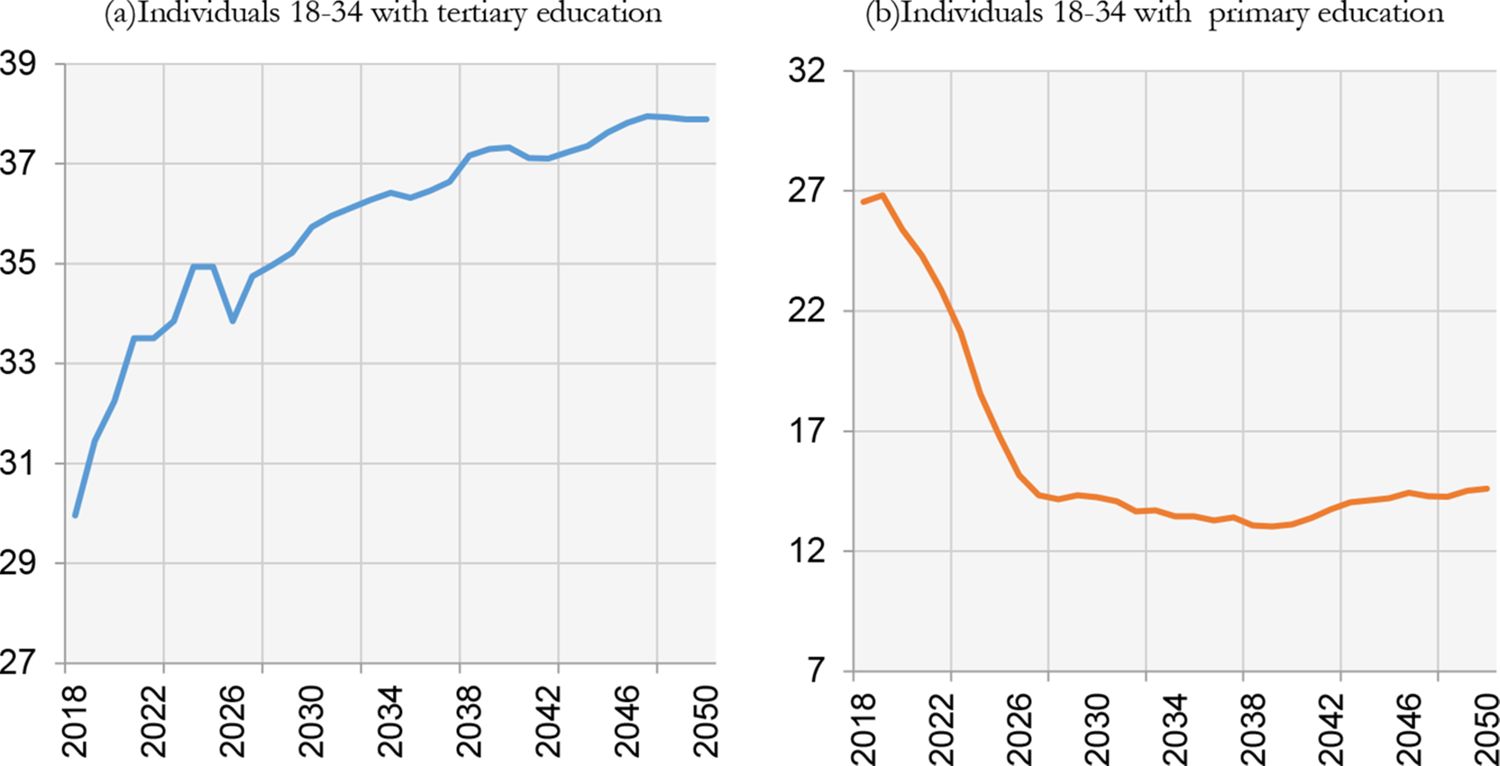
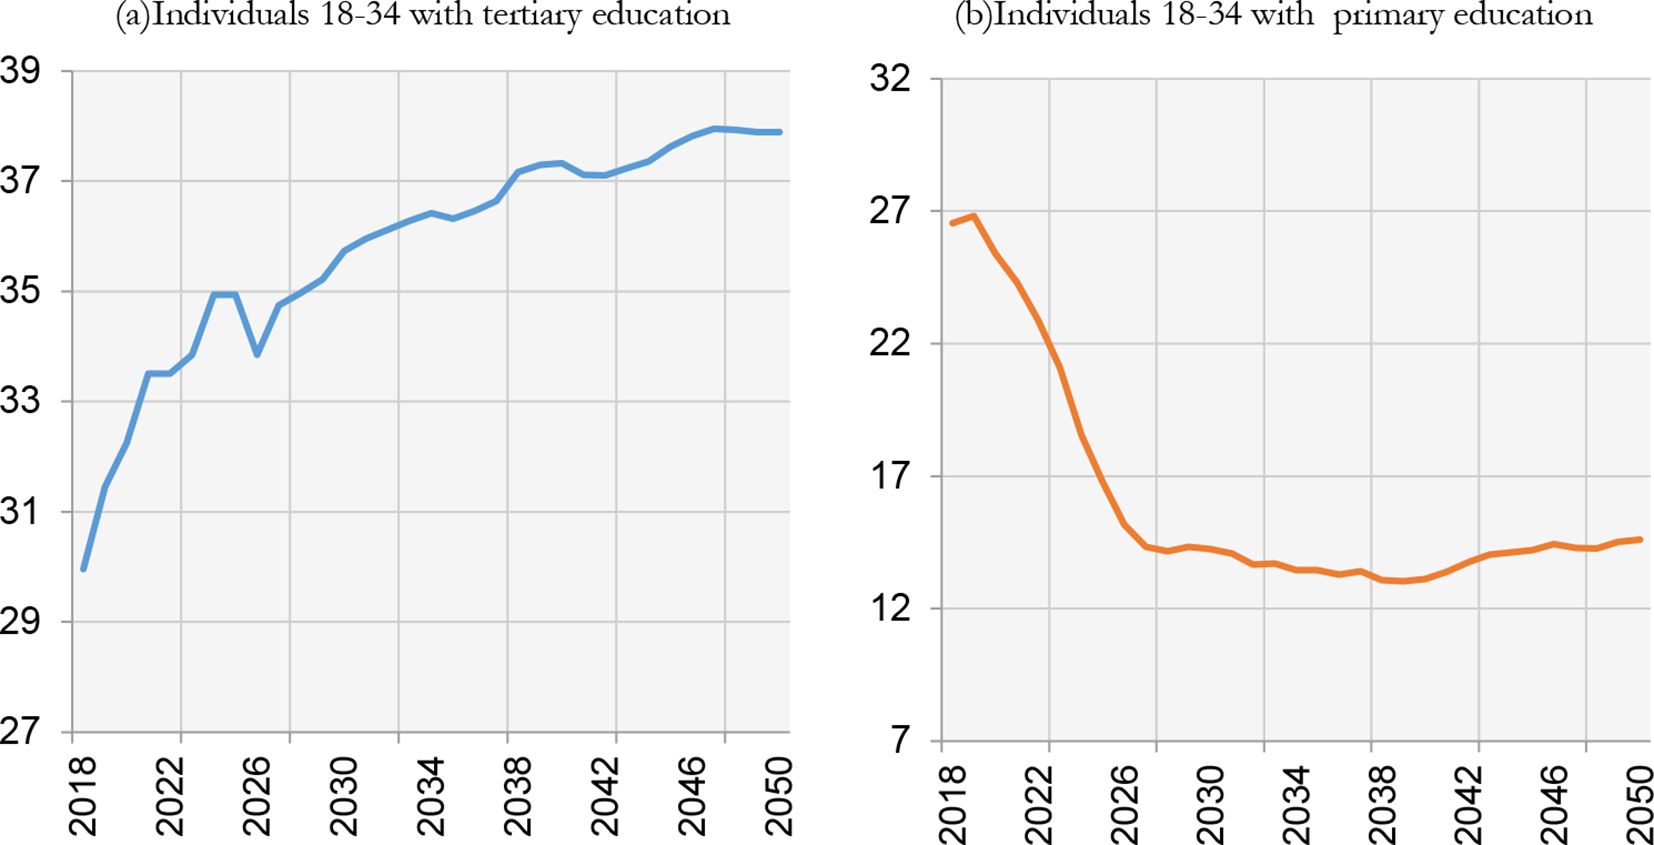
Education. Italy.

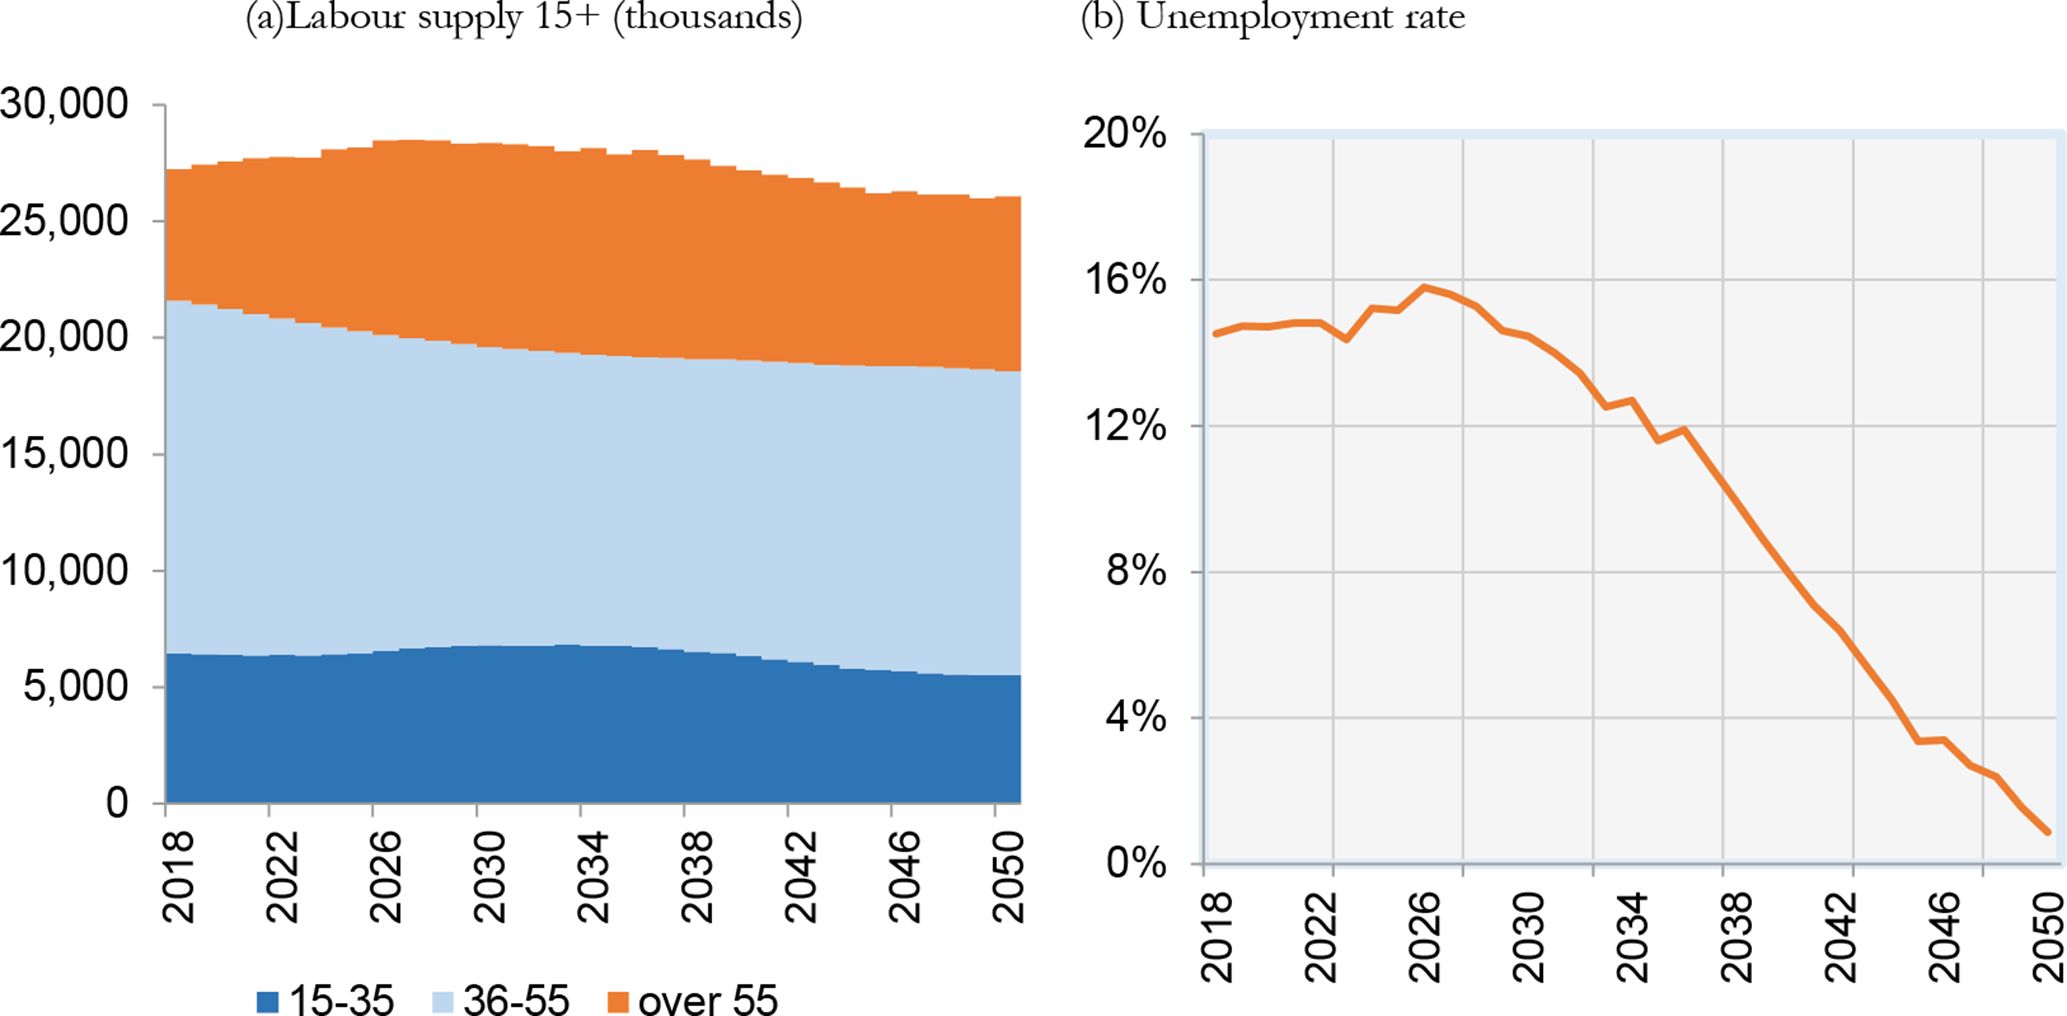
Labour supply and unemployment. Italy.

Quantitative and qualitative mismatch. Italy.

Pensions flows and stocks. Italy.

Pensions: intra-generational equity. Italy.

Pensions: financial sustainability and inter-generational equity. Italy.

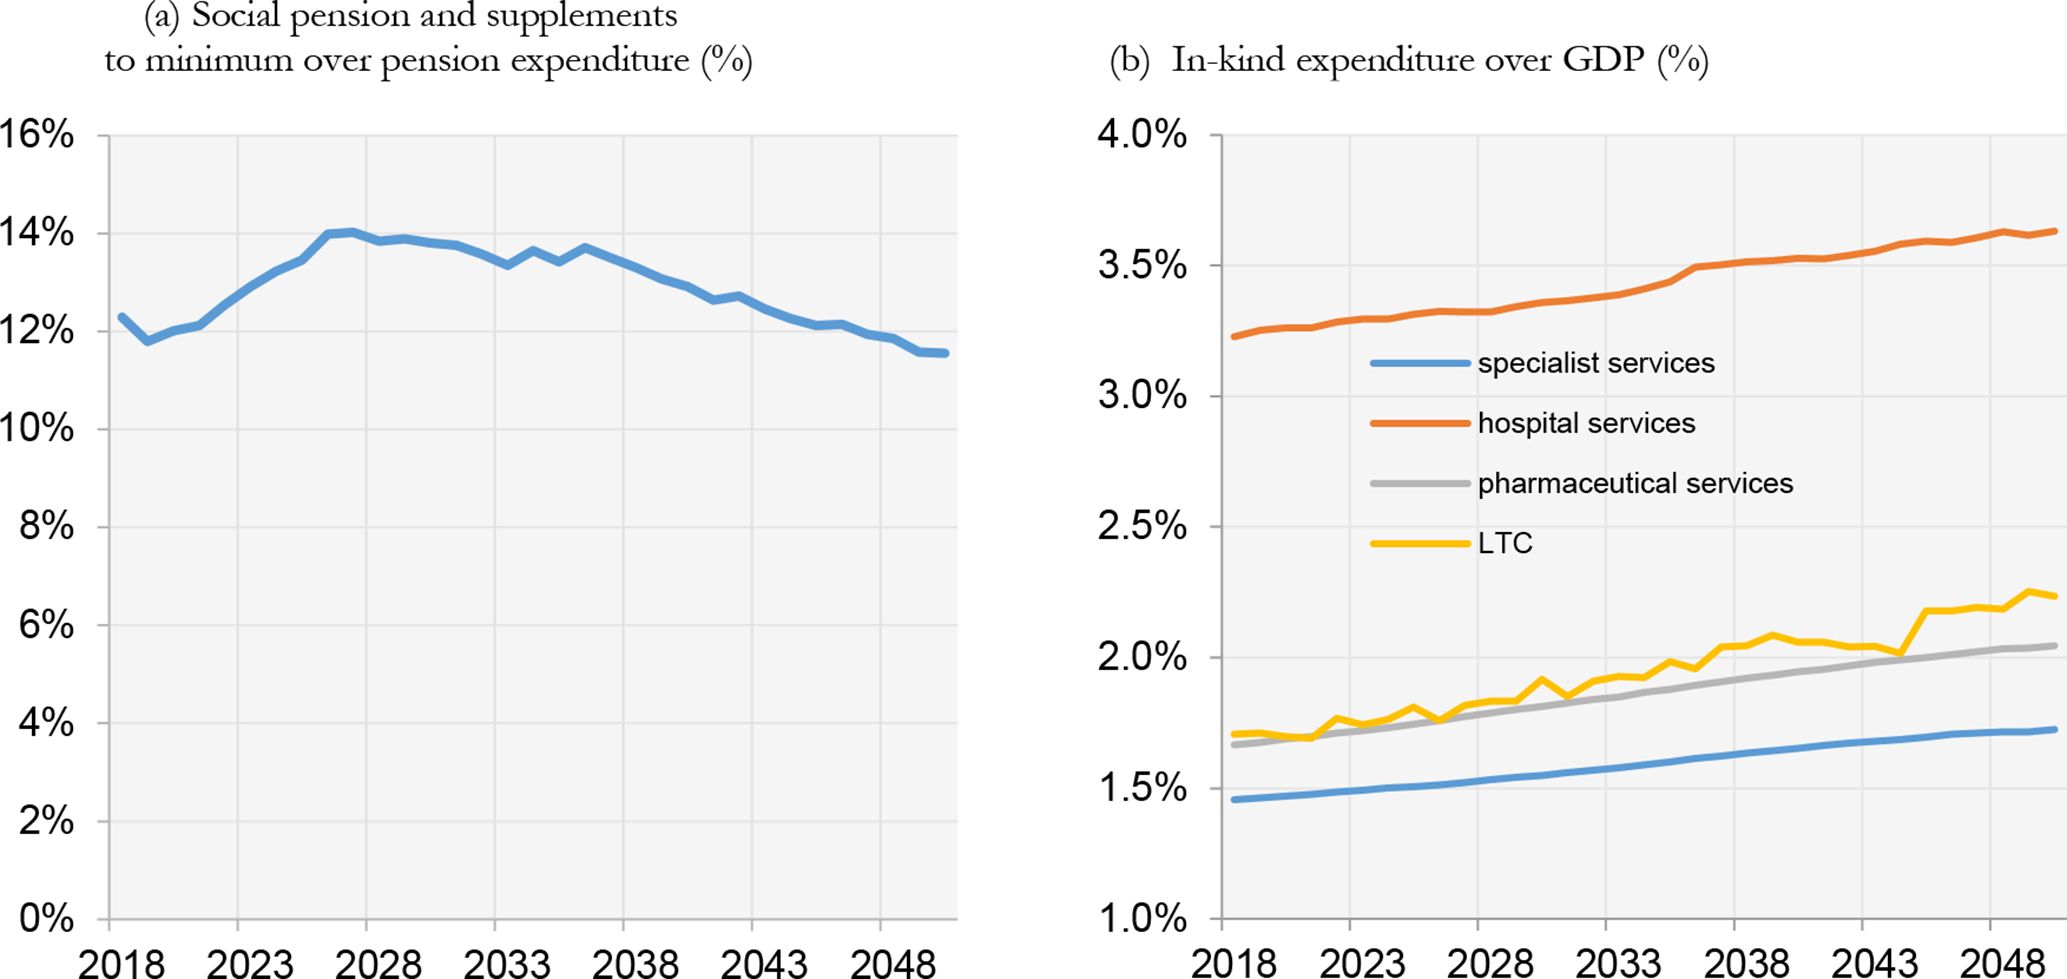
Social assistance for old people and in-kind services.
Tables
Validation of pensions. Italy
| IrpetDin | ISTAT | Ratio IreptDin ISTAT | |
|---|---|---|---|
| Stock of retirees in 2017 | 10,800,000 | 11,039,137 | 0.98 |
| Pension flows 2016-2017-2018 | 284,138 | 291,115 | 0.98 |
| Pension expenditure (billion euro) in 2017 | 236 | 232 | 1.01 |
-
Source: IrpetDin, ISTAT.
Exogenous indicators/variables
| Indicator/variabile | External source | |
|---|---|---|
| Demographic trends | Life expectancy | ISTAT forecast, central scenario |
| Fertility | ISTAT forecast, central scenario | |
| Migration flows | ISTAT forecast, central scenario | |
| Economic trends | GDP real growth rate | Dante until 2035, then our assumption |
| GDP nominal growth rate | Dante until 2035, then our assumption | |
| Standard Labour Units | Dante until 2035, then our assumption | |
| Ratio SLU/employed | Our assumption | |
| Labour income growth rate | Our assumption | |
| Part time work | Our assumption | |
| Social security programmes | Pensions and social assistance for old-people | As current legislation |
| Health and long term care | As current legislation | |
| Health and LTC costs growth rate | Our assumption |
Unemployment rate, percentiles of replacement rates for employees and employed, Gini among retirees
| 2018-2032 | 2033-2042 | 2043-2050 | ||
|---|---|---|---|---|
| Basic scenario | Unemployment | 11,3% | 4,6% | 0,1% |
| p25 employees | 62,4% | 57,8% | 54,0% | |
| p75 employees | 78,5% | 74,2% | 72,4% | |
| p25 self-employed | 42,5% | 34,0% | 30,1% | |
| p75 self-employed | 53,4% | 43,7% | 42,2% | |
| Gini | 0,322 | 0,305 | 0,305 | |
| Official scenario | Unemployment | 9,7% | 6,8% | 5,4% |
| p25 employees | 62,4% | 58,0% | 54,2% | |
| p75 employees | 78,5% | 74,3% | 72,5% | |
| p25 self-employed | 42,5% | 34,1% | 30,2% | |
| p75 self-employed | 53,4% | 43,8% | 42,2% | |
| Gini | 0,322 | 0,305 | 0,305 |
Main features of IrpetDin’s modules
| EVENT | POTENTIAL CANDIDATES | PROBABILITIES ESTIMATION METHOD | VARIABLES USED TO DETERMINE EVENTS | DATA SOURCE FOR PROBABILITIES ESTIMATION | DATA SOUCE FOREVENTUAL ALIGNEMNTS | |
|---|---|---|---|---|---|---|
| Ageing | All individuals | |||||
| Mortality | All individuals | Rates taken from external sources | Territory, age, gender | Mortality tables ISTAT (2008-16) | ISTAT forecast, central scenario (2008–2050) | |
| Marriage | Single, divorced, widowed aged 18–59 | Our calculated rates | Territory, age, gender, education | Official data on marriage ISTAT (2008–2013) | ||
| Fertility | Married/cohabitant women aged 18–45 | Our calculated rates | Territory, age, n° children, education, nationality | Birth attendance certificates RT (2007–2013) + ISTAT survey on births (2012) | ISTAT forecast, central scenario (2008–2050) | |
| Dissolution | Married/cohabitant aged 20–64, at least 3 years of marriage | Our calculated rates | Territory, age, gender, nationality | Official data on civil status ISTAT (2008–2013) | ||
| Leaving home | Individuals aged 18–59, unmarried, employed, not the head of the family | Our calculated rates | Territory, age, gender | Survey “Famiglia e soggetti sociali” ISTAT (2013) | ||
| DEMOGRAPHY | Migration flows | All individuals | Our calculated rates | Territory, gender, education, occupational status, type and size of the family | Individual data on registrations and cancellations ISTAT + Demographic balances of foreign citizens ISTAT (2009–2017) | ISTAT forecast, central scenario (2008–2050) |
| Choice of secondary school | Individuals aged below 16 | Our estimation with multinomial logit | Territory, gender, parents’ education | Survey on secondary school graduates ISTAT (2011; 2015) | ||
| Educational attainments at secondary school (drop-out, repeating, high school certificate) | Enrolled to 1° year of secondary school | Our calculated rates and estimation with multinomial logit | Territory, gender, parents’ education, type of secondary school | School register RT (2008-13) + Survey on secondary school graduates ISTAT (2011; 2015) | ||
| Entry to tertiary school | Individuals with secondary school diploma | Our calculated rates | Territory, gender, type of secondary school, mark, year of study | University register (2008–2013) + Survey on secondary school graduates ISTAT (2011; 2015) | ||
| EDUCATION | University career (drop outs, three- and five-year degree) | Enrolled to university | Our calculated rates | Territory, age, gender, type of course | Survey on university graduates ISTAT (2011; 2015) | |
| Entry in the labour force | Individuals leaving the school (aged 15–39) and inactive people | Calculated | Territory, gender, age, education, role within HH | Labour Force Survey ISTAT (2009–2013; 2014–2016) | ||
| Employment status | Individuals belong to the labour force | Matching between labour demand (Dante) and labour supply (IrpetDin) | Territory, education e sector | INPS, data on hours of redundancy funds and Unioncamere – Minister of Labour, Excelsior survey. (2008–2014) | Labour demand aligned to Dante 2008–2035, then our assumption | |
| Career employment | All individuals employed | Our calculated rates | Sector | Labour Force Survey ISTAT (2009–2013) | ||
| LABOUR AND INCOME | Wages and earnings | All individuals employed | Our estimation with OLS | Territory, age, gender, contributory seniority, educational level, work status, number of hours worked, citizenship | EU-SILC ISTAT (2003–2013) | |
| SOCIAL SECURITY | Retirement | All non-pensioners accruing retirement requirements | Pensions rules | |||
| Pension amount | All pensioners | Pensions rules | ||||
| Social pension | Individual aged above 65 with economic condition requirements | Pensions rules | ||||
| Integration at minimum pensions and pension supplements | Pensioners fulfilling age and economic condition requirements | Pensions rules | ||||
| Health | All individuals (insurance value approach) | Age, gender, education, nationality | Regional administrative data on specialist, pharmaceutical and hospital services (only Region of Tuscany) (2011) | |||
| Long Term Care | All individuals | Our estimation with logit | Age, gender and education | Survey “Multiscopo”, ISTAT (2014) |
Multinomial logit of high school choice
| Italy | Tuscany | ||||
|---|---|---|---|---|---|
| lyceum (base) | Coef. | P>z | Coef. | P>z | |
| technical | |||||
| female | –1,277 | 0,00 | –1,408 | 0,00 | |
| father with secondary education | –0,503 | 0,00 | –0,264 | 0,00 | |
| father with tertiray education | –1,398 | 0,00 | –1,704 | 0,00 | |
| mather with secondary education | –0,675 | 0,00 | –0,742 | 0,00 | |
| mather with tertiray education | –1,613 | 0,00 | –1,531 | 0,00 | |
| intercept | 1,051 | 0,00 | 0,998 | 0,00 | |
| professionalising | |||||
| female | –0,795 | 0,00 | –1,018 | 0,00 | |
| father with secondary education | –0,850 | 0,00 | –0,817 | 0,00 | |
| father with tertiray education | –1,849 | 0,00 | –1,412 | 0,00 | |
| mather with secondary education | –0,946 | 0,00 | –1,130 | 0,00 | |
| mather with tertiray education | –1,916 | 0,00 | –2,163 | 0,00 | |
| intercept | 0,308 | 0,00 | 0,479 | 0,00 | |
| others | |||||
| female | 0,133 | 0,00 | 0,238 | 0,00 | |
| father with secondary education | –0,519 | 0,00 | –0,512 | 0,00 | |
| father with tertiray education | –0,896 | 0,00 | –1,566 | 0,00 | |
| mather with secondary education | –0,288 | 0,00 | –0,333 | 0,00 | |
| mather with tertiray education | –0,544 | 0,00 | –0,379 | 0,00 | |
| intercept | –2,189 | 0,00 | –2,049 | 0,00 | |
-
Source: our estimation on survey on secondary school graduates ISTAT (2011; 2015).
Multinomial logit of high school mark
| Italy | Tuscany | ||||
|---|---|---|---|---|---|
| under 70 (base) | Coef, | P>z | Coef, | P>z | |
| 70–80 | |||||
| female | 0,383 | 0,00 | 0,371 | 0,00 | |
| father with secondary education | 0,159 | 0,00 | 0,178 | 0,00 | |
| father with tertiray education | 0,316 | 0,00 | –0,106 | 0,04 | |
| mather with secondary education | 0,098 | 0,00 | 0,174 | 0,00 | |
| mather with tertiray education | 0,266 | 0,00 | 0,283 | 0,00 | |
| intercept | –0,739 | 0,00 | –0,536 | 0,00 | |
| 80–90 | |||||
| female | 0,639 | 0,00 | 0,792 | 0,00 | |
| father with secondary education | 0,191 | 0,00 | 0,501 | 0,00 | |
| father with tertiray education | 0,499 | 0,00 | 0,469 | 0,00 | |
| mather with secondary education | 0,230 | 0,00 | 0,006 | 0,88 | |
| mather with tertiray education | 0,483 | 0,00 | –0,158 | 0,02 | |
| intercept | –1,518 | 0,00 | –1,404 | 0,00 | |
| 90–100 | |||||
| female | 0,789 | 0,00 | 0,584 | 0,00 | |
| father with secondary education | 0,501 | 0,00 | 0,258 | 0,00 | |
| father with tertiray education | 0,974 | 0,00 | –0,030 | 0,65 | |
| mather with secondary education | 0,482 | 0,00 | 0,809 | 0,00 | |
| mather with tertiray education | 0,827 | 0,00 | 1,229 | 0,00 | |
| intercept | –2,168 | 0,00 | –2,113 | 0,00 |
-
Source: our estimation on survey on secondary school graduates ISTAT (2011; 2015).
Logit of the being a part-timer
| 2009-2013 | 2018-2019 | |||||||
|---|---|---|---|---|---|---|---|---|
| Coef. | Std. Err. | Wald Chi-Square | Pr > ChiQuadr | Coef. | Std. Err. | Wald Chi-Square | Pr > ChiQuadr | |
| Woman | 2,0279 | 0,0076 | 71247,14 | <.0001 | 1,781 | 0,0106 | 28357,22 | <.0001 |
| Age | –0,017 | 0,000311 | 2995,31 | <.0001 | –0,0165 | 0,000423 | 1517,71 | <.0001 |
| Number of children | 0,216 | 0,00484 | 1991,45 | <.0001 | 0,1288 | 0,00648 | 394,59 | <.0001 |
| Intercept | –2,2154 | 0,0148 | 22545,18 | <.0001 | –1,7406 | 0,0209 | 6913,29 | <.0001 |
| Number of obs | 791,126 | 307,954 | ||||||
-
Source: our estimation on Italian Labour Force survey 2009-2013 2018-2019, ISTAT.
OLS of the logarithm of income from employee work
| Coef. | Std. Err. | t | Pr > |t| | |
|---|---|---|---|---|
| Intercept | 7.70048 | 0.01596 | 482.35 | <.0001 |
| Age | 0.04376 | 0.000727 | 60.15 | <.0001 |
| Age(squared) | –0.0004 | 8.74E-06 | –46.05 | <.0001 |
| Man | 0.18824 | 0.00259 | 72.54 | <.0001 |
| Primary education | –0.12254 | 0.00469 | –26.14 | <.0001 |
| Tertiary education | –0.16541 | 0.00875 | –18.91 | <.0001 |
| Tertiary Education (squared) | 0.00664 | 0.000213 | 31.15 | <.0001 |
| Exceutive | 0.52652 | 0.00418 | 125.91 | <.0001 |
| Office worker | 0.28028 | 0.00268 | 104.45 | <.0001 |
| Head of the household | 0.07564 | 0.00248 | 30.46 | <.0001 |
| Women with children<18 | –0.00165 | 0.00482 | –0.34 | 0.7327 |
| Ptime | 0.14081 | 0.0055 | 25.62 | <.0001 |
| Working hours | 0.0194 | 0.000148 | 130.86 | <.0001 |
| R2 0.4226 |
-
Source: our estimation on EU-SILC2008. ISTAT.
OLS of the logarithm of income from self-employed work
| Coef. | Std. Err. | t | Pr > |t| | |
|---|---|---|---|---|
| Intercept | 8.52019 | 0.03519 | 242.15 | <.0001 |
| Age | 0.01755 | 0.00116 | 15.07 | <.0001 |
| Age(squared) | –5.5E-05 | 1.18E-05 | –4.67 | <.0001 |
| Secondary Education | 0.1194 | 0.01231 | 9.7 | <.0001 |
| Tertiary education | –0.0409 | 0.03009 | –1.36 | 0.1741 |
| Tertiary education (squared) | 0.00904 | 0.000563 | 16.06 | <.0001 |
| Professionals | 0.01318 | 0.01036 | 1.27 | 0.2036 |
| Head of the household | 0.14279 | 0.0074 | 19.29 | <.0001 |
| Services | –0.02719 | 0.00781 | –3.48 | 0.0005 |
| Man | 0.20699 | 0.00779 | 26.59 | <.0001 |
| Working hours | 0.00615 | 0.00029 | 21.21 | <.0001 |
| R2 0.1549 |
-
Source: our estimation on EU-SILC2008. ISTAT.
Logit of the probability of being not self-sufficient
| Coef. | Std. Err. | z | P>z | [95% Conf.Interval] | ||
|---|---|---|---|---|---|---|
| Tertiary education | –1.110 | 0.635 | –1.750 | 0.080 | –2.354 | 0.134 |
| Woman | 0.652 | 0.149 | 4.360 | 0.000 | 0.359 | 0.945 |
| Age | 0.091 | 0.008 | 11.650 | 0.000 | 0.076 | 0.106 |
| Constant | –8.845 | 0.579 | –15.290 | 0.000 | –9.979 | –7.711 |
| Number of obs 7.049Pseudo R2 0.288 | ||||||
-
Source: our estimation on Survey “Multiscopo”, ISTAT (2014).
Data and code availability
IrpetDin has been developed using SAS, a general-purpose statistics package. The code and the executable are proprietary and not publicly available. The code is made up of approximately 2,500 rows.
EU-SILC data used to build IrpetDin are proprietary. The authors had access to the EU-SILC data thanks to an agreement with the Region of Tuscany, which belongs to the Italian Statistical System (SISTAN).