Validating risk factor and chronic disease projections in the Future Adult Model
- University of Southern California, California
Figures

Receiver Operating Characteristic for BMI <= 25 - Females

Receiver Operating Characteristic for BMI > 30 - Females
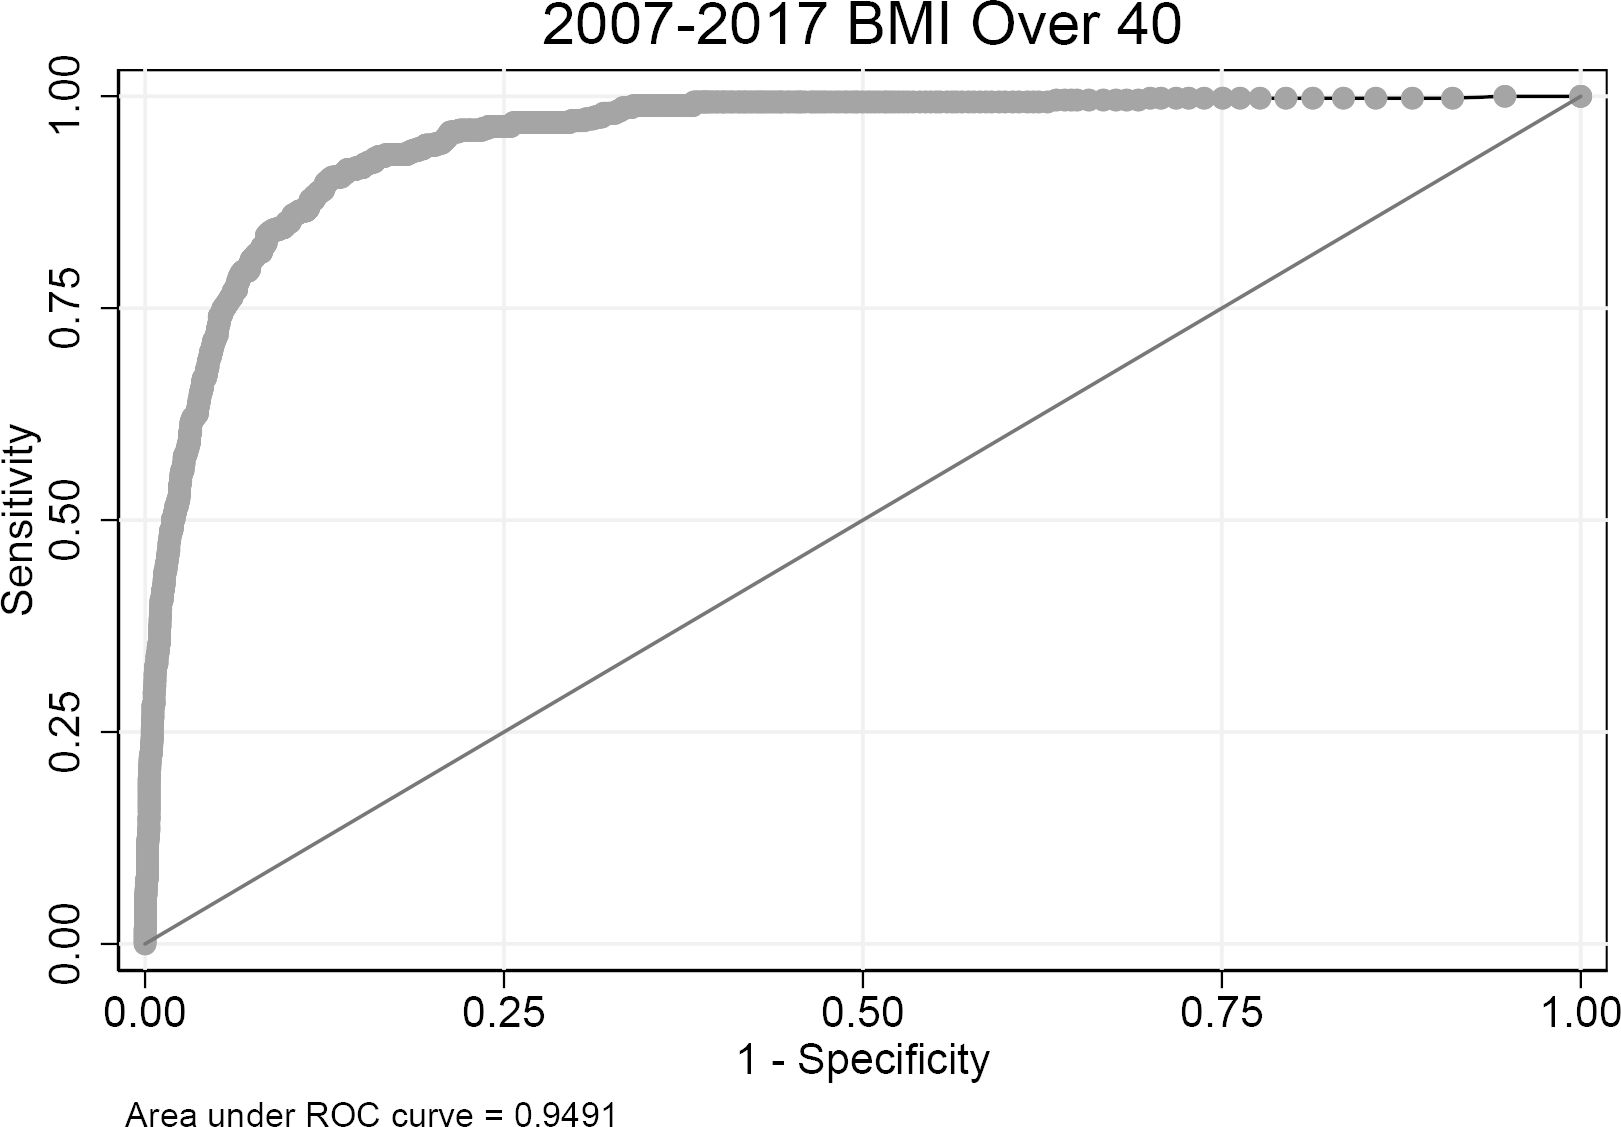

Receiver Operating Characteristic for BMI > 40 - Females
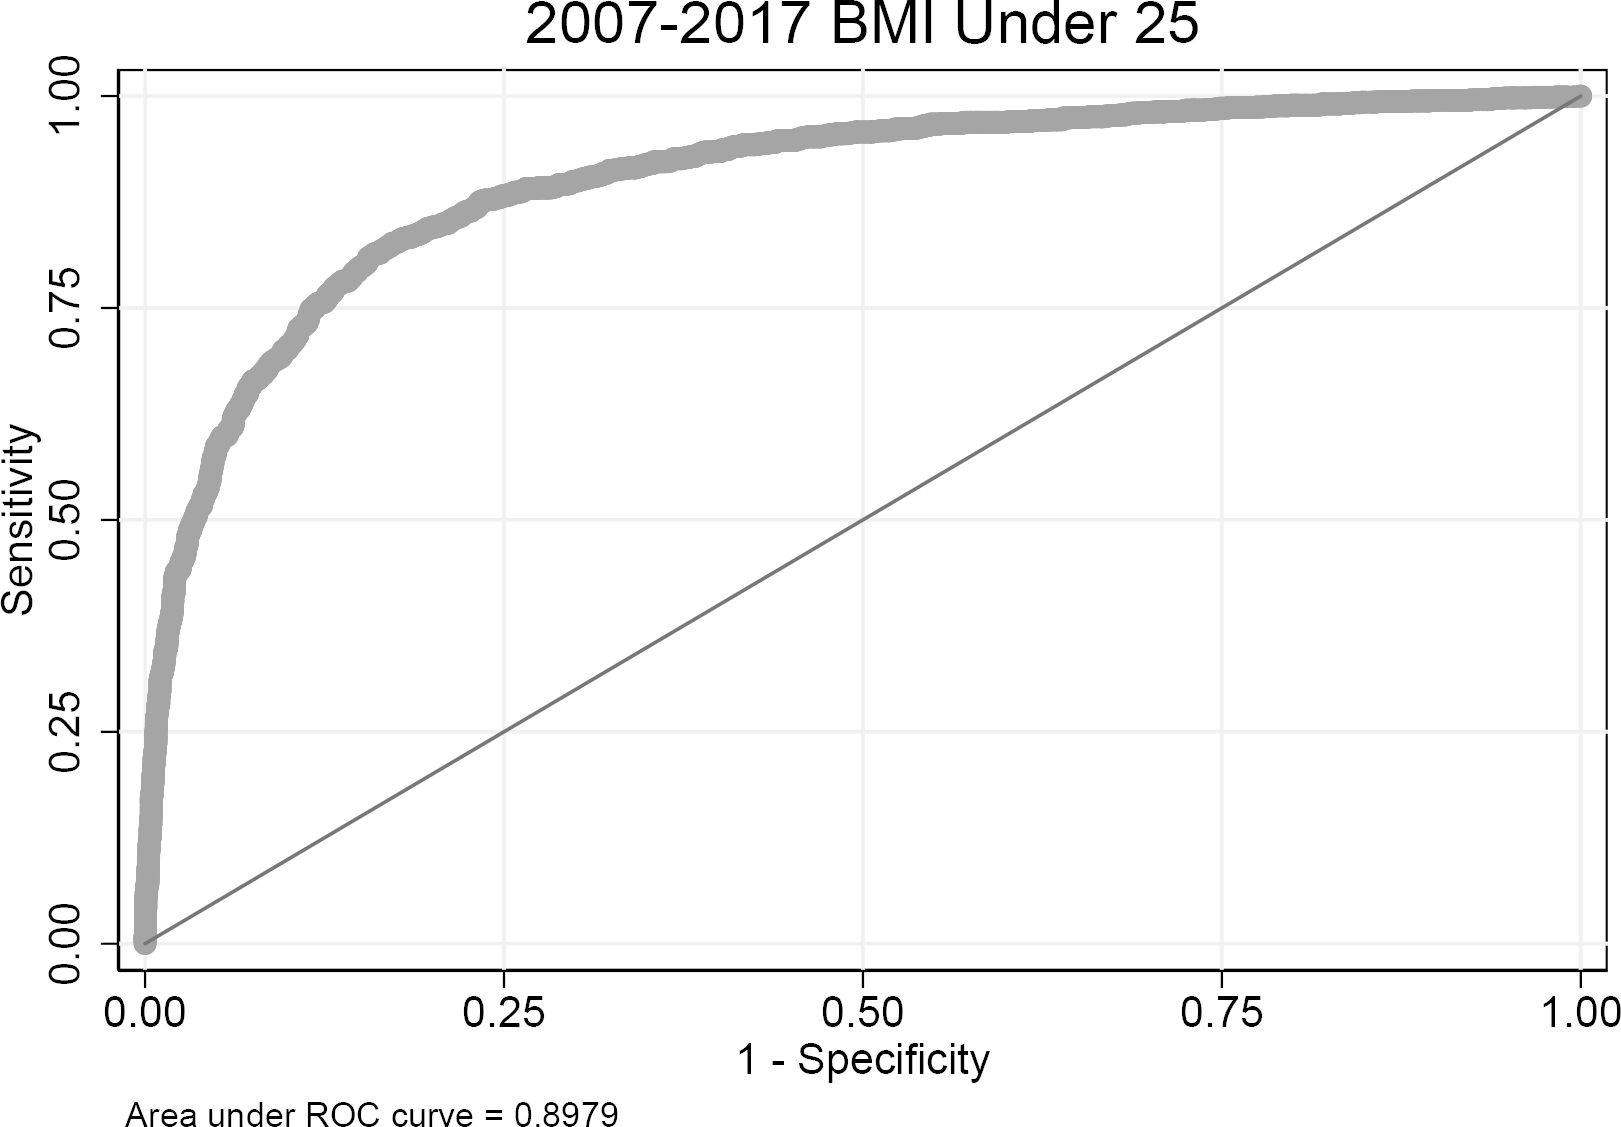

Receiver Operating Characteristic for BMI <= 25 - Males

Receiver Operating Characteristic for BMI > 30 - Males
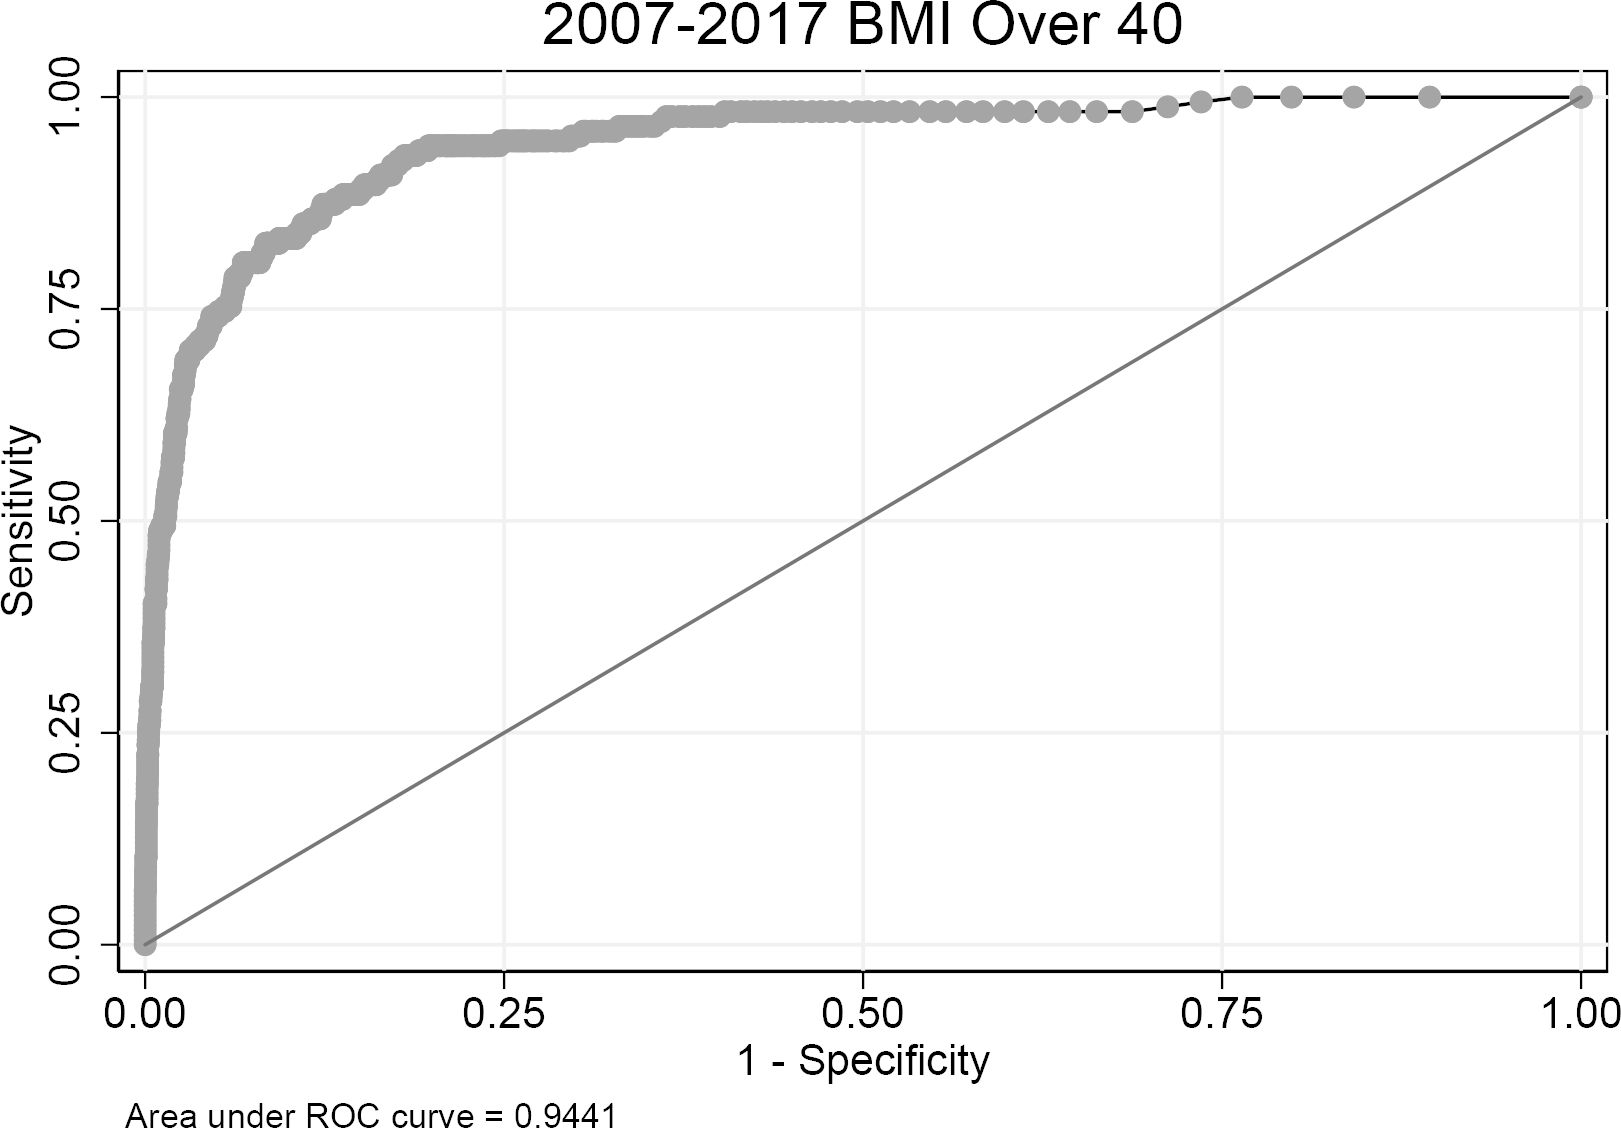

Receiver Operating Characteristic for BMI > 40 - Males
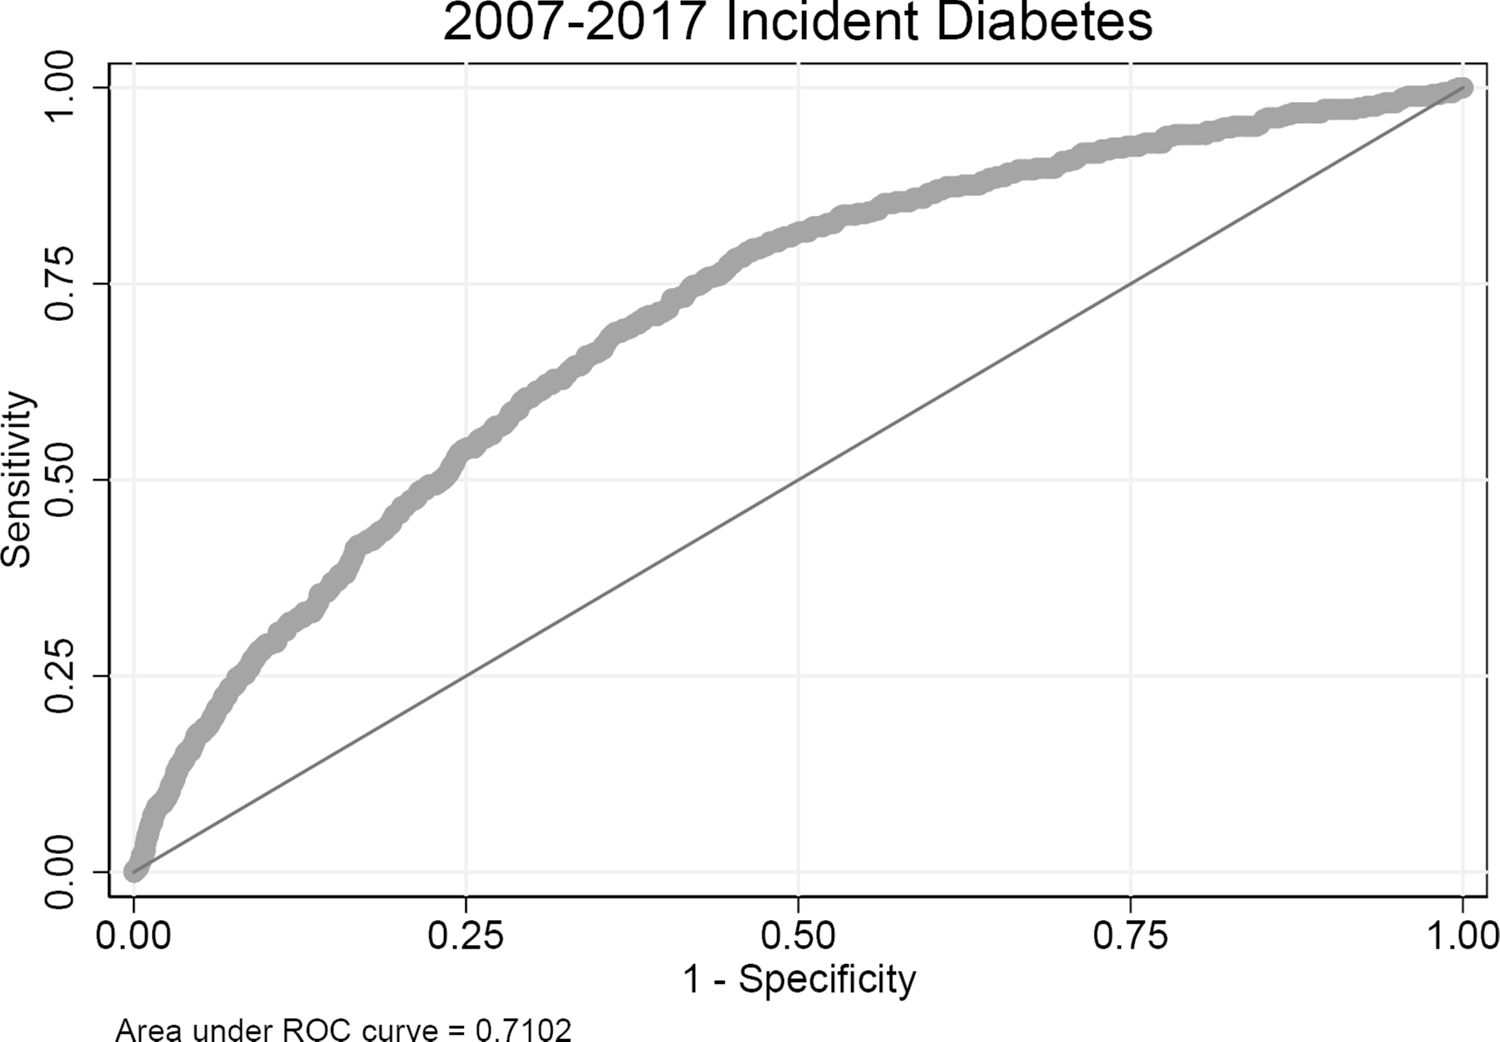
Receiver Operating Characteristic for Incident Diabetes - Females
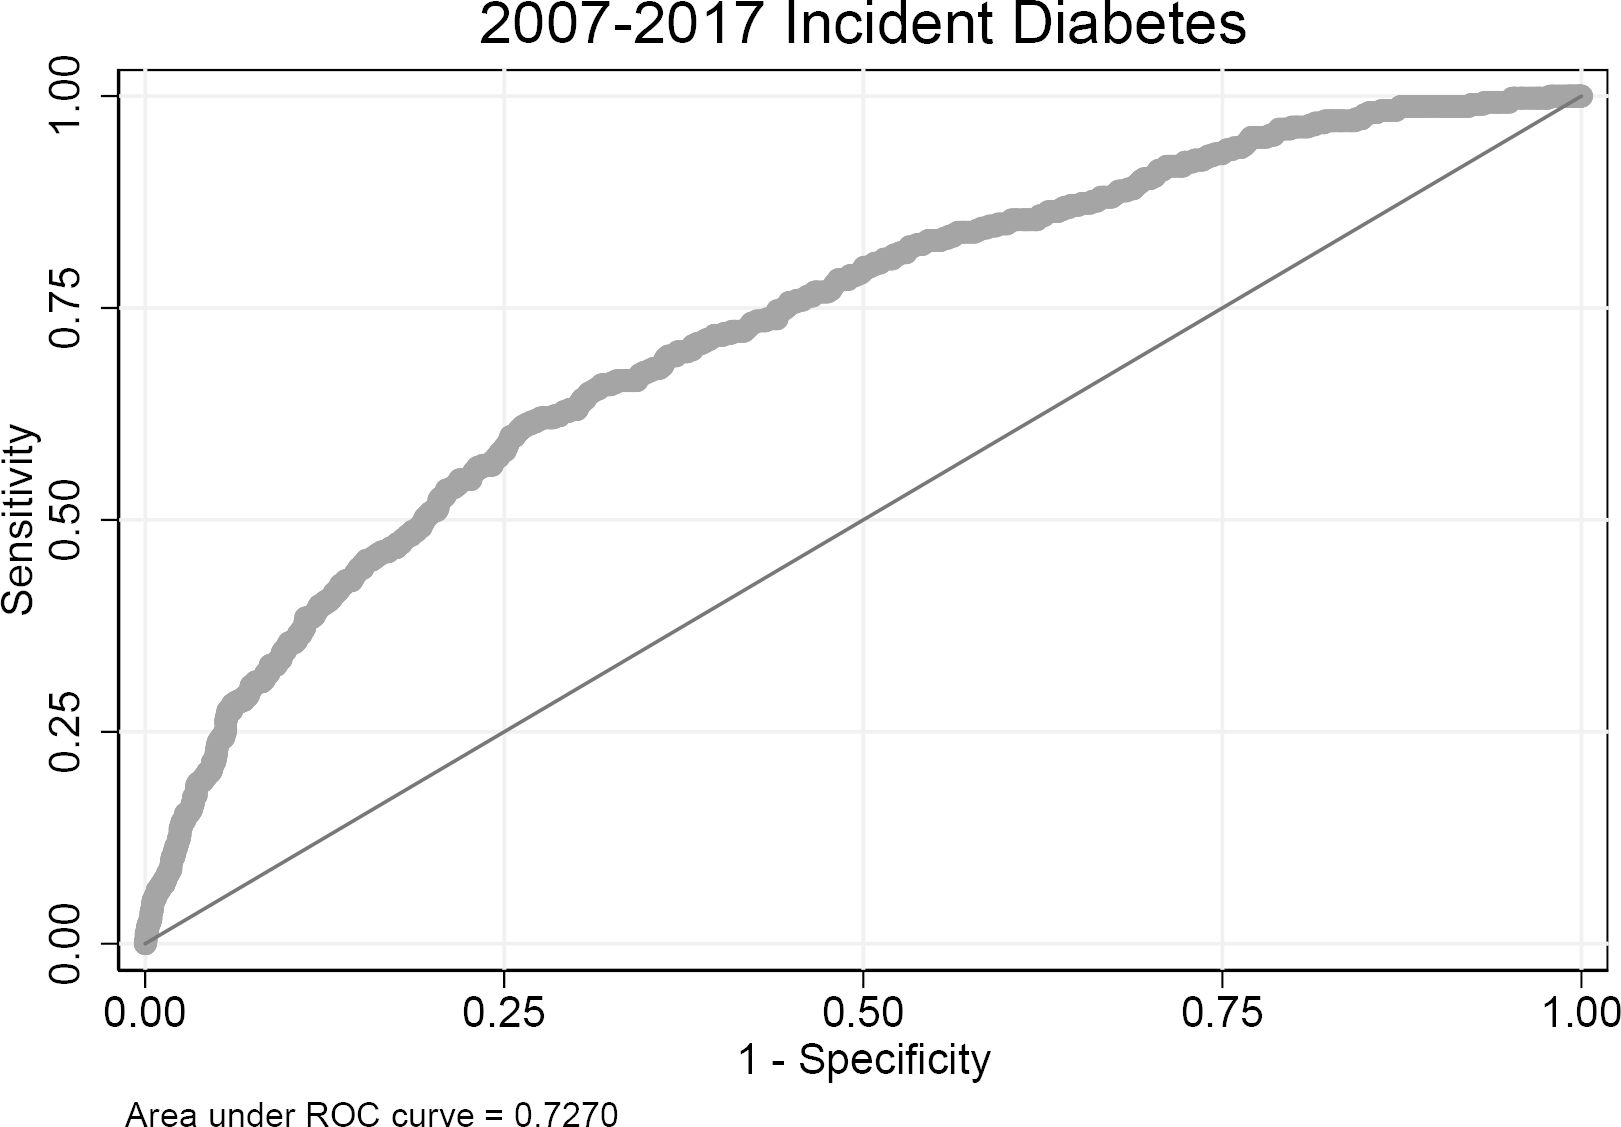

Receiver Operating Characteristic for Incident Diabetes - Males

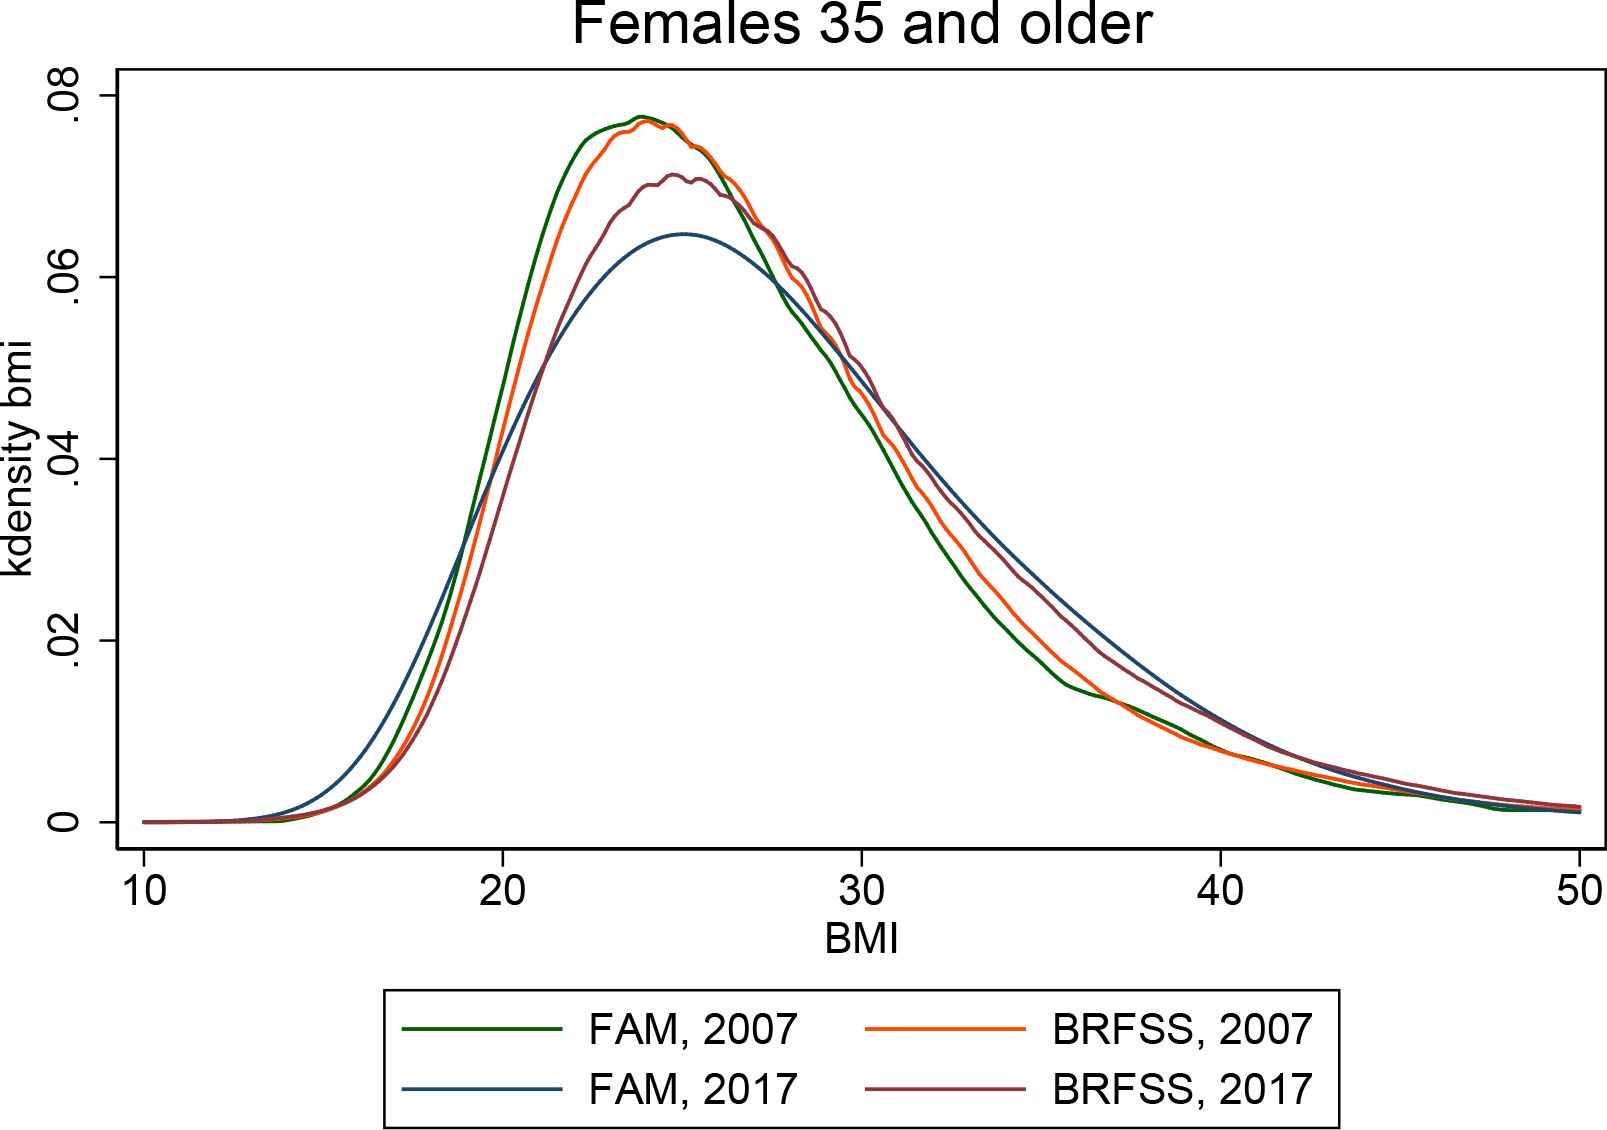
BMI distribution for those 35 and older - Females

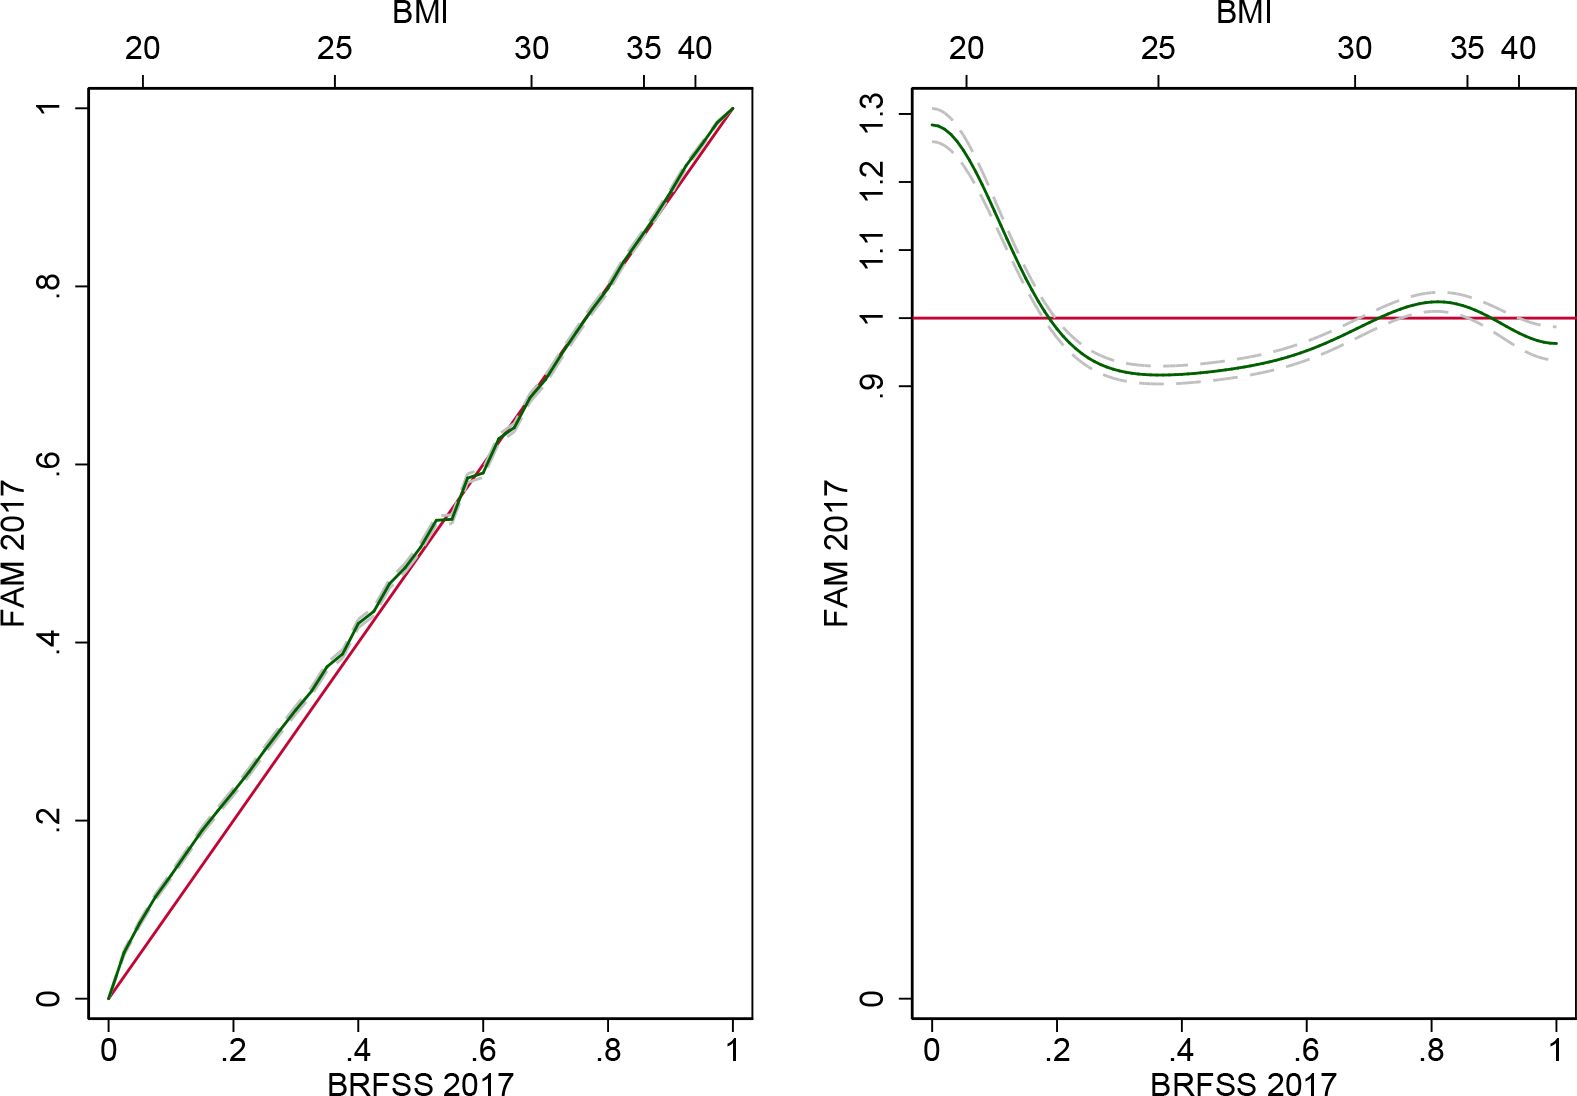
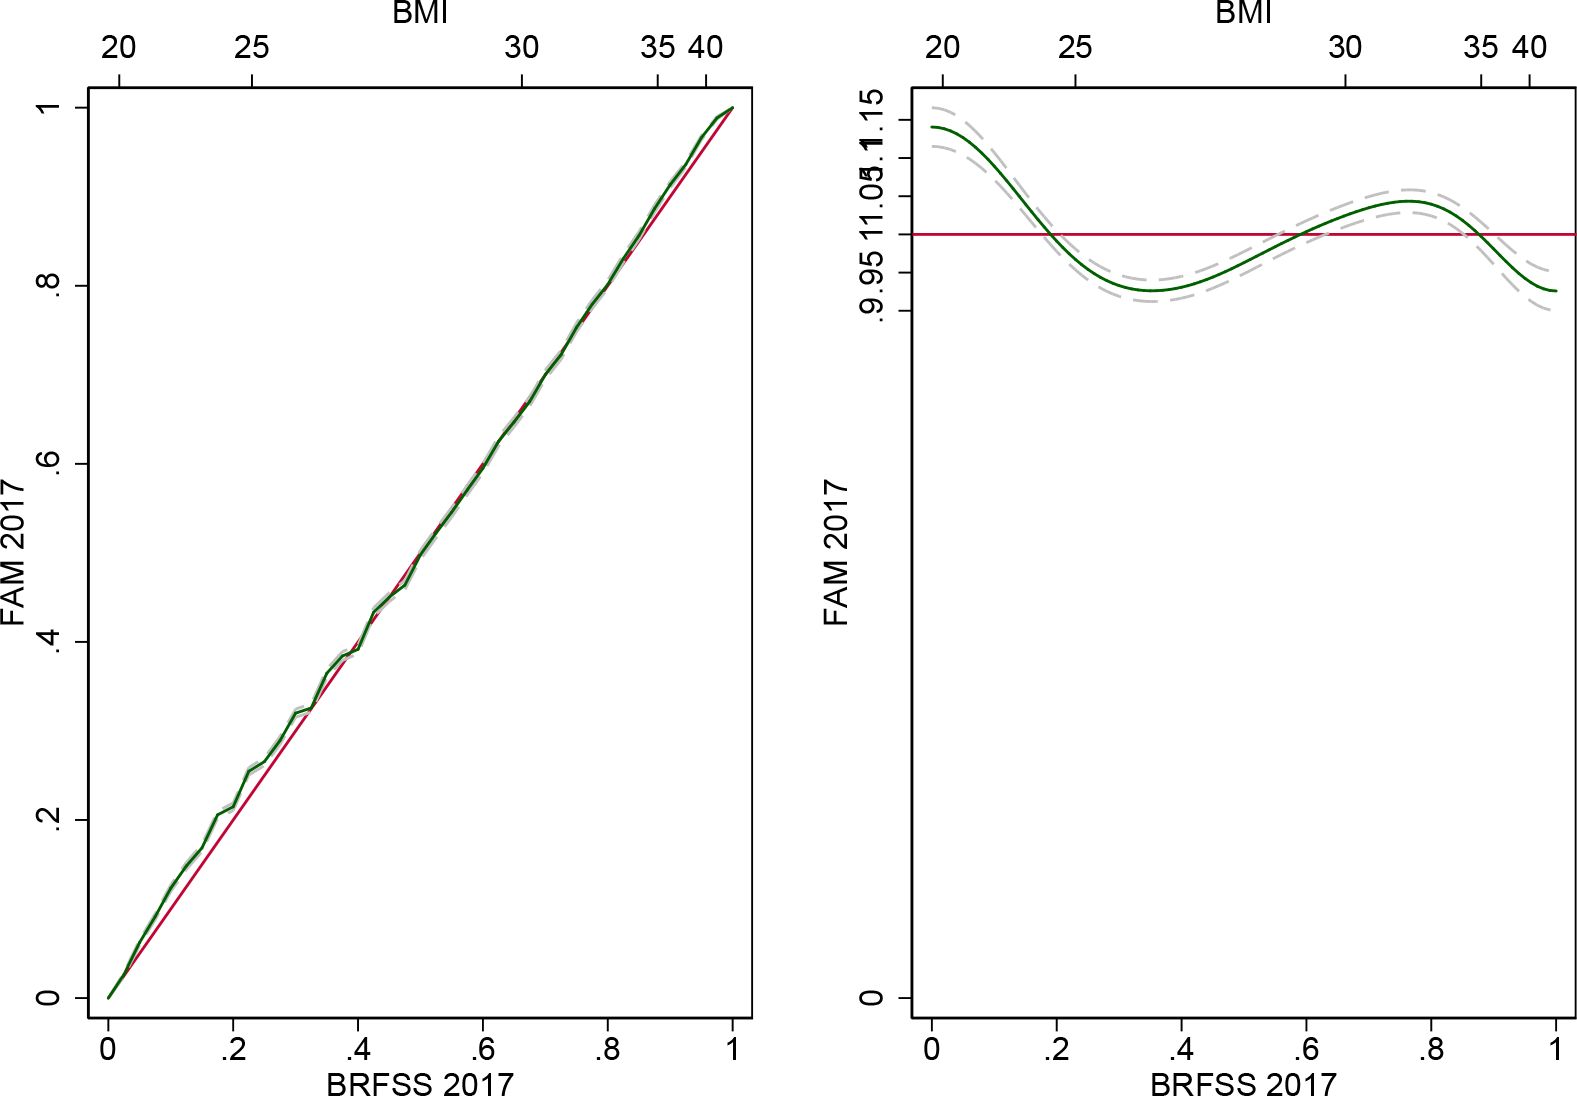
Relative cumulative distribution and density of BMI - Females

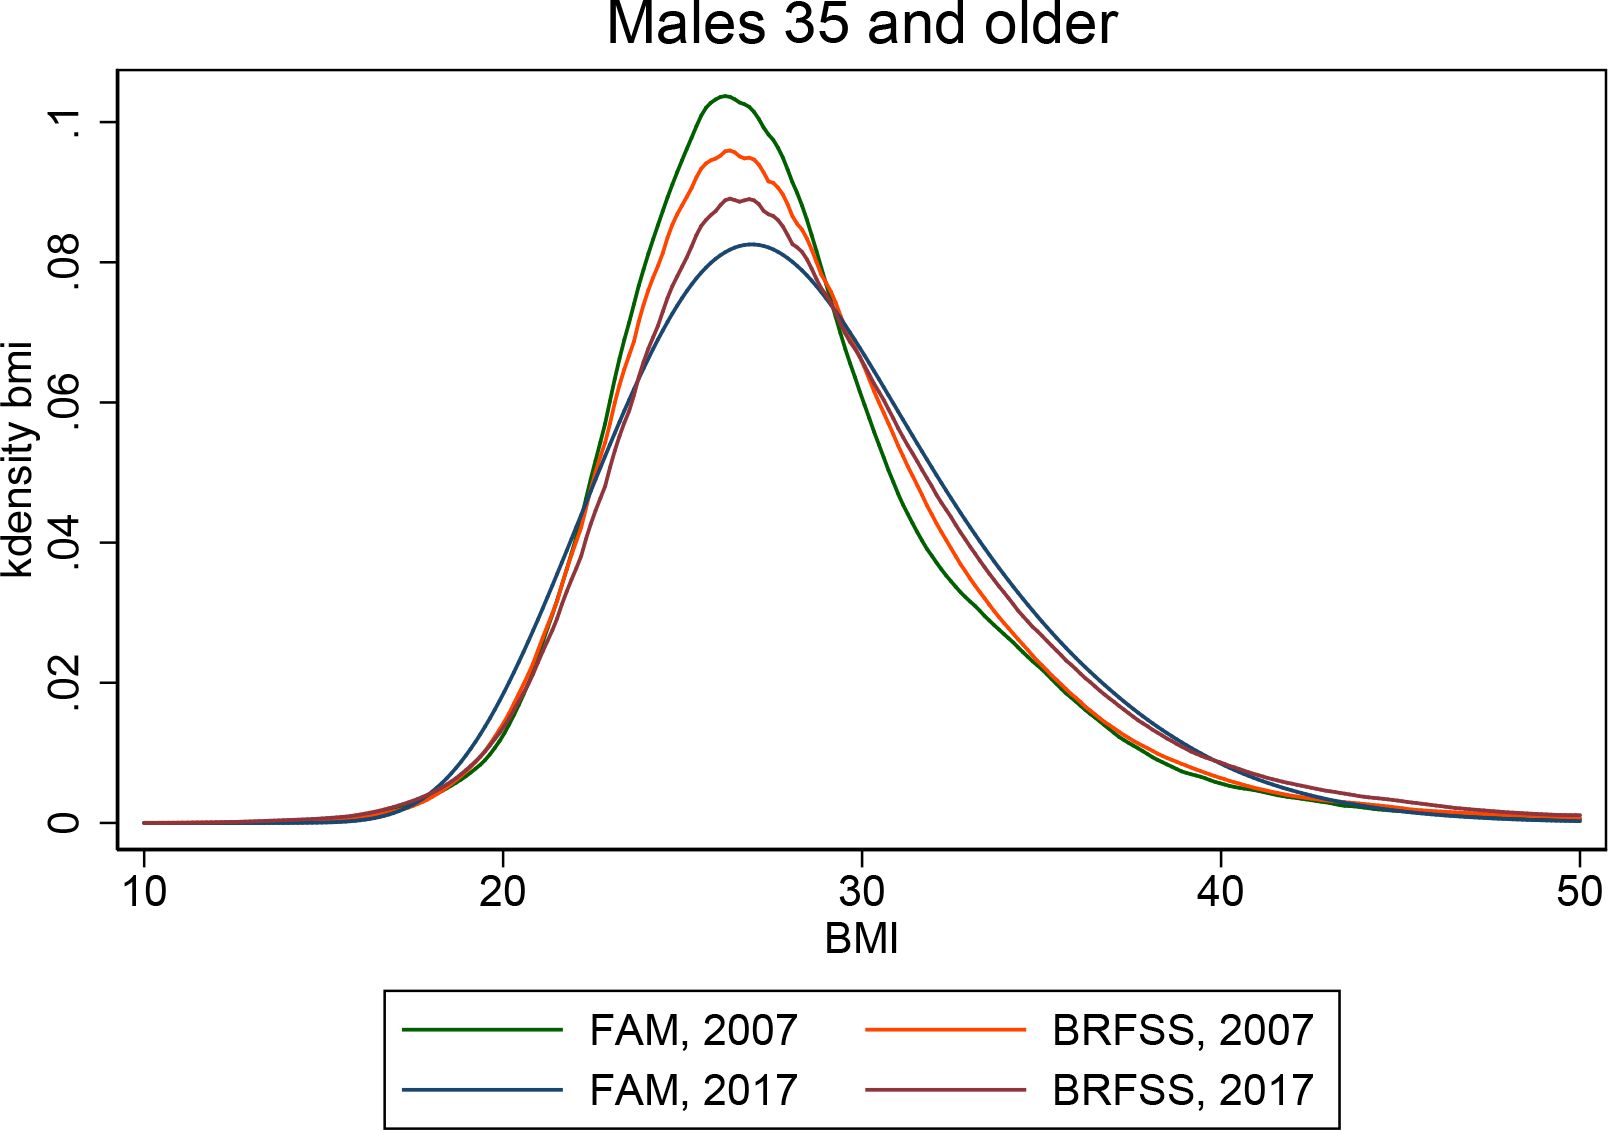
BMI distribution for those 35 and older - Males
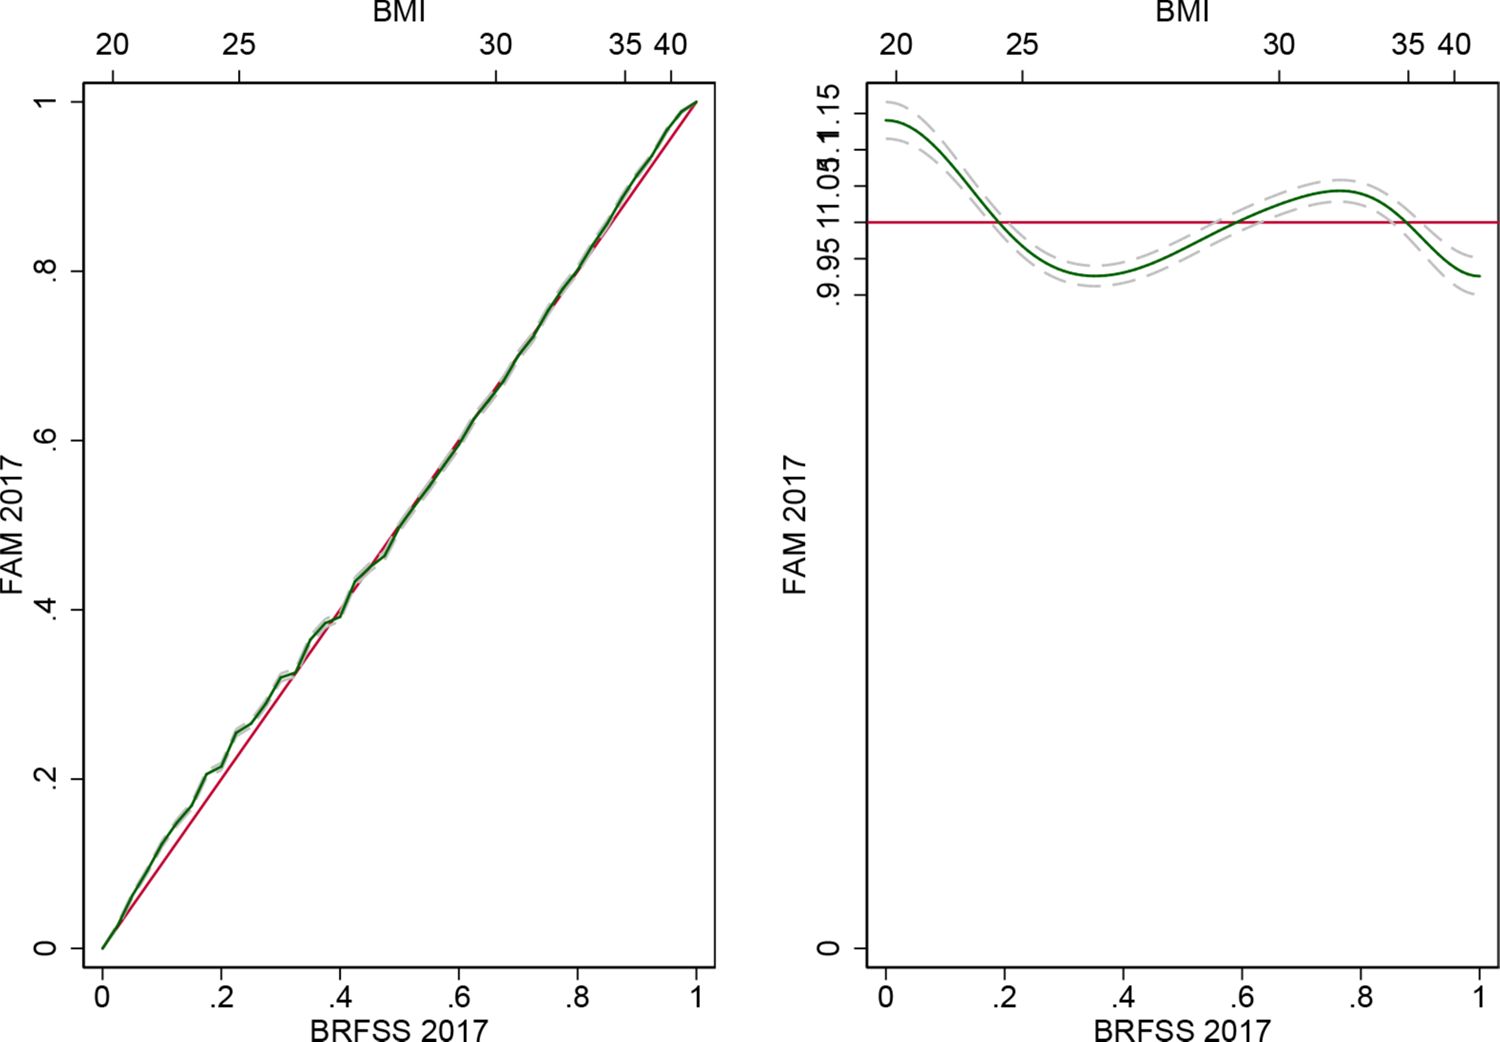
Relative cumulative distribution and density of BMI - Males
Tables
Variables directly impacted by BMI and diabetes in FAM.
| Domain | Category | Measure |
|---|---|---|
| Health | Chronic conditions | Cancer1, diabetes1, heart disease, hypertension, lung disease1, stroke |
| Functional limitations | Activities of daily living, instrumental activities of daily living | |
| Mental distress | Kessler 6 | |
| Mortality | Death2 | |
| Risk factors | BMI1, start smoking, stop smoking | |
| Economic | Employment status | Full-/part-time, labor force participation |
| Health insurance | Health insurance type2 | |
| Income and assets | Capital income2, earnings2, wealth | |
| Public program participation | OASI2, DI2 | |
| Medical cost and use | Individual | Drug $2, out of pocket $2 |
| Medicaid | $2 | |
| Medicare | Total $2, Part A $2, Part B $2 | |
| Total expenditures | $2 | |
| Utilization | Doctors visits2, hospital encounters2, hospital nights2 | |
| Subjective well-being | Life satisfaction2, quality-adjusted life years2, self-reported health2 |
-
1 BMI model only
-
2 Diabetes model only
Two-year BMI transition estimates used in FAM, 1999-2007 PSID.
| (1)Log(BMI)-Females | (2)Log(BMI)-Males | |
|---|---|---|
| Non-Hispanic Black | 0.00838*** | 0.00168 |
| Hispanic | 0.00403 | 0.000181 |
| Less than HS | 0.00421 | -0.000211 |
| Bachelors | -0.00887*** | -0.00585*** |
| Masters or higher | -0.00741* | -0.00460 |
| Non-Hispanic Black Less than HS | -0.00920* | -0.00877* |
| Non-Hispanic Black Bachelors | 0.0114* | 0.00670 |
| Non-Hispanic Black Masters or higher | -0.00390 | 0.0210 |
| Hispanic Less than HS | -0.00298 | -0.00431 |
| Hispanic Bachelors | 0.00193 | -0.000211 |
| Hispanic Masters or higher | -0.00810 | -0.00361 |
| Poor child SES | 0.00103 | 0.00121 |
| Well-off child SES | -0.00154 | -0.00146 |
| Fair child health | 0.00489 | -0.000600 |
| Good child health | 0.000692 | 0.000749 |
| Very good child health | 0.00254 | -0.000955 |
| Excellent child health | 0.000864 | -0.00229 |
| Age spline, less than 35 | -0.000382 | -0.0000346 |
| Age spline, 35 to 44 | -0.000155 | -0.000609* |
| Age spline, 45 to 54 | 0.0000296 | -0.000446 |
| Age spline, 55 to 64 | -0.000515 | 0.000165 |
| Age spline, 65 to 74 | -0.00130** | -0.00147*** |
| Age spline, more than 75 | -0.00202*** | -0.00117* |
| Lag of Log(BMI) spline, BMI less than 20 | 0.769*** | 0.327*** |
| Lag of Log(BMI) spline, BMI 20 to 25 | 0.945*** | 0.929*** |
| Lag of Log(BMI) spline, BMI 25 to 30 | 0.898*** | 0.905*** |
| Lag of Log(BMI) spline, BMI 30 to 35 | 0.987*** | 0.945*** |
| Lag of Log(BMI) spline, BMI 35 to 40 | 0.805*** | 0.872*** |
| Lag of Log(BMI) spline, BMI over 40 | 0.895*** | 0.830*** |
| Cohabiting | -0.00124 | 0.00256 |
| Married | -0.00480** | 0.000316 |
| Constant | 0.738*** | 2.057*** |
| Observations | 20942 | 16454 |
| R2 | 0.836 | 0.810 |
-
***
p < 0:05, *p < 0:01, **p < 0:001
Two-year diabetes incidence estimates used in FAM, 1999-2007 PSID.
| (1)Diabetes incidence (marginal effects) | |
|---|---|
| Non-Hispanic Black | 0.00167 |
| Hispanic | 0.00505 |
| Less than HS | 0.00331 |
| Bachelors | -0.000224 |
| Masters or higher | -0.00235 |
| Male | 0.00268* |
| Poor child SES | 0.00322* |
| Well-off child SES | 0.00150 |
| Fair child health | -0.000465 |
| Good child health | -0.00240 |
| Very good child health | 0.00184 |
| Excellent child health | 0.00175 |
| Age spline, less than 35 | 0.0000936 |
| Age spline, 35 to 44 | 0.00117*** |
| Age spline, 45 to 54 | 0.000778** |
| Age spline, 55 to 64 | 0.000295 |
| Age spline, 65 to 74 | 0.000269 |
| Age spline, more than 75 | -0.000564 |
| Lag of former smoker | 0.00141 |
| Lag of current smoker | 0.00550** |
| Lag of any exercise | -0.00394* |
| Lag of Log(BMI) spline, BMI less than 25 | 0.0485** |
| Lag of Log(BMI) spline, BMI 25 to 30 | 0.0733*** |
| Lag of Log(BMI) spline, BMI 30 to 35 | 0.0382* |
| Lag of Log(BMI) spline, BMI 35 to 40 | 0.0666** |
| Lag of Log(BMI) spline, BMI over 40 | -0.0235 |
| Observations | 35264 |
| Pseudo R2 | 0.117 |
-
***
p < 0:05, *p < 0:01, **p < 0:001
Out-of-sample validation - 2017 FAM vs. 2017 PSID.
| Females | Males | |||
|---|---|---|---|---|
| FAM (2017) | PSID (2017) | FAM (2017) | PSID (2017) | |
| BMI | ||||
| 1st pctl | 16.6 [ 16.2, 16.9] | 17.2 [ 16.7, 17.8] | 19.2 [ 19.0, 19.5] | 19.0 [ 18.5, 19.5] |
| 5th pctl | 18.7 [ 18.5, 19.0] | 19.5 [ 19.2, 19.8] | 21.2 [ 21.0, 21.4] | 21.6 [ 21.3, 21.9] |
| 10th pctl | 20.1 [ 20.0, 20.3] | 20.5 [ 20.4, 20.7] | 22.5 [ 22.2, 22.7] | 22.8 [ 22.5, 23.0] |
| 25th pctl | 22.9 [ 22.8, 23.0] | 22.8 [ 22.5, 23.1] | 24.9 [ 24.7, 25.0] | 24.9 [ 24.7, 25.1] |
| Mean | 27.7 [ 27.6, 27.9] | 27.6 [ 27.4, 27.9] | 28.5 [ 28.3, 28.7] | 28.3 [ 28.1, 28.6] |
| 75th pctl | 31.5 [ 31.3, 31.8] | 30.9 [ 30.5, 31.3] | 31.5 [ 31.2, 31.8] | 30.9 [ 30.5, 31.3] |
| 90th pctl | 36.7 [ 36.3, 37.0] | 36.6 [ 35.9, 37.2] | 35.3 [ 34.8, 35.7] | 35.1 [ 34.6, 35.6] |
| 95th pctl | 40.0 [ 39.4, 40.5] | 40.8 [ 40.1, 41.4] | 37.7 [ 37.1, 38.2] | 37.8 [ 37.3, 38.4] |
| 99th pctl | 46.9 [ 45.5, 48.2] | 50.5 [ 48.1, 52.9] | 42.4 [ 41.3, 43.6] | 46.4 [ 44.6, 48.1] |
| Diabetes prevalence | 12.4 [ 11.5, 13.3] | 14.6 [ 13.2, 15.9] | 14.9 [ 13.6, 16.3] | 16.7 [ 15.2, 18.2] |
-
Notes: Confidence intervals for FAM reflect 50 sets of bootstrapped transition models, each simulated 100 times. Confidence intervals for PSID reflect the complex survey design.
Host and external data comparison - 2007 PSID vs. 2007 BRFSS.
| Females | Males | |||
|---|---|---|---|---|
| PSID (2007) | BRFSS (2007) | PSID (2007) | BRFSS (2007) | |
| BMI | ||||
| 1st pctl | 17.5 [ 17.2, 17.8] | 17.6 [ 17.5, 17.7] | 19.4 [ 18.8, 19.9] | 19.2 [ 19.0, 19.3] |
| 5th pctl | 19.1 [ 19.0, 19.3] | 19.5 [ 19.5, 19.6] | 21.7 [ 21.5, 21.9] | 21.5 [ 21.4, 21.6] |
| 10th pctl | 20.3 [ 20.1, 20.4] | 20.5 [ 20.5, 20.6] | 22.8 [ 22.6, 23.0] | 22.6 [ 22.6, 22.7] |
| 25th pctl | 22.3 [ 22.2, 22.5] | 22.7 [ 22.7, 22.7] | 24.7 [ 24.5, 24.9] | 24.6 [ 24.4, 24.7] |
| Mean | 26.9 [ 26.7, 27.1] | 27.2 [ 27.1, 27.2] | 27.9 [ 27.8, 28.1] | 28.1 [ 28.1, 28.2] |
| 75th pctl | 30.0 [ 29.7, 30.2] | 30.2 [ 30.1, 30.2] | 30.1 [ 29.9, 30.4] | 30.6 [ 30.5, 30.7] |
| 90th pctl | 35.3 [ 34.7, 35.8] | 35.5 [ 35.4, 35.6] | 34.2 [ 33.8, 34.5] | 34.5 [ 34.4, 34.6] |
| 95th pctl | 39.3 [ 38.6, 40.0] | 39.2 [ 39.1, 39.4] | 36.8 [ 36.3, 37.4] | 37.4 [ 37.2, 37.6] |
| 99th pctl | 48.4 [ 46.2, 50.6] | 47.9 [ 47.5, 48.4] | 43.8 [ 42.2, 45.3] | 45.0 [ 44.6, 45.5] |
| Diabetes prevalence | 7.3 [ 6.5, 8.2] | 9.2 [ 9.0, 9.4] | 8.7 [ 7.8, 9.7] | 9.9 [ 9.7, 10.2] |
-
Notes: Confidence intervals for PSID and BRFSS reflect the complex survey design.
External validation - 2017 FAM vs. 2017 BRFSS.
| Females | Males | |||
|---|---|---|---|---|
| FAM (2017) | BRFSS (2017) | FAM (2017) | BRFSS (2017) | |
| BMI | ||||
| 1st pctl | 16.6 [ 16.2, 16.9] | 17.7 [ 17.6, 17.8] | 19.2 [ 19.0, 19.5] | 18.8 [ 18.7, 19.0] |
| 5th pctl | 18.7 [ 18.5, 19.0] | 19.8 [ 19.7, 19.9] | 21.2 [ 21.0, 21.4] | 21.6 [ 21.5, 21.7] |
| 10th pctl | 20.1 [ 20.0, 20.3] | 21.0 [ 20.9, 21.0] | 22.5 [ 22.2, 22.7] | 23.0 [ 22.9, 23.0] |
| 25th pctl | 22.9 [ 22.8, 23.0] | 23.4 [ 23.4, 23.5] | 24.9 [ 24.7, 25.0] | 25.1 [ 25.1, 25.1] |
| Mean | 27.7 [ 27.6, 27.9] | 28.2 [ 28.1, 28.3] | 28.5 [ 28.3, 28.7] | 28.8 [ 28.7, 28.9] |
| 75th pctl | 31.5 [ 31.3, 31.8] | 31.6 [ 31.5, 31.8] | 31.5 [ 31.2, 31.8] | 31.6 [ 31.5, 31.7] |
| 90th pctl | 36.7 [ 36.3, 37.0] | 36.9 [ 36.7, 37.1] | 35.3 [ 34.8, 35.7] | 35.9 [ 35.7, 36.0] |
| 95th pctl | 40.0 [ 39.4, 40.5] | 40.7 [ 40.5, 41.0] | 37.7 [ 37.1, 38.2] | 39.0 [ 38.8, 39.3] |
| 99th pctl | 46.9 [ 45.5, 48.2] | 49.9 [ 49.3, 50.5] | 42.4 [ 41.3, 43.6] | 46.8 [ 46.2, 47.4] |
| Diabetes prevalence | 12.4 [ 11.5, 13.3] | 14.0 [ 13.7, 14.4] | 14.9 [ 13.6, 16.3] | 15.7 [ 15.3, 16.1] |
-
Notes: Confidence intervals for FAM reflect 50 sets of bootstrapped transition models, each simulated 100 times. Confidence intervals for BRFSS reflect the complex survey design.
Data and code availability
The data used in FAM are available for scientific research upon registration.
1. Panel Study of Income Dynamics is available at https://psidonline.isr.umich.edu/
2. Behavioral Risk Factor Surveillance System is available at https://www.cdc.gov/brfss/index.html
3. Health and Retirement Study is available at http://hrsonline.isr.umich.edu/
4. Medical Expenditure Panel Survey is available at https://meps.ahrq.gov/mepsweb/
5. Medicare Current Beneficiary Survey is available at https://www.cms.gov/Research-Statistics-Data-and-Systems/Research/MCBS
6. National Health Interview Survey is available at https://www.cdc.gov/nchs/nhis/index.htm
7. National Health and Nutrition Examination Survey is available at https://www.cdc.gov/nchs/nhanes/index.htm
8. AmericanCommunitySurvey is available at https://www.census.gov/programs-surveys/acs
9. CensusPopulation Projections is available at https://www.census.gov/programs-surveys/popproj.html
The source code for FAM is available via a publicly accessible Subversion code repository at https://schweb.lahrc.lahealthresearchcloud.org/svn/PublicFutureElderlyModel/trunk. It is suggested that users contact Bryan Tysinger for guidance in getting started.