Modelling the Economic Impact of Next Generation Sequencing and Precision Medicine on Childhood Cancer Management—a Microsimulation Approach
- GeIMPACT: Centre for Economic Impacts of Genomic Medicine, Macquarie Business School, Australia
- School of Women’s and Children’s Health, Australia
- Kids Cancer Centre, Australia
- Children’s Cancer Institute, Australia
Figures

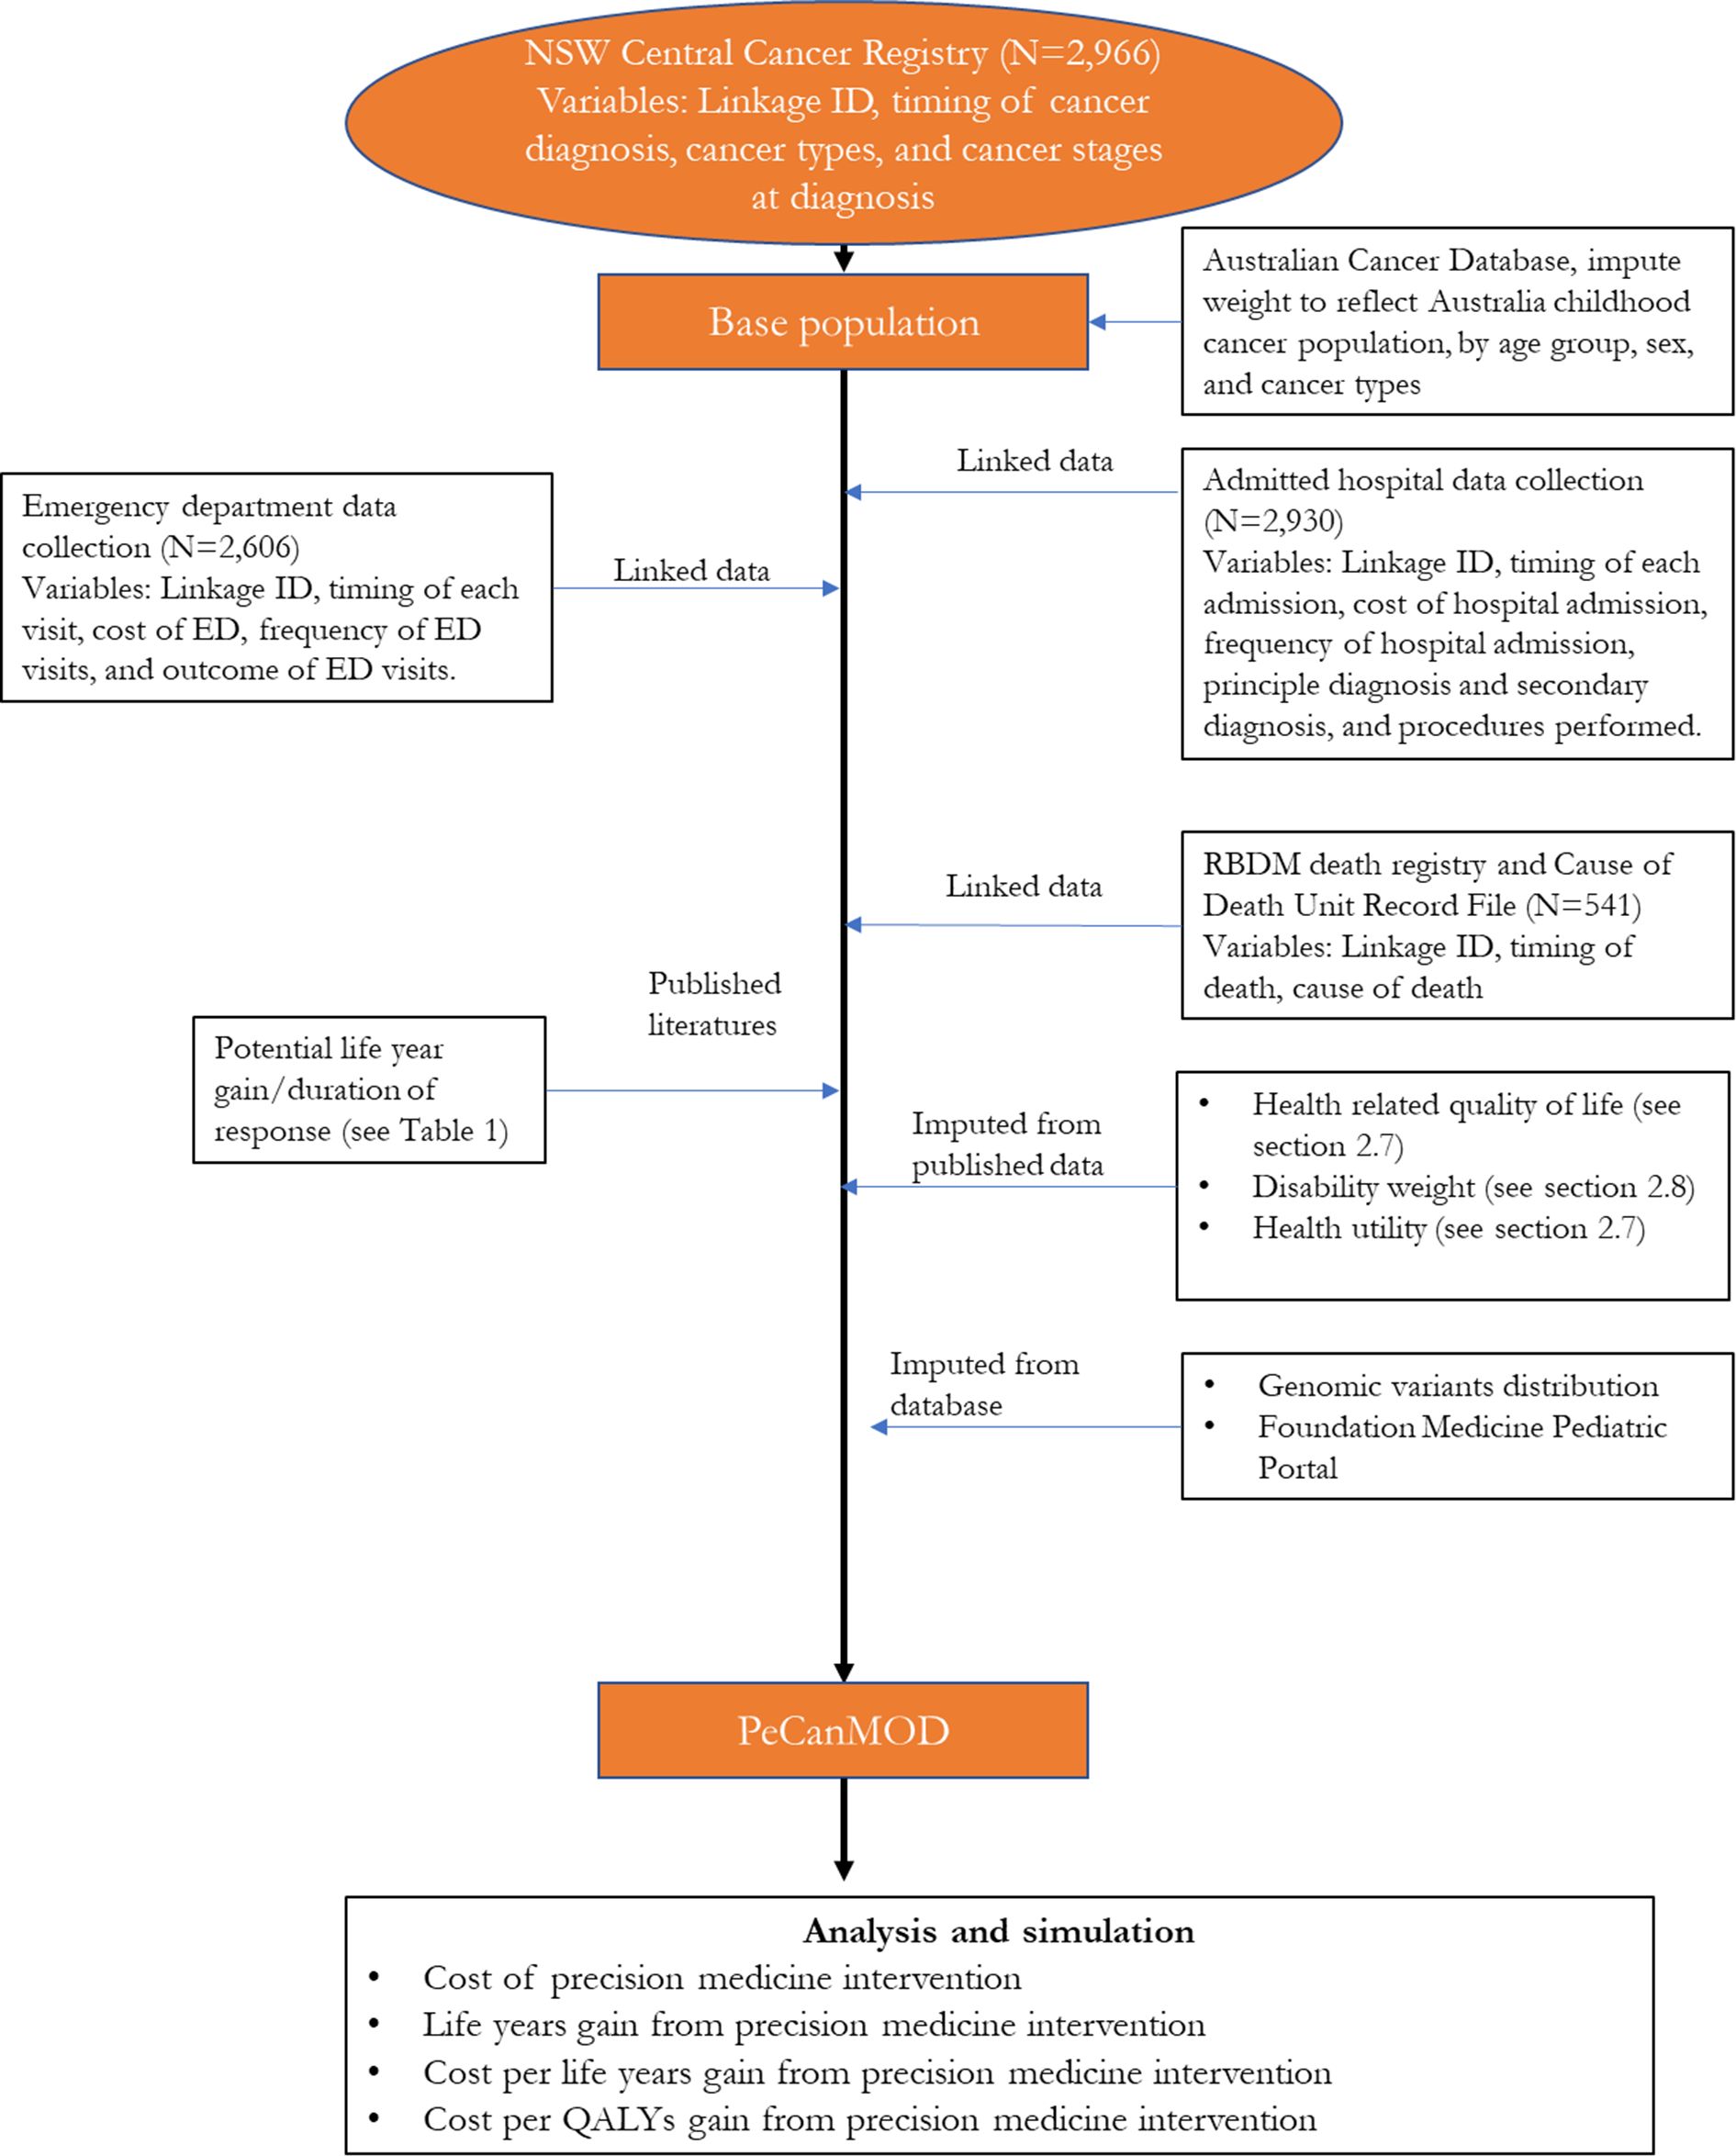
Structure of PeCanMOD

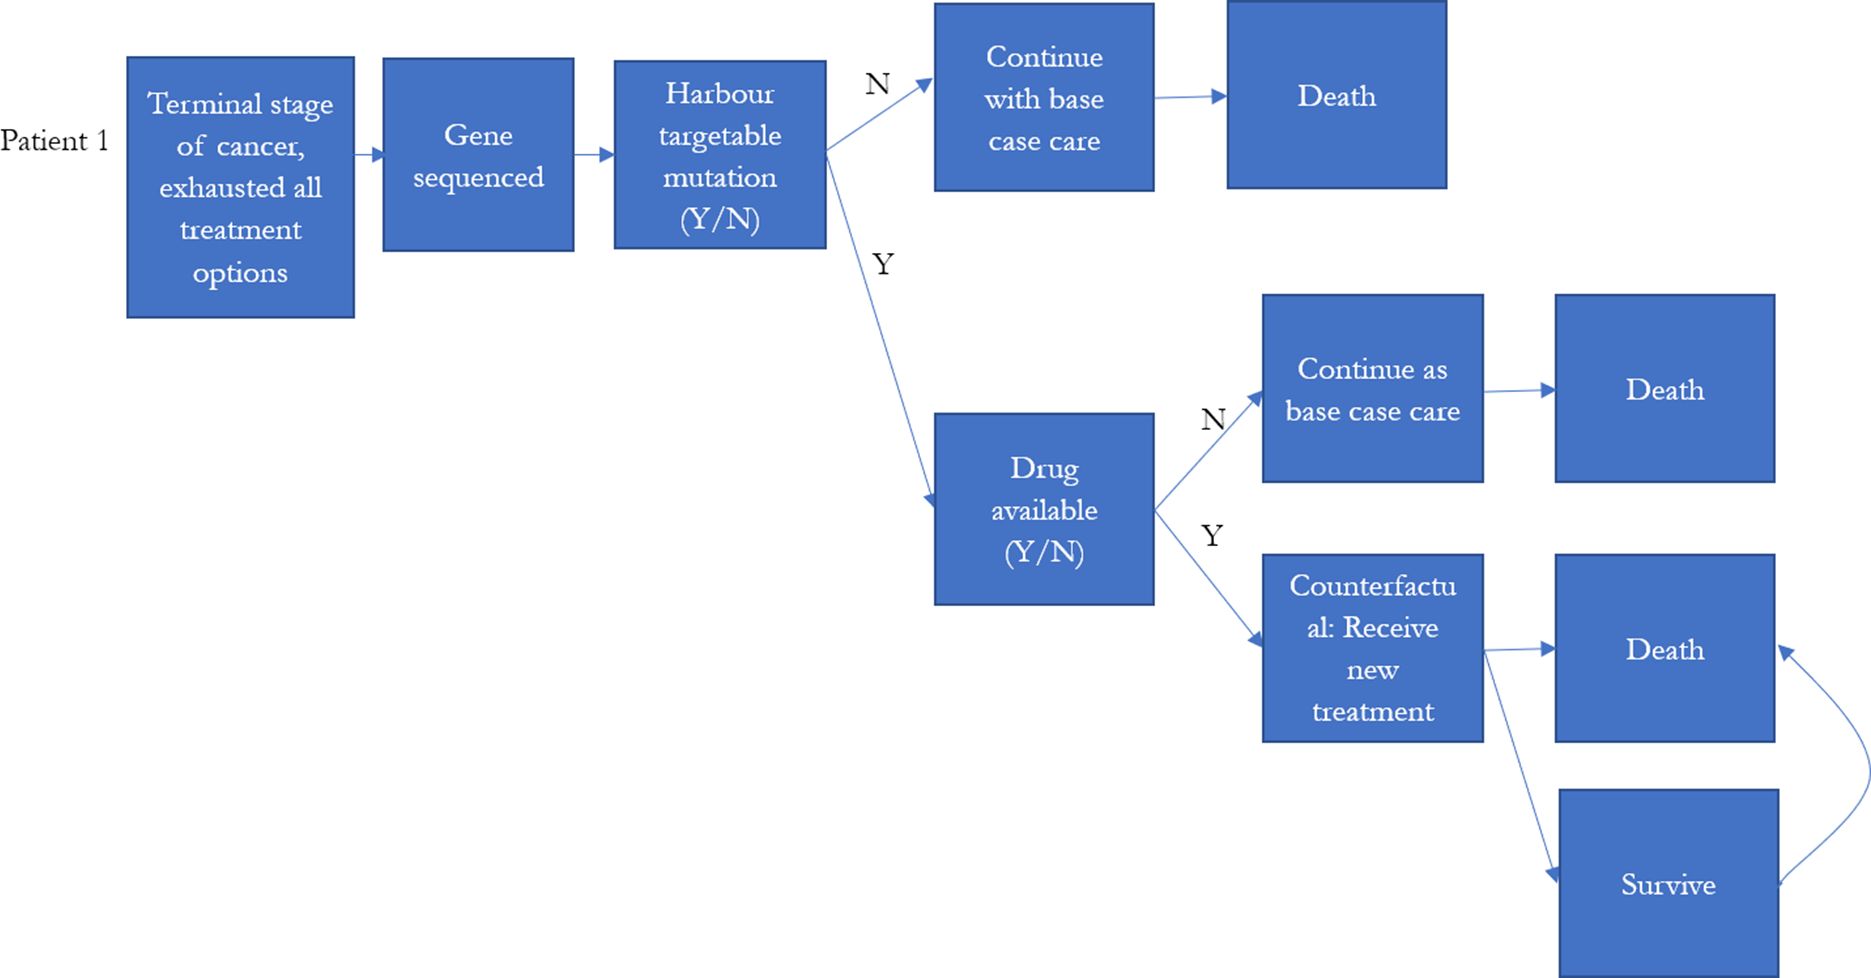
Model schematic of decision tree for testing and initial treatment.

Heat map shows frequency of mutations (normalised and represented as Z-scores) in each gene in (A) reference population, i.e. Foundation Medicine dataset, and (B) NSW Central Cancer Registry population simulation output.
Note: Each column along the horizontal axis represents a gene responsible for cancers. Distribution of genomic variants were significantly correlated between the reference population and NSW Central Cancer Registry simulation output (ρ=0.73, p<0.01) (details list of genes is described in Appendix 1).
Tables
Characteristics of childhood cancer population in NSW Central Cancer Registry and selected individuals used in the model.
| Total childhood cancer population from NSW Central Cancer Registry (2001-2012) | Selected individuals for simulation model ‡ | ||||
|---|---|---|---|---|---|
| N | % | N | % | ||
| Sex | Sex | ||||
| Male | 1639 | 55.26 | Male | 303 | 56.01 |
| Female | 1327 | 44.74 | Female | 238 | 43.99 |
| Age at diagnosis | Age at diagnosis | ||||
| 0-4 | 1117 | 37.66 | 0-4 | 193 | 35.67 |
| 5-9 | 528 | 17.8 | 5-9 | 99 | 18.3 |
| 10-14 | 632 | 21.31 | 10-14 | 119 | 22 |
| 15-17 | 689 | 23.23 | 15-17 | 130 | 24.03 |
| Cancer types | Cancer types | ||||
| -Acute lymphoblastic leukaemia | 712 | 23.78 | Brain | 159 | 29.39 |
| -Brain | 342 | 11.42 | Acute lymphoblastic leukaemia | 92 | 17.01 |
| -Hodgkin’s disease | 210 | 7.01 | Bone | 54 | 9.98 |
| -Non-Hodgkin’s lymphoma | 186 | 6.21 | Acute myeloid leukaemia | 42 | 7.76 |
| -Bone | 177 | 5.91 | Connective tissue, peripheral nerves | 38 | 7.02 |
| -Acute myeloid leukaemia | 168 | 5.61 | Other endocrine glands | 33 | 6.1 |
| -Connective tissue, peripheral nerves | 148 | 4.94 | Non-Hodgkin’s Lymphoma | 22 | 4.07 |
| -Kidney | 134 | 4.48 | All other cancer types† | 101 | 18.6 |
| -Other endocrine glands | 113 | 3.77 | |||
| -Melanoma of skin | 106 | 3.54 | |||
| -Colon | 70 | 2.34 | |||
| -Thyroid | 68 | 2.27 | |||
| -Testis | 67 | 2.24 | |||
| -Central nervous system | 67 | 2.24 | |||
| -Ill-defined and unspecified site | 60 | 2 | |||
| -Eye | 59 | 1.97 | |||
| -Other lymphatic, hematopoietic | 49 | 1.64 | |||
| -Liver | 41 | 1.37 | |||
| -Ovary | 41 | 1.37 | |||
| -Other myeloid leukaemia | 27 | 0.9 | |||
| -Other thoracic organs | 20 | 0.67 | |||
| -All other cancer types† | 129 | 4.31 | |||
| Year of diagnosis | Year of diagnosis | ||||
| 2001* | 144 | 4.86 | 2001* | 34 | 6.28 |
| 2002 | 261 | 8.80 | 2002 | 60 | 11.09 |
| 2003 | 249 | 8.40 | 2003 | 58 | 10.72 |
| 2004 | 259 | 8.73 | 2004 | 45 | 8.32 |
| 2005 | 241 | 8.13 | 2005 | 52 | 9.61 |
| 2006 | 261 | 8.80 | 2006 | 41 | 7.58 |
| 2007 | 229 | 7.72 | 2007 | 45 | 8.32 |
| 2008 | 226 | 7.62 | 2008 | 40 | 7.39 |
| 2009 | 256 | 8.63 | 2009 | 46 | 8.5 |
| 2010 | 270 | 9.10 | 2010 | 40 | 7.39 |
| 2011 | 277 | 9.34 | 2011 | 32 | 5.91 |
| 2012 | 293 | 9.88 | 2012 | 48 | 8.87 |
-
*
2001 data started from 1st of July.
-
†
Including cancer types with equal or less than 20 records.
-
‡
Selected individuals were those who were eventually deceased due to their illness.
Comparison of reference datasets for genomic variants distribution imputation.
| Datasets | % of base file matched with reference dataset (by cancer types) |
|---|---|
| Foundation Medicine Pediatric Portal | 73 |
| Grobner et al. | 57 |
| Rusch et al. | 24 |
| Ma et al. | 10 |
Genomic variants eligible for precision medicine and the corresponding drugs.
| Drugs | Genomic variants eligible for precision medicine |
|---|---|
| Larotrectinib | NTRK1,NTRK2,NTRK3 |
| Erdafitinib | FGFR1,FGFR2,FGFR3,FGFR4 |
| Tazemetostat | EZH2 gain of function,EZH2,BRG1,INI1,SMARCA4 inactivation,SMARCB1 inactivation |
| Samotolisib | TSC1,TSC2 |
| Selumetinib Sulfate | BRAF,GNA11,GNAQ,HRAS,KRAS,NF1,NRAS |
| Ensartinib | ALK fusion protein, ALK gene mutation, ALK gene translocation,ROS1 fusion positive,ROS1 gene mutation,ROS1 gene translocation |
| Vemurafenib | BRAF v600x |
| Olaparib | Deleterious ATM, Deleterious BRCA1, Deleterious BRCA2, Deleterious RAD51C, Deleterious RAD51D |
| Palbociclib | RB1 |
| Ulixertinib | ARAF,BRAF,GNA11,GNAQ,HRAS,KRAS,MAP2K1,MAPK1,NF1,NRAS |
Model inputs-- response rate to drugs.
| Drugs | Mean response rate | Distribution § | Source/note |
|---|---|---|---|
| Larotrectinib | 0.73 | Binomial (55,0.73) | Food and Drug Administration, 2018 |
| Erdafitinib | 0.322 | Binomial (87,0.322) | Food and Drug Administration, 2019 |
| Tazemetostat* | 0.38 or 0.05 | Binomial(21,0.38) or Binomial(43,0.05) | Italiano et al., 2018 |
| Samotolisib | 0.34 | Binomial (47,0.34) | Bendell et al., 2018 |
| Selumetinib Sulfate | 0.17 | Binomial (36,0.17) | Jain et al., 2014 |
| Ensartinib | 0.69 | Binomial (13,0.69) | Horn et al., 2017 |
| Vemurafenib† | range (0.17-0.769) | Hyman et al., 2015 | |
| Olaparib | 0.53 | Binomial (92,0.53) | Golan et al., 2019 |
| Palbociclib‡ | 0.5 | Triangular (0.25, 0.5, 0.75) | n.a. |
| Ulixertinib | 0.14 | Binomial (101,0.14) | Sullivan et al., 2018 |
-
*
Depending on cancer types (for blood cancers, response rate was assumed to be 0.38, and 0.05 for solid cancers).
-
†
response rate varies by cancer types.
-
‡
There is no data available for Palbociclib, so we assumed 0.5 response rate with a triangular distribution of ±0.25.
-
§
Binomial (N,p), triangular (a, c, b).
Model inputs-- duration of response.
| Drugs | Mean duration of response | Weibull (shape, scale) | Source/note |
|---|---|---|---|
| Larotrectinib | 6 months | (2.45,10.45) | Food and Drug Administration, 2018 |
| Erdafitinib | 5.4 months | (1.86,6.58) | Food and Drug Administration, 2019 |
| Tazemetostat | 12.4 months | (1.8,19.7) | Italiano et al., 2018 |
| Samotolisib | 6 months | (1.55,7.6) | Bendell et al., 2018 |
| Selumetinib Sulfate | 2 months | (1.3,2.65) | Jain et al., 2014 |
| Ensartinib | 5.8 months | (1.57,7.3) | Horn et al., 2017 |
| Vemurafenib* | range (3-13 months) | (1.81,8.57) | Hyman et al., 2015 |
| Olaparib | 6 months | (1.95,21.73) | Golan et al., 2019 |
| Palbociclib | 9.5 months | (1.53,12.06) | McShane et al., 2018 |
| Ulixertinib | 6.6 months | (1.73,8.16) | Sullivan et al., 2018 |
-
*
Duration of response varies by cancer types.
Model inputs, including costs of medicine, drug admission at hospital, toxicity management, and sequencing.
| Drugs | Mean monthly cost (US$) | Mean monthly cost (AU$) | Source/note |
|---|---|---|---|
| Larotrectinib | 11,000 (range: 8,250-13,750) | 15,629 (range:11,722-19,536) | Herper, 2018 |
| Erdafitinib | 16,380 (range: 12,285-20,475) | 23,273 (range: 17,455-29,091) | Pagliarulo, 2019 |
| Tazemetostat | N/A | 11,658 (range: 8,744-14,573) | Average of drug prices of Larotrectinib, Erdafitinib, Vemurafenib, Olaparib, and Palbociclib |
| Samotolisib | N/A | 11,658 (range: 8,744-14,573) | Average of drug prices of Larotrectinib, Erdafitinib, Vemurafenib, Olaparib, and Palbociclib |
| Selumetinib Sulfate | N/A | 11,658 (range: 8,744-14,573) | Average of drug prices of Larotrectinib, Erdafitinib, Vemurafenib, Olaparib, and Palbociclib |
| Ensartinib | N/A | 11,658 (range: 8,744-14,573) | Average of drug prices of Larotrectinib, Erdafitinib, Vemurafenib, Olaparib, and Palbociclib |
| Vemurafenib | N/A | 8,189 (range: 6,142-10,236) | Pharmaceutical BenefitsScheme, 2019c |
| Olaparib | N/A | 6,961 (range: 5,221-8,701) | Pharmaceutical BenefitsScheme, 2019a |
| Palbociclib | N/A | 4,239 (range: 3,179-5,299) | Pharmaceutical BenefitsScheme, 2019b |
| Ulixertinib | N/A | 11,658 (range: 8,744-14,573) | Average of drug prices of Larotrectinib, Erdafitinib, Vemurafenib, Olaparib, and Palbociclib |
| Hospital care | Mean monthly cost per person (US$) | Mean monthly cost per person (AU$) | |
| Admission for drug treatment | N/A | 901 (range: 676-1,126) | AR-DRGs |
| Managing toxicity/adverse drug events | N/A | 5,230 (range: 3,923-6,538) | |
| Sequencing | Mean cost per service (USD) | Mean cost per service (AUD) | |
| Whole-genome sequencing | 3,347 (range: 2,032-30,805) | 4,926 (range: 2,991-45,333) | Gordon et al., 2020; Schwarze et al., 2020; Schwarze et al., 2018; Weymann et al., 2017 |
| Targeted multi-gene panel sequencing | 1,236 (range: 525-6916) | 1,433 (range: 773-10,178) | Gordon et al., 2020; Hamblin et al., 2017an van Amerongen et al., 2016; Yu et al., 2018 |
Data and code availability
The data underlying the model are confidential. However, the authors are happy to discuss the methods used in model development. The code is not available due to the confidential nature of the data underlying the study. However, the authors are happy to discuss the approach taken to model development.