Analysis of the Distributional Effects of COVID-19 and State-led Remedial Measures in South Africa
- Southern African Social Policy Research Insights, United Kingdom
- Southern Africa Labour and Development Research Unit, South Africa
- University of Helsinki, Finland
- South African Revenue Service, South Africa
- Department of Social Development, South Africa
- College of Graduate Studies, South Africa
Figures

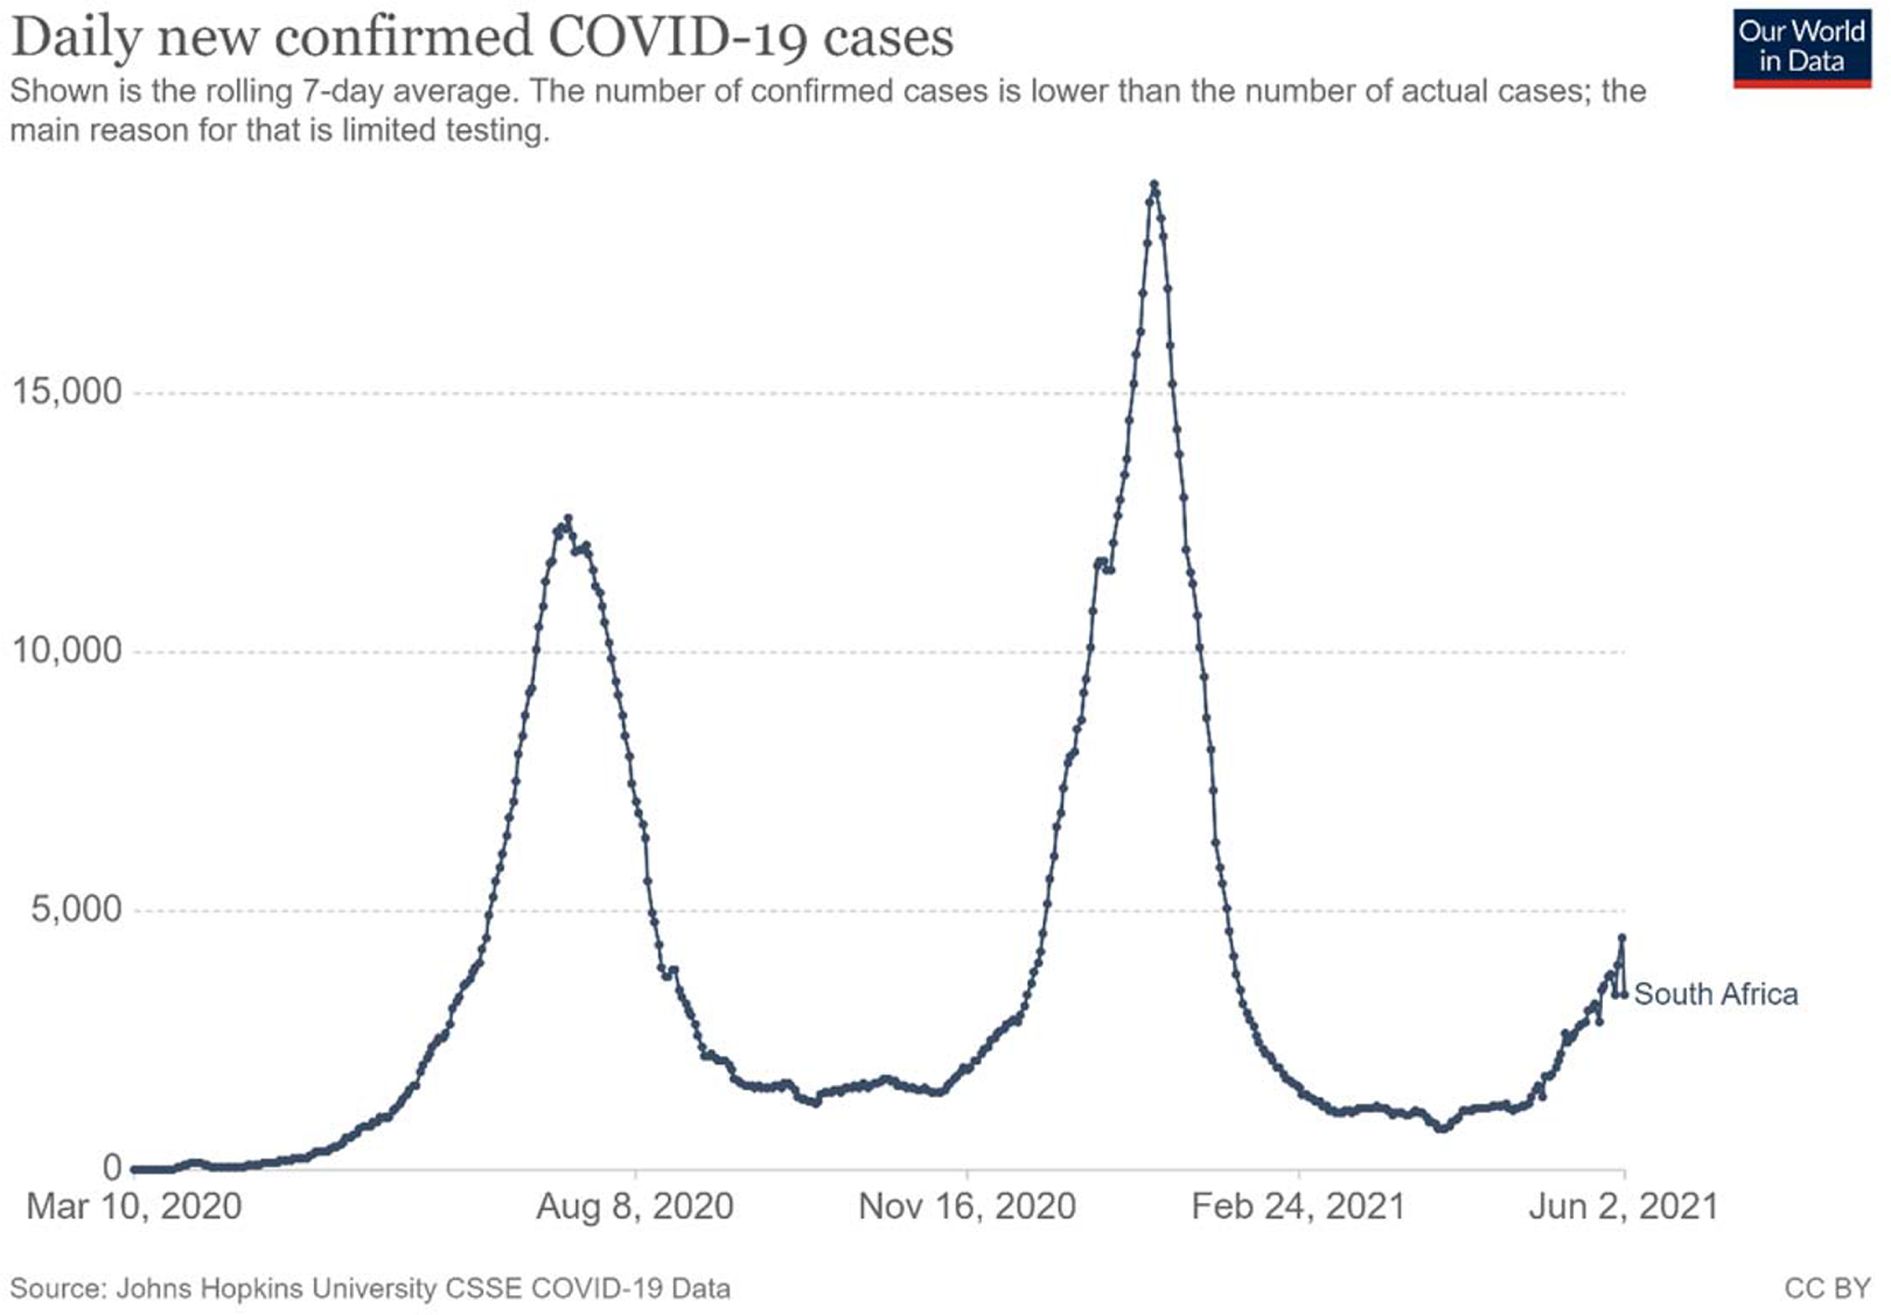
COVID-19 cases in South Africa, 5 March 2020 – 2 June 2021. Source: Our World in Data.

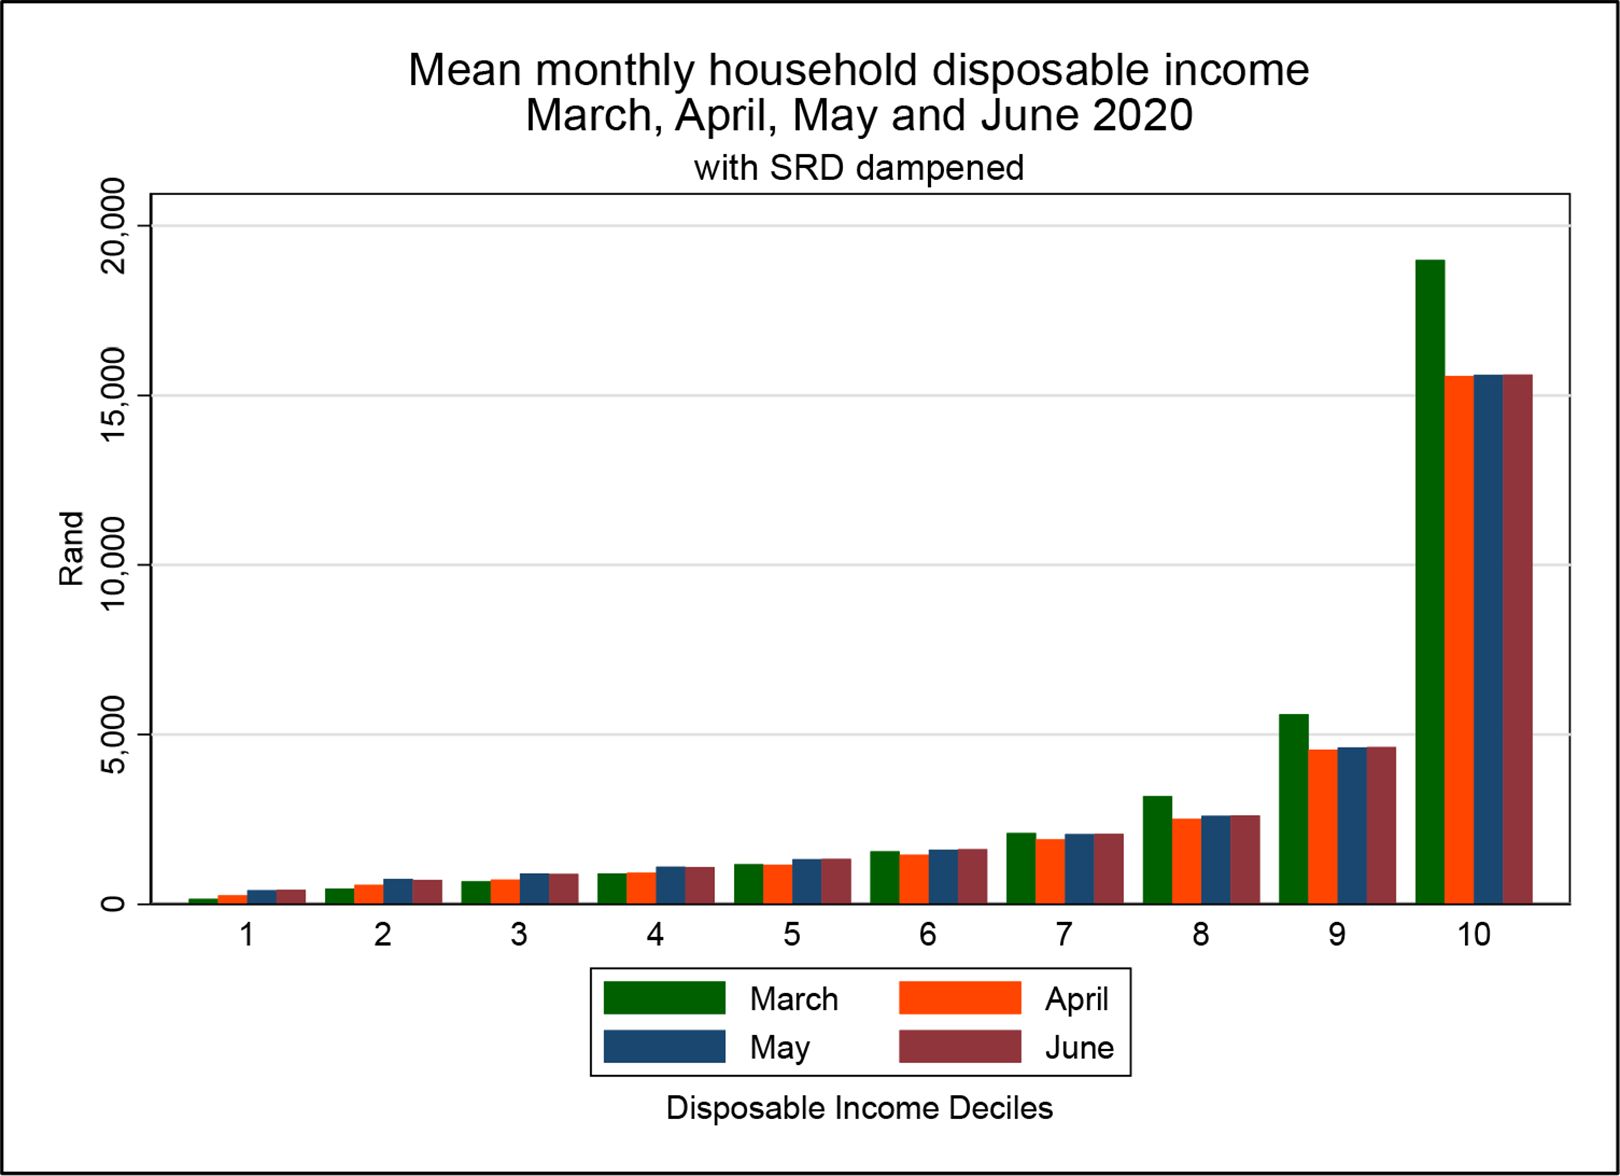
Mean monthly household disposable income by decile in March, April, May, and June 2020 (includes pre-COVID-19 and COVID-19 policies). Note: Simulated receipt of COVID-SRD benefit was dampened to match actual receipt (applicable to May and June only). Source: Authors’ analysis of output datasets from SAMOD V7.3-COVID.

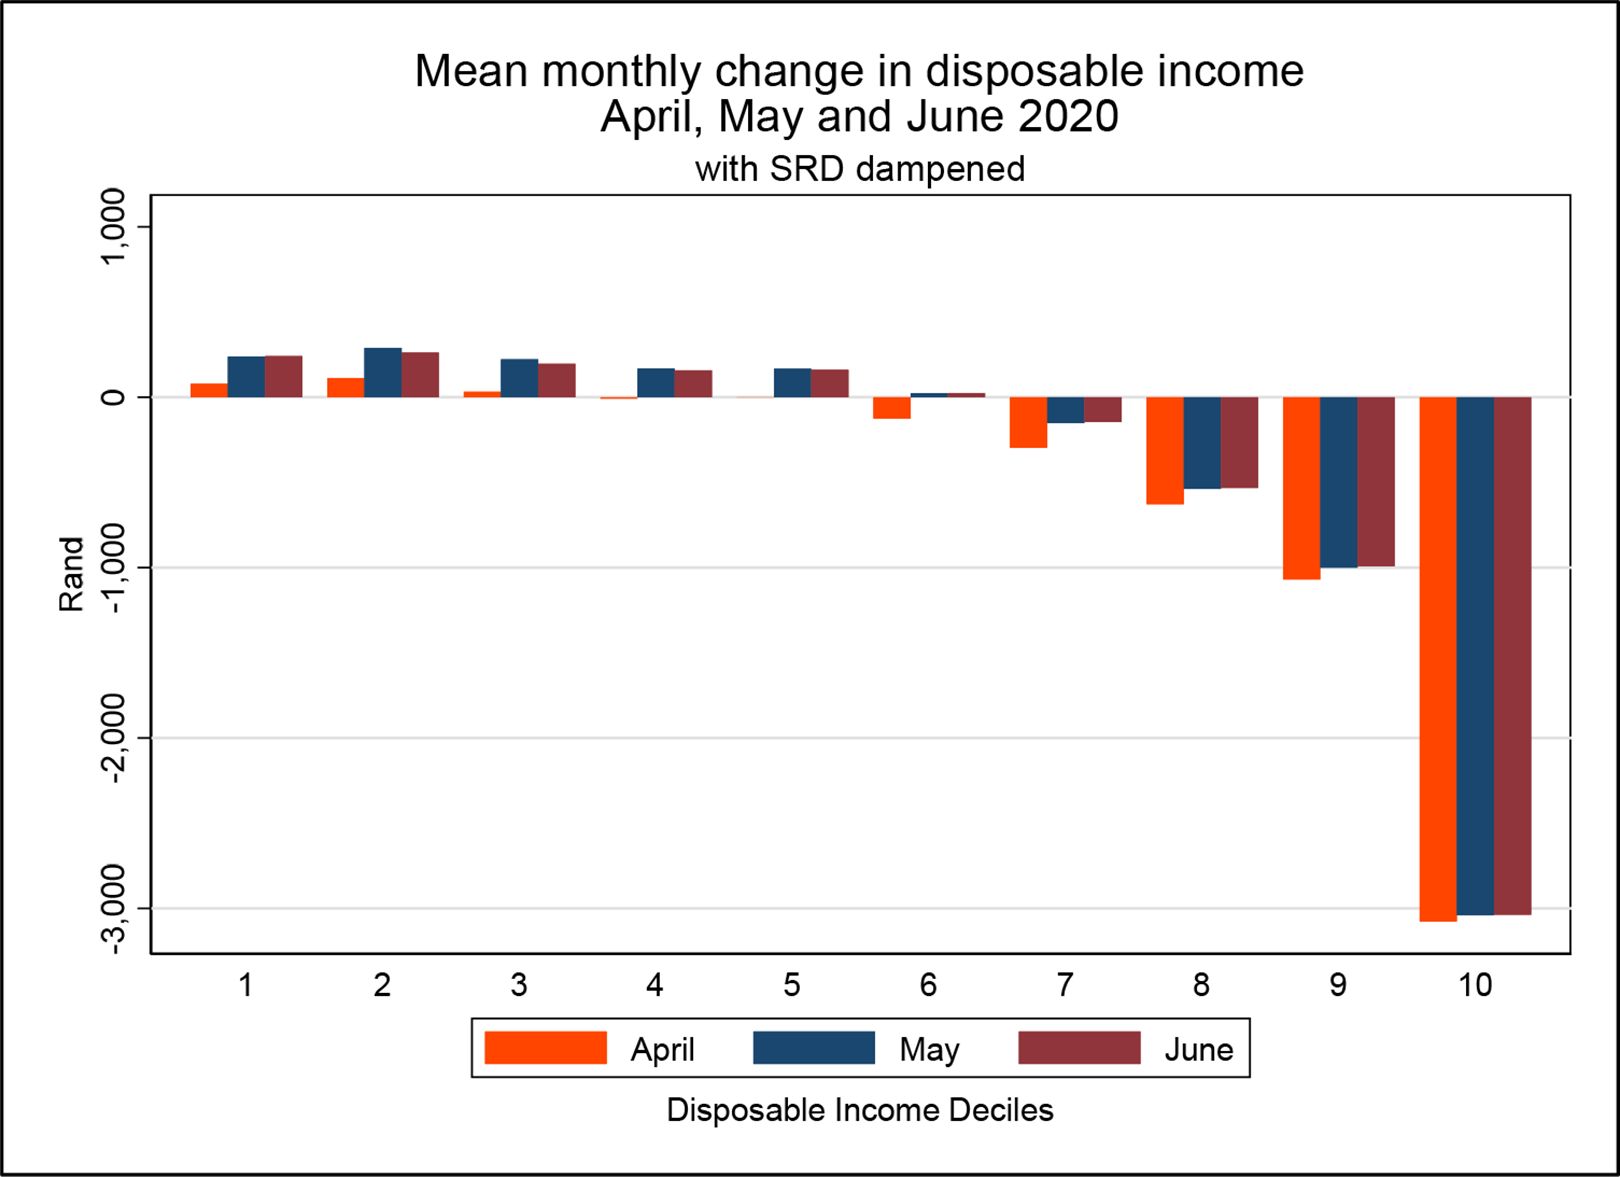
Change in mean monthly household disposable income by decile since March in April, May, and June 2020 (includes pre-COVID-19 and COVID-19 policies). Note: Simulated receipt of COVID-SRD benefit was dampened to match actual receipt (applicable to May and June only). Source: Authors’ analysis of output datasets from SAMOD V7.3-COVID.
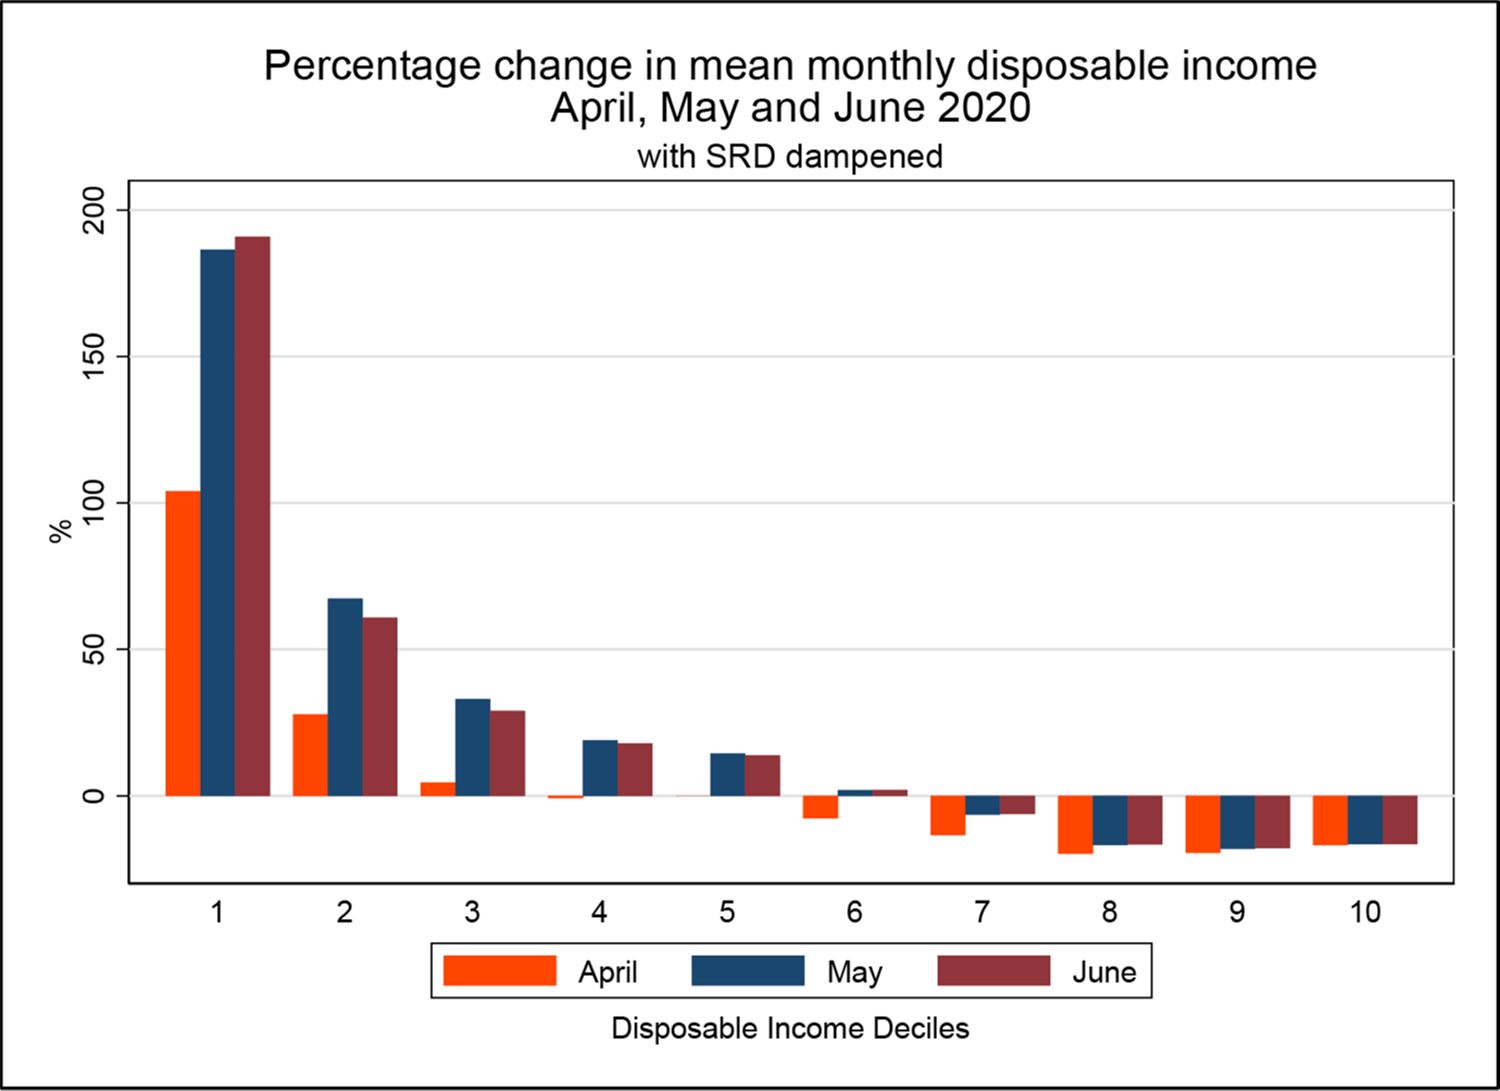
Percentage change in mean monthly household disposable income by decile since March in April, May, and June 2020 (includes pre-COVID-19 and COVID-19 policies). Note: Simulated receipt of COVID-SRD benefit was dampened to match actual receipt (applicable to May and June only). Source: Authors’ analysis of output datasets from SAMOD V7.3-COVID.
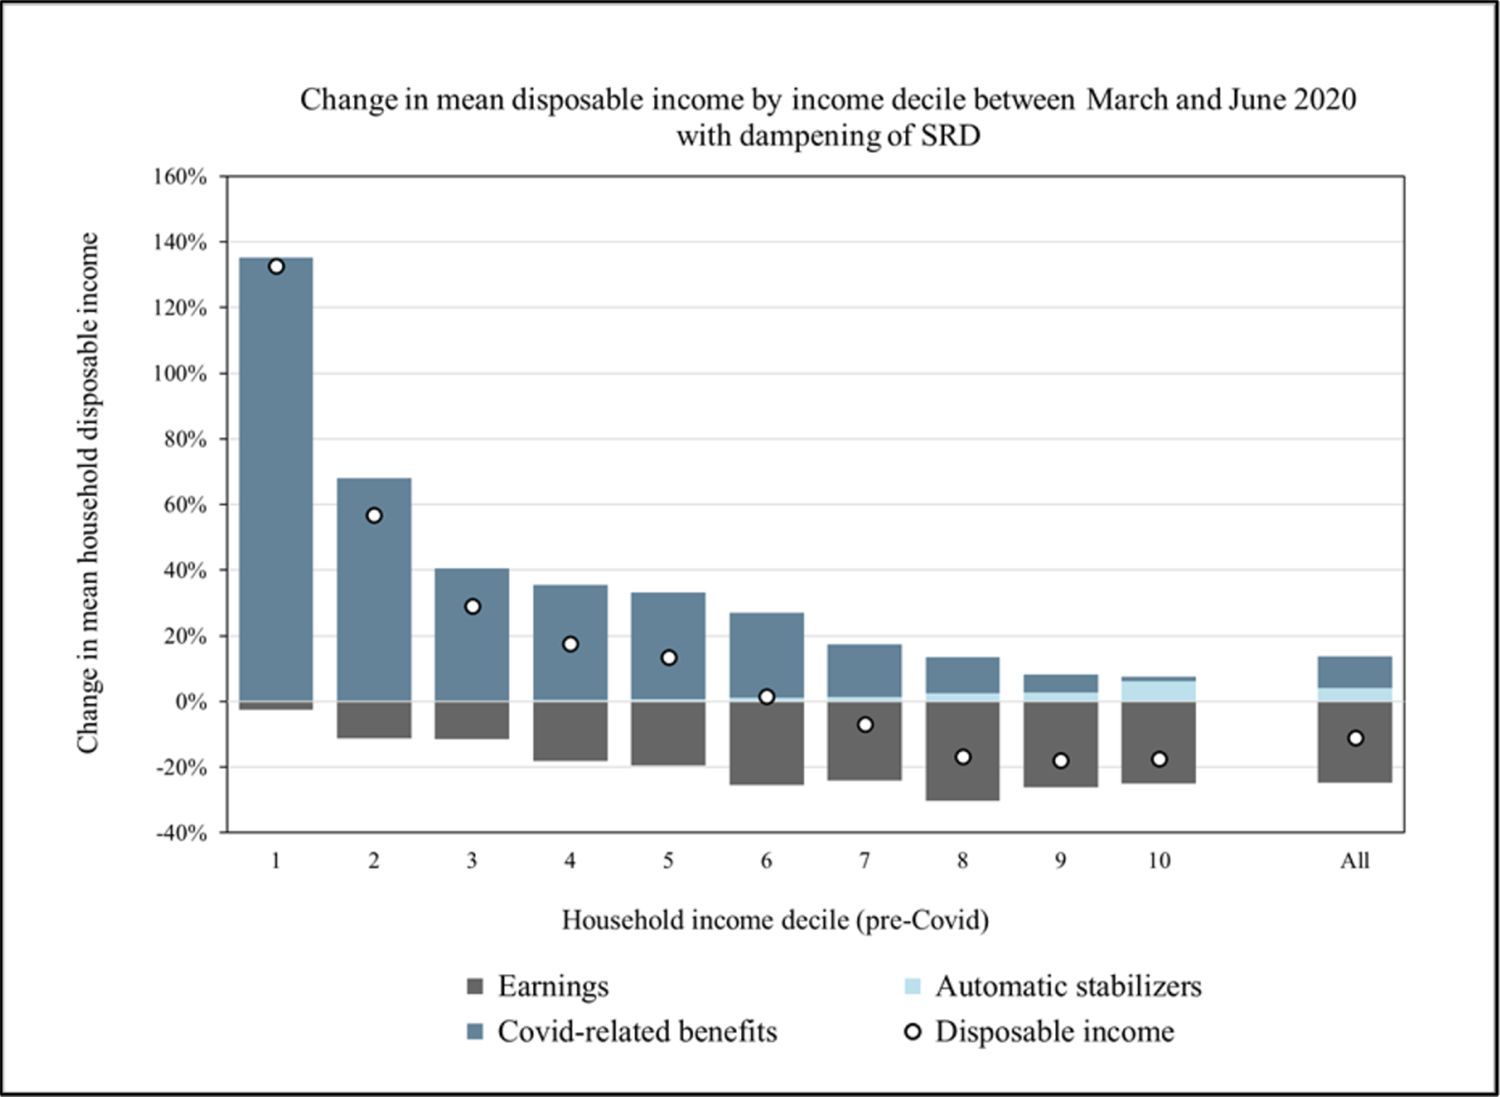
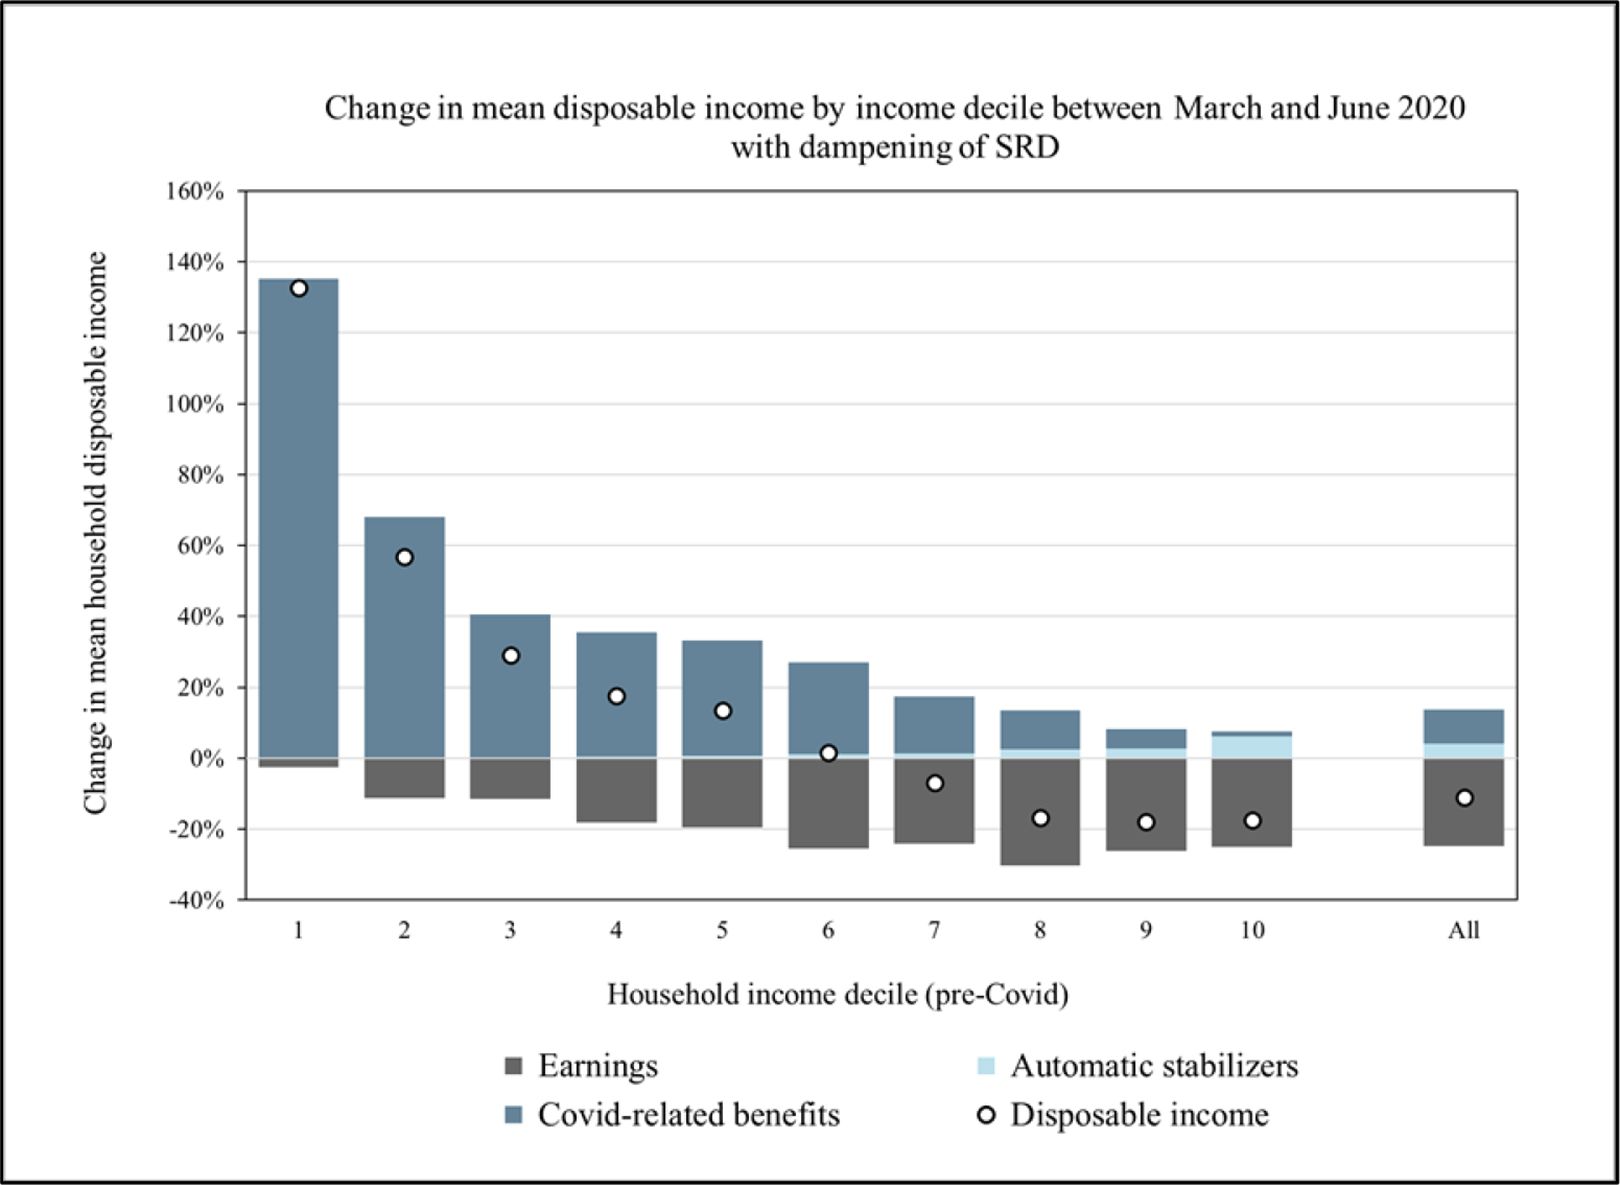
Change in mean monthly household disposable income by decile between March and June 2020. Note: Simulated receipt of COVID-SRD benefit was dampened to match actual receipt (applicable only to June in this figure). Source: Authors’ analysis of output datasets from SAMOD V7.3-COVID.

Reweighting from original dwt to rebased dwt_2017q2pl. Source: Authors’ construction.

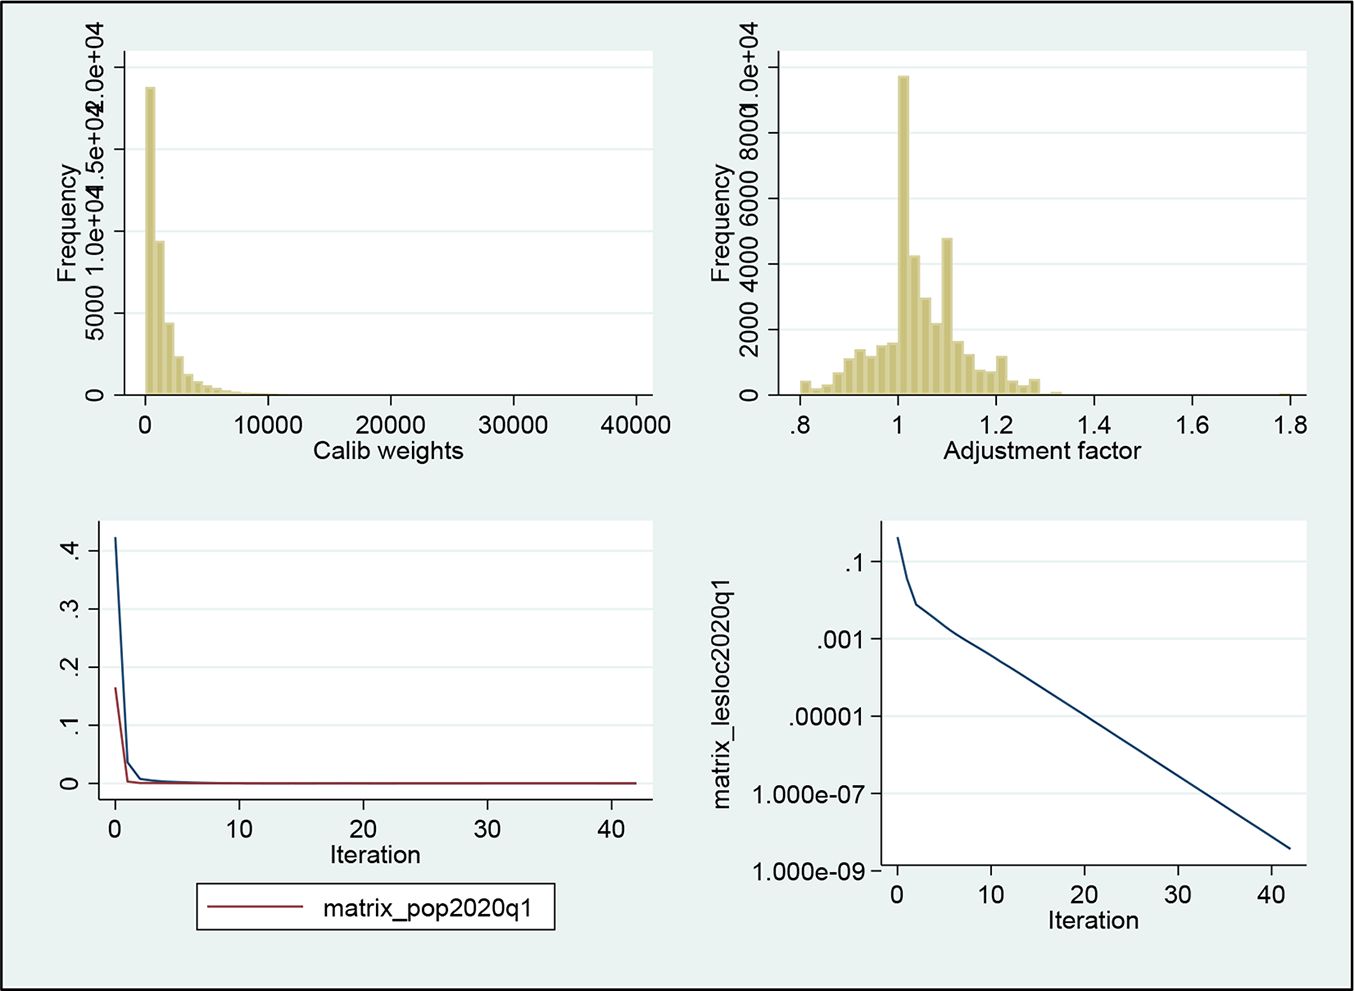
Reweighting from rebased dwt_2017q2pl to new dwt_2020q1pl. Source: Authors’ construction.
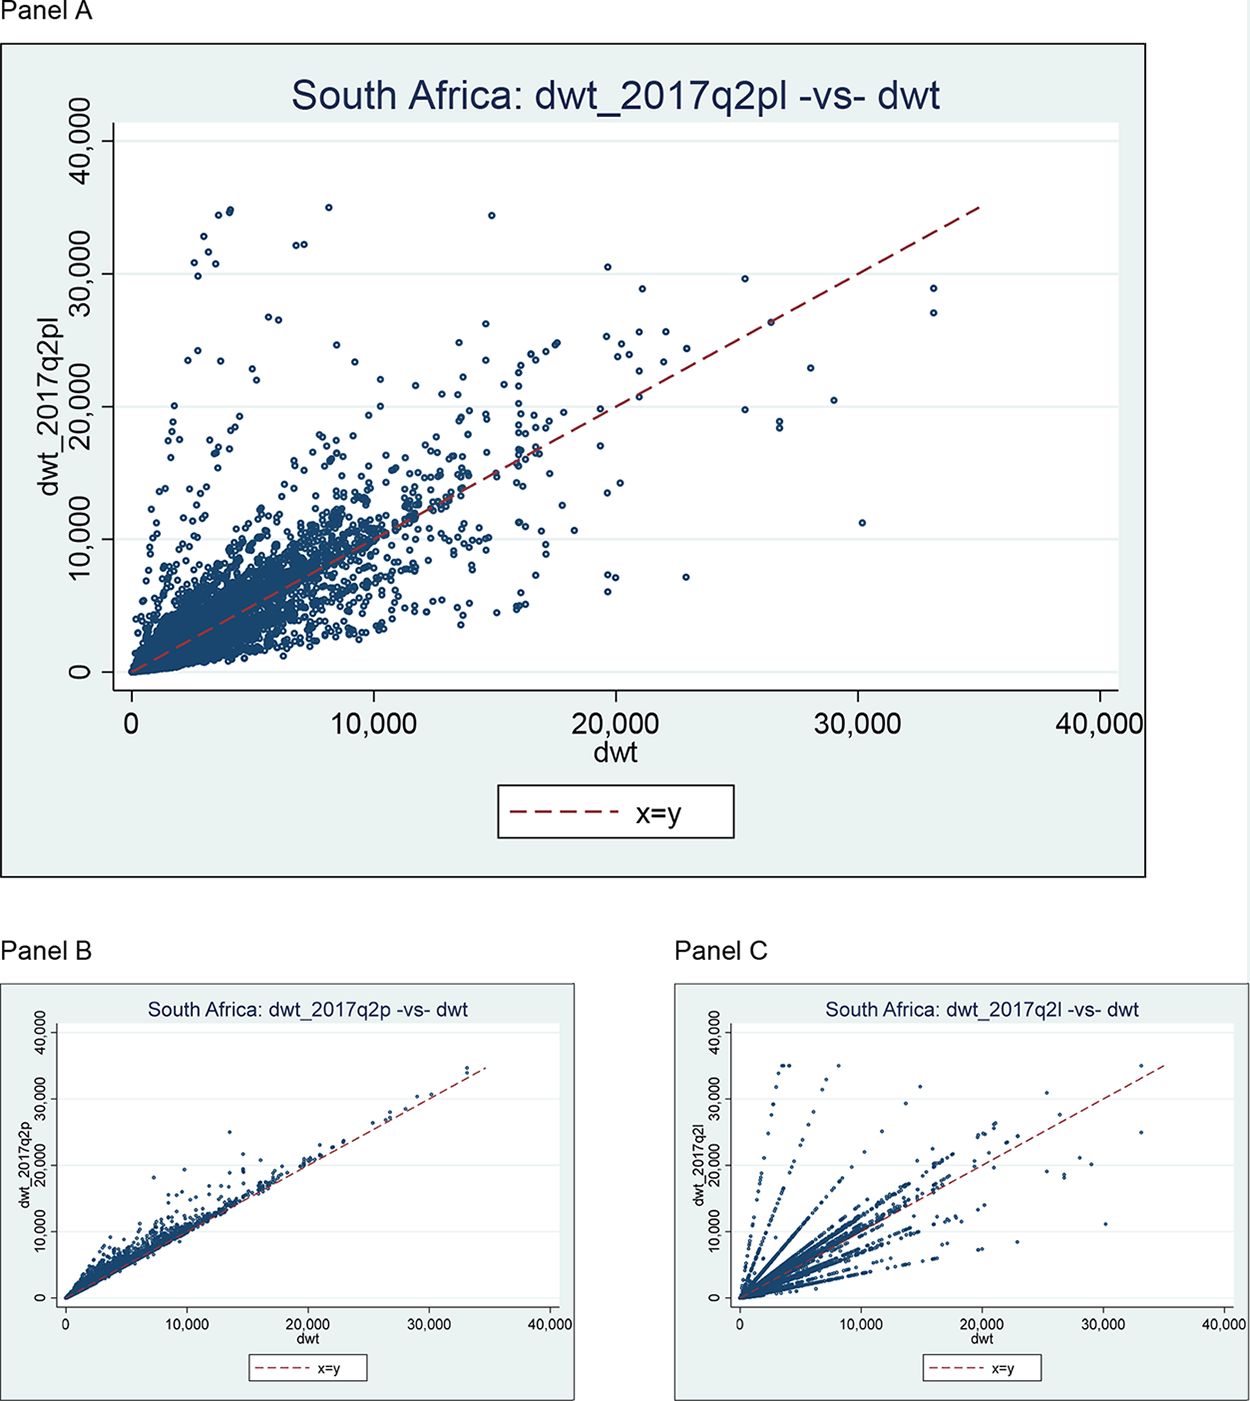
Effects of reweighting from original 2017 weight (dwt) to match the population estimate for mid-2017 and the QLFS labour market profile for 2017 Q2 (dwt_2017q2pl). Note: dwt: Original 2017 survey weights in SAMOD input dataset (i.e. NIDS Wave 5). dwt_2017q2pl: Reweighted to 2017 Q2 external controls for population estimates (‘p’) and labour market (‘l’). dwt_2017q2p: Reweighted to 2017 Q2 external controls for population estimates (‘p’) only. dwt_2017q2l: Reweighted to 2017 Q2 external controls for labour market (‘l’) only. Source: Authors’ construction.

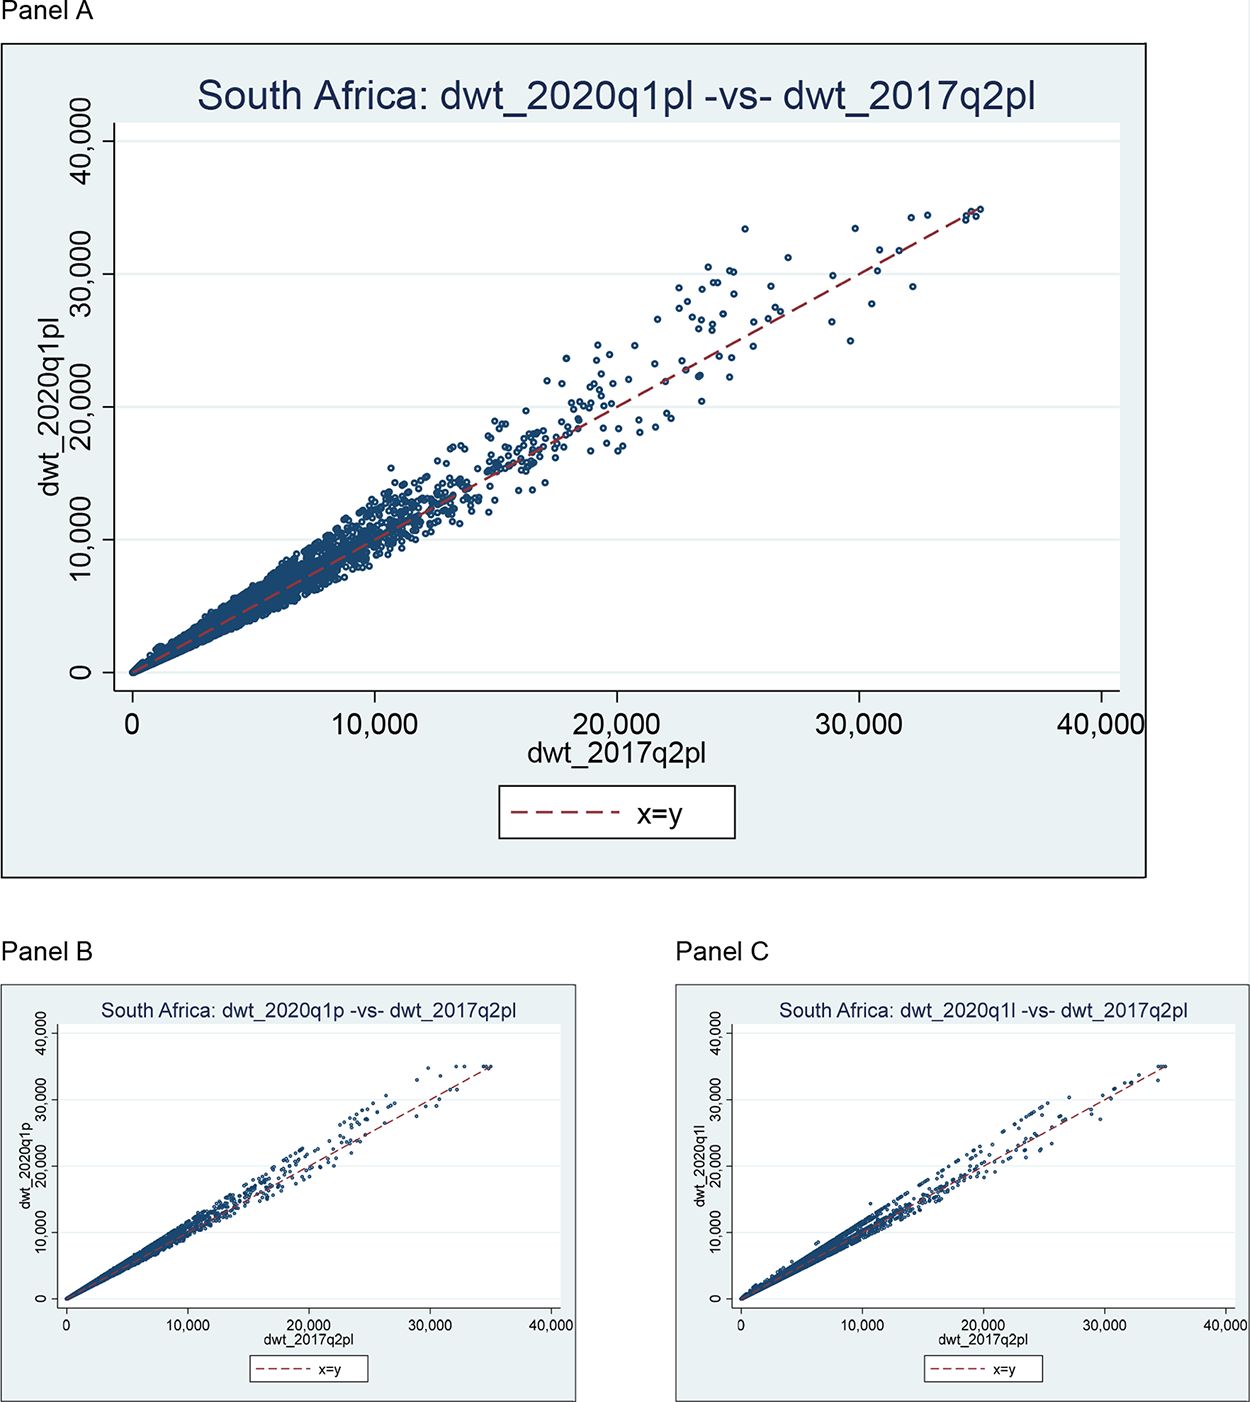
Effects of reweighting from rebased 2017 weight (dwt_2017q2pl) to match the population estimate for end of March 2020 and the QLFS labour market profile for 2017 Q2. Note: dwt_2017q2pl: Reweighted to 2017 Q2 external controls for population estimates (‘p’) and labour market (‘l’). dwt_2020q1pl: Reweighted to 2020 Q1 external controls for population estimates (‘p’) and labour market (‘l’). dwt_2020q1p: Reweighted to 2020 Q1 external controls for population estimates (‘p’) only. dwt_2020q1l: Reweighted to 2020 Q1 external controls for labour market (‘l’) only. Source: Authors’ construction.
Tables
Tax and benefit policies that are included in SAMOD for 2020
| Tax–benefit policy | Existed prior to COVID-19? | Changes introduced due to COVID-19? | Summary of the changes that were introduced due to COVID-19, if applicable |
|---|---|---|---|
| Old Age Grant (OAG) | ✓ | ✓ | OAG top-up of R250 in May–October 2020 inclusive |
| Disability Grant (DG) | ✓ | ✓ | DG top-up of R250 in May–October 2020 inclusive |
| Child Support Grant | ✓ | ✓ | CSG top-up of R300 per child for May 2020 only |
| Care Dependency Grant (CDG) | ✓ | ✓ | CDG top-up of R250 in May–October 2020 inclusive |
| Foster Child Grant (FCG) | ✓ | ✓ | FCG top-up of R250 in May–October2020 inclusive |
| Caregiver Social Relief of Distress (Caregiver-SRD) | X | ✓ New | A payment of R500 was made to each CSG caregiver (irrespective of number of children) for June–October 2020 inclusive |
| COVID-19 Social Relief of Distress (COVID-SRD) | X | ✓ New | COVID-19 SRD payment of R350 from May 2020 to end of April 2021 |
| Personal income tax main policy | ✓ | ✓ But not implemented in SAMOD | A proportion of PAYE (paid to the South African Revenue Service by employers) could be deferred. Tax relief was also introduced for provisional tax (for the self-employed, individuals running their own small businesses with gross income below R100 million). |
| Income tax rebates | ✓ | X | N/A |
| Income tax on lump sums | ✓ | X | N/A |
| Medical tax credits | ✓ | X | N/A |
| Unemployment Insurance Fund contributions | ✓ | X | N/A |
| Temporary Employer/Employee Relief Scheme | X | ✓ New | UIF introduced TERS (or ‘COVID UIF’) payments for furloughed employees in April 2020, which had a minimum payment of R3,500 per month (even if usual salary is less than this) up to R6,500 per month on a sliding scale. |
-
Source: Authors’ compilation.
-
Note: The Skills Development Levy and the Employment Tax Incentive are not modelled in SAMOD as these concern employers rather than employees. Grant-in-aid and the War Veterans Grant are not simulated due to lack of information in the input dataset with which to model the policy. UIF contributions are simulated in SAMOD but receipt of the main UIF benefits is not modelled due to lack of data on past contributions. CSG was also increased from 1 October 2020 by R10 to R450.
Poverty headcount ratio (P0) and poverty depth (P1) in March, April, May, and June 2020 under different assumptions
| Poverty line | Scenario | March | April | May | June | |
|---|---|---|---|---|---|---|
| FPL | Existing policies (COVID-SRD dampened) | P0 | 0.206 | 0.263 | 0.209 | 0.188 |
| P1 | 0.091 | 0.129 | 0.083 | 0.070 | ||
| Existing policies (COVID-SRD not dampened) | P0 | N/A | N/A | 0.164 | 0.177 | |
| P1 | N/A | N/A | 0.047 | 0.049 | ||
| All policies apart from COVID-19 policies | P0 | N/A | 0.321 | 0.321 | 0.321 | |
| P1 | N/A | 0.158 | 0.158 | 0.158 | ||
| LBPL | Existing policies (COVID-SRD dampened) | P0 | 0.326 | 0.379 | 0.343 | 0.307 |
| P1 | 0.145 | 0.188 | 0.143 | 0.123 | ||
| Existing policies (COVID-SRD not dampened) | P0 | N/A | N/A | 0.276 | 0.291 | |
| P1 | N/A | N/A | 0.099 | 0.105 | ||
| All policies apart from COVID-19 policies | P0 | N/A | 0.452 | 0.452 | 0.452 | |
| P1 | N/A | 0.229 | 0.229 | 0.229 | ||
| UBPL | Existing policies (COVID-SRD dampened) | P0 | 0.482 | 0.525 | 0.527 | 0.475 |
| P1 | 0.233 | 0.278 | 0.245 | 0.215 | ||
| Existing policies (COVID-SRD not dampened) | P0 | N/A | N/A | 0.461 | 0.468 | |
| P1 | N/A | N/A | 0.192 | 0.199 | ||
| All policies apart from COVID-19 policies | P0 | N/A | 0.593 | 0.593 | 0.593 | |
| P1 | N/A | 0.329 | 0.329 | 0.329 |
-
Source: Authors’ analysis of output datasets from SAMOD V7.3-COVID.
-
Note: FPL, food poverty line (R561 in April 2019 rands); LBPL, lower-bound poverty line (R810 in April 2019 rands); UBPL, upper-bound poverty line (R1,227 in April 2019 rands). Simulated receipt of COVID-SRD benefit was dampened to match actual receipt (applicable to May and June only). The poverty lines were inflated from April 2019 rands to March, April, May, and June 2020 rands using the consumer price index and then averaged.
Poverty in March, April, May, and June 2020 for household subgroups, with and without the COVID-19 policies: food poverty line
| Household subgroup | Scenario | March | April | May | June |
|---|---|---|---|---|---|
| Female-headed households | Existing policies (COVID-SRD dampened) | 0.243 | 0.263 | 0.204 | 0.190 |
| All policies apart from COVID-19 policies | N/A | 0.351 | 0.351 | 0.351 | |
| Households with older people | Existing policies (COVID-SRD dampened) | 0.096 | 0.121 | 0.008 | 0.009 |
| All policies apart from COVID-19 policies | N/A | 0.156 | 0.156 | 0.156 | |
| Households with children | Existing policies (COVID-SRD dampened) | 0.225 | 0.279 | 0.193 | 0.179 |
| All policies apart from COVID-19 policies | N/A | 0.339 | 0.339 | 0.339 |
-
Source: Authors’ analysis of output datasets from SAMOD V7.3-COVID.
-
Note: Simulated receipt of the COVID-SRD benefit was dampened to match actual receipt (applicable to May and June only). The household subgroups are not mutually exclusive. The food poverty line (R561 in April 2019 rands) was inflated from April 2019 rands to March, April, May, and June 2020 rands using the consumer price index and then averaged.
Income inequality in March, April, May, and June 2020 under different assumptions
| Scenario | Gini coefficient | |||
|---|---|---|---|---|
| March | April | May | June | |
| Existing policies (COVID-SRD dampened) | 0.644 | 0.648 | 0.631 | 0.613 |
| Existing policies (COVID-SRD not dampened) | N/A | N/A | 0.600 | 0.603 |
| All policies apart from COVID-19 policies | N/A | 0.676 | 0.676 | 0.676 |
-
Source: Authors’ analysis of output datasets from SAMOD V7.3-COVID.
-
Note: Simulated receipt of COVID-SRD benefit was dampened to match actual receipt (applicable to May and June only). The first row shows results for all simulated tax and benefit policies including COVID-19 policies. The COVID-19 policies comprise TERS (applied in April, May, and June); benefit increases (in May and June with the exception of the CSG increase, which was only in May); and new benefits (COVID-SRD in May and June; Caregiver-SRD in June). No results are shown for March and April in the middle row as the COVID-SRD benefit was only introduced in May. No results are shown for March in the bottom row as there were no COVID-19 policies in place.
Percentage of households with earnings and mean earnings, by household income decile in March and April 2020
| Decile | Percentage of households with earnings | Mean monthly earnings (rands) | ||
|---|---|---|---|---|
| March | April | March | April | |
| 1 (poorest) | 13.0 | 8.6 | 368 | 354 |
| 2 | 48.4 | 28.2 | 1,133 | 1,022 |
| 3 | 57.4 | 41.2 | 1,981 | 1,682 |
| 4 | 68.3 | 49.6 | 3,076 | 2,291 |
| 5 | 80.7 | 62.4 | 4,688 | 3,870 |
| 6 | 87.8 | 69.2 | 6,213 | 4,893 |
| 7 | 78.2 | 65.3 | 8,669 | 7,059 |
| 8 | 93.7 | 80.1 | 13,392 | 10,656 |
| 9 | 94.3 | 83.9 | 20,213 | 16,733 |
| 10 (richest) | 92.4 | 85.5 | 49,289 | 41,423 |
-
Source: Analysis of input datasets from SAMOD V7.3-COVID.
-
Note: Earnings are defined in this table as income from employment or self-employment. The April dataset includes the labour market shock induced by the pandemic and lockdown using predictions based on NIDS-CRAM Wave 1 (for more details, see Appendix C).
Summary of datasets and tax–benefit systems in SAMOD V7.3-COVID
| Era and dataset name | Month in 2020 | System name | System summary(tax and benefit policies) |
|---|---|---|---|
| Pre-crisis SA_2017_b3_pre_2 |
March | sa_2020_march | Actual policies in March |
| Crisis SA_2017_b3_April |
April | sa_2020_april | Actual policies in April |
| sa_2020_april_noters | Existing policies excluding those introduced because of COVID | ||
| May | sa_2020_may | Actual policies in May | |
| sa_2020_may_damp_bsaon | Existing policies but COVID-SRD dampened to actual figures | ||
| sa_2020_may_nocovidpols | Existing policies excluding those introduced because of COVID | ||
| June | sa_2020_june | Actual policies in June | |
| sa_2020_june_damp_bsaon | Existing policies but COVID-SRD dampened to actual figures | ||
| sa_2020_june_nocovidpols | Existing policies excluding those introduced because of COVID |
Coefficients from the multinomial logit for different employment outcomes (relative to remaining employed without a drop in earnings)
| April employment outcome | ||||||
|---|---|---|---|---|---|---|
| Employed with a reduction in earnings | Furloughed | No longer employed | ||||
| 15–24 years | 0 | (.) | 0 | (.) | 0 | (.) |
| 25–34 years | 0.289 | (0.66) | 0.0120 | (0.03) | 0.120 | (0.43) |
| 35–44 years | 0.492 | (1.07) | −0.0866 | (−0.22) | −0.0969 | (−0.32) |
| 45–54 years | 0.179 | (0.38) | 0.106 | (0.28) | 0.0263 | (0.08) |
| 55+ years | 0.403 | (0.84) | 0.563 | (1.27) | −0.0676 | (−0.17) |
| Urban | −0.0868 | (−0.37) | −0.189 | (−0.71) | 0.0450 | (0.24) |
| 1.Managers | 0 | (.) | 0 | (.) | 0 | (.) |
| 2.Professionals | −0.199 | (−0.48) | −0.688 | (−1.11) | −0.327 | (−0.57) |
| 3.Technicians and associate professionals | −0.0749 | (−0.16) | −0.355 | (−0.51) | −0.0279 | (−0.05) |
| 4.Clerical support workers | 0.355 | (0.71) | −0.115 | (−0.18) | 0.254 | (0.47) |
| 5.Service and sales workers | 0.0806 | (0.18) | 0.270 | (0.45) | 0.0418 | (0.08) |
| 6.Skilled agricultural, forestry, and fishery workers | 0.416 | (0.60) | −0.555 | (−0.59) | −0.226 | (−0.35) |
| 7.Craft and related trades workers | 0.330 | (0.72) | 0.670 | (1.01) | 0.0275 | (0.05) |
| 8.Plant and machine operators, and assemblers | 0.0751 | (0.14) | −0.0198 | (−0.03) | 0.774 | (1.48) |
| 9.Elementary occupations | 0.00397 | (0.01) | 0.123 | (0.19) | 0.294 | (0.60) |
| Female | −0.131 | (−0.09) | 0.767 | (0.47) | −0.833 | (−0.61) |
| African | 0 | (.) | 0 | (.) | 0 | (.) |
| Coloured/Asian/Indian | 0.501 | (1.42) | −1.582* | (−2.54) | −0.546 | (−1.15) |
| White | 0.457 | (1.08) | −0.113 | (−0.19) | −0.00196 | (−0.00) |
| No education | 0 | (.) | 0 | (.) | 0 | (.) |
| Primary | 0.852 | (0.67) | 1.359 | (0.92) | 0.138 | (0.11) |
| Incomplete secondary | −0.270 | (−0.22) | 1.771 | (1.23) | 0.202 | (0.17) |
| Matric | −0.0546 | (−0.04) | 1.131 | (0.78) | 0.445 | (0.38) |
| Tertiary | −0.108 | (−0.09) | 2.010 | (1.37) | 0.0400 | (0.03) |
| Earning quintile 1 | 0 | (.) | 0 | (.) | 0 | (.) |
| Earning quintile 2 | −0.283 | (−0.45) | −0.904 | (−1.93) | −0.643 | (−1.85) |
| Earning quintile 3 | 0.511 | (1.01) | −1.099** | (−2.77) | −1.600*** | (−5.03) |
| Earning quintile 4 | 0.543 | (1.10) | −1.737*** | (−3.97) | −1.137*** | (−3.43) |
| Earning quintile 5 | 0.847 | (1.67) | −1.579** | (−2.79) | −2.550*** | (−5.45) |
| 2.Female # African/Black | 0 | (.) | 0 | (.) | 0 | (.) |
| 2.Female # Coloured/Asian/Indian | −1.158 | (−1.87) | 1.793 | (1.95) | 0.451 | (0.68) |
| 2.Female # White | 0.712 | (1.10) | 0.599 | (0.78) | 0.488 | (0.63) |
| 2.Female # None | 0 | (.) | 0 | (.) | 0 | (.) |
| 2.Female # Primary | −0.988 | (−0.63) | −0.684 | (−0.40) | 0.990 | (0.66) |
| 2.Female # Incomplete Secondary | 0.739 | (0.48) | −1.668 | (−1.00) | 1.002 | (0.72) |
| 2.Female # Matric | 1.076 | (0.70) | −0.493 | (−0.29) | 1.428 | (1.03) |
| 2.Female # Tertiary | 1.282 | (0.84) | −0.827 | (−0.49) | 1.432 | (1.02) |
| Female # Earning quintile 1 | 0 | (.) | 0 | (.) | 0 | (.) |
| Female # Earning quintile 2 | 0.722 | (1.04) | 0.219 | (0.35) | −0.183 | (−0.44) |
| Female # Earning quintile 3 | −0.900 | (−1.49) | 0.200 | (0.38) | 0.374 | (0.88) |
| Female # Earning quintile 4 | −1.016 | (−1.48) | 0.505 | (0.63) | −0.396 | (−0.91) |
| Female # Earning quintile 5 | −2.229** | (−2.95) | −1.237 | (−1.37) | 0.0898 | (0.13) |
| Constant | −2.289 | (−1.59) | −2.406 | (−1.53) | −0.646 | (−0.50) |
-
Source: Authors’ calculations based on NIDS-CRAM and SAMOD data.
-
Note: t statistics in parentheses. All equations are relative to the baseline outcome of ‘employed with no drop in earnings’. * p < 0.05, ** p < 0.01, *** p < 0.001.
Estimated proportional earnings reductions in race and sex subgroups (NIDS-CRAM)
| Mean earnings reduction (%) | Standard error | n | |
|---|---|---|---|
| African males | 27.7 | 30.34 | 200 |
| Coloured/Asian/Indian males | 40.49 | 27.07 | 27 |
| White males | 39.62 | 32.22 | 29 |
| African females | 23.92 | 27.2 | 228 |
| Coloured/Asian/Indian females | 33.54 | 32.24 | 33 |
| White females | 40.83 | 30.73 | 27 |
-
Source: Authors’ calculations based on NIDS-CRAM and SAMOD data.
-
Note: These proportions are estimates of the extent of the reduction in earnings among those who faced earnings reductions. A 15 per cent threshold was used for earnings reductions.
April employment outcomes among those who were employed in February (weighted estimates)
| NIDS-CRAM April employment outcome | Simulated April employment outcome in SAMOD | |||||
|---|---|---|---|---|---|---|
| Estimated percentage | Estimated total | N | Estimated percentage | Estimated total | N | |
| Employed with no drop in earnings | 51.13 | 9,386,097 | 1,718 | 53.71 | 8,875,967 | 5,333 |
| Employed with a drop in earnings | 12.24 | 2,247,465 | 411 | 14.21 | 2,348,882 | 1,411 |
| Furloughed | 11.88 | 2,181,499 | 399 | 11.51 | 1,902,303 | 1,143 |
| No longer employed | 24.75 | 4,543,719 | 832 | 20.56 | 3,397,428 | 2,041 |
-
Source: Authors’ calculations based on NIDS-CRAM and SAMOD data.
Distribution of simulated April outcomes by actual NIDS-CRAM April outcome
| Simulated April employment outcome (SAMOD) | |||||
|---|---|---|---|---|---|
| Actual April employment outcome (NIDS-CRAM) | Employed with no drop in earnings | Employed with a drop in earnings | Furloughed | No longer employed | Total percentage (N) |
| Employed with no drop in earnings | 57.04 | 15.21 | 8.47 | 223 | 100 (N = 1157) |
| Employed with a drop in earnings | 55.97 | 13.58 | 9.05 | 21.4 | 100 (N = 243) |
| Furloughed | 49.37 | 15.06 | 13.81 | 21.76 | 100 (N = 239) |
| No longer employed | 47.81 | 13.36 | 12.73 | 26.1 | 100 (N = 479) |
-
Source: Authors’ calculations based on NIDS-CRAM and SAMOD data.
April employment outcomes among the February employed in different race and education groups (NIDS-CRAM)
| April employment outcome (%) | ||||
|---|---|---|---|---|
| Employed with no drop in earnings | Employed with a drop in earnings | Furloughed | No longer employed | |
| Race | ||||
| African | 49.2 | 10.69 | 13.38 | 26.72 |
| Coloured/Asian/Indian | 55.65 | 13.22 | 6.94 | 24.19 |
| White | 58.86 | 21.34 | 7.38 | 12.43 |
| Education level | ||||
| Less than matric | 46.61 | 9.63 | 14.12 | 29.64 |
| Matric | 48.84 | 12.08 | 9.03 | 30.05 |
| More than matric | 56.23 | 14.46 | 11.77 | 17.54 |
-
Source: Authors’ calculations based on NIDS-CRAM data.
Modelled April employment outcomes among the February employed in different race and educationgroups (SAMOD data)
| April employment outcome (%) | ||||
|---|---|---|---|---|
| Employed with no drop in earnings | Employed with a drop in earnings | Furloughed | No longer employed | |
| Race | ||||
| African | 53.43 | 11.83 | 12.57 | 22.17 |
| Coloured/Asian/Indian | 56.27 | 16.85 | 8.61 | 18.27 |
| White | 53.06 | 24.21 | 6.8 | 15.93 |
| Education level | ||||
| Less than matric | 51.48 | 11.23 | 13.47 | 23.81 |
| Matric | 50.7 | 17.31 | 6.09 | 25.9 |
| More than matric | 58.4 | 15.21 | 12.12 | 14.27 |
-
Source: Authors’ calculations based on SAMOD data.
Comparison of aggregate employment outcomes in NIDS-CRAM and SAMOD
| NIDS-CRAM Wave 1 (April) | SAMOD April simulated estimates | |||
|---|---|---|---|---|
| Estimated total | Estimated proportion | Estimated total | Estimated proportion | |
| NEA | 7,872,015 | 22.44 | 12,931,312 | 32.94 |
| Unemployed | 11,564,228 | 32.96 | 13,277,751 | 33.82 |
| Employed | 15,648,103 | 44.6 | 13,050,449 | 33.24 |
| Total | 35,084,347 | 100 | 39,259,512 | 100 |
-
Source: Authors’ calculations based on NID-CRAM and SAMOD data.
-
Note: Based on a sample of individuals aged 18 and above. NEA, not economically active.
Data and code availability
The NIDS and NIDS-CRAM datasets are freely available for download and can be applied for and accessed via this portal: https://www.datafirst.uct.ac.za/dataportal/index.php/catalog
SAMOD is proprietary but is made available to not-for-profit, government and academic users free of charge and subject to certain conditions. For more information contact info@saspri.org
For access to the EUROMOD microsimulation software contact: https://euromod-web.jrc.ec.europa.eu/contact