A Microsimulation Analysis of the Distributional Impact over the Three Waves of the COVID-19 Crisis in Ireland
- National University of Ireland, Ireland
- Luxembourg Institute of Socio-Economic Research, Luxembourg
Figures
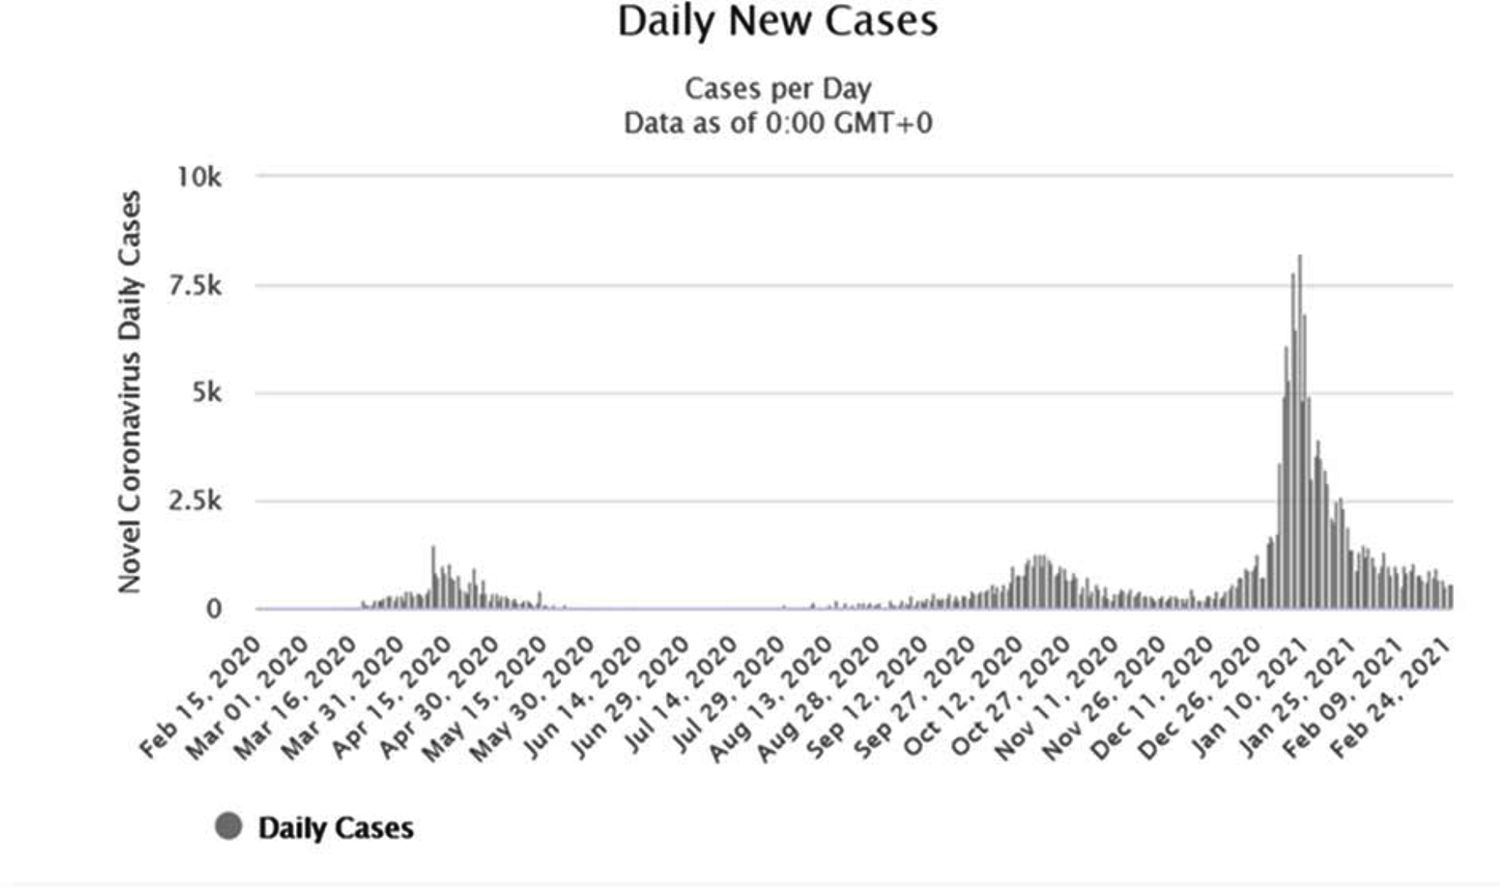
Daily number of COVID-19 cases in Ireland. Source: Worldometer data.

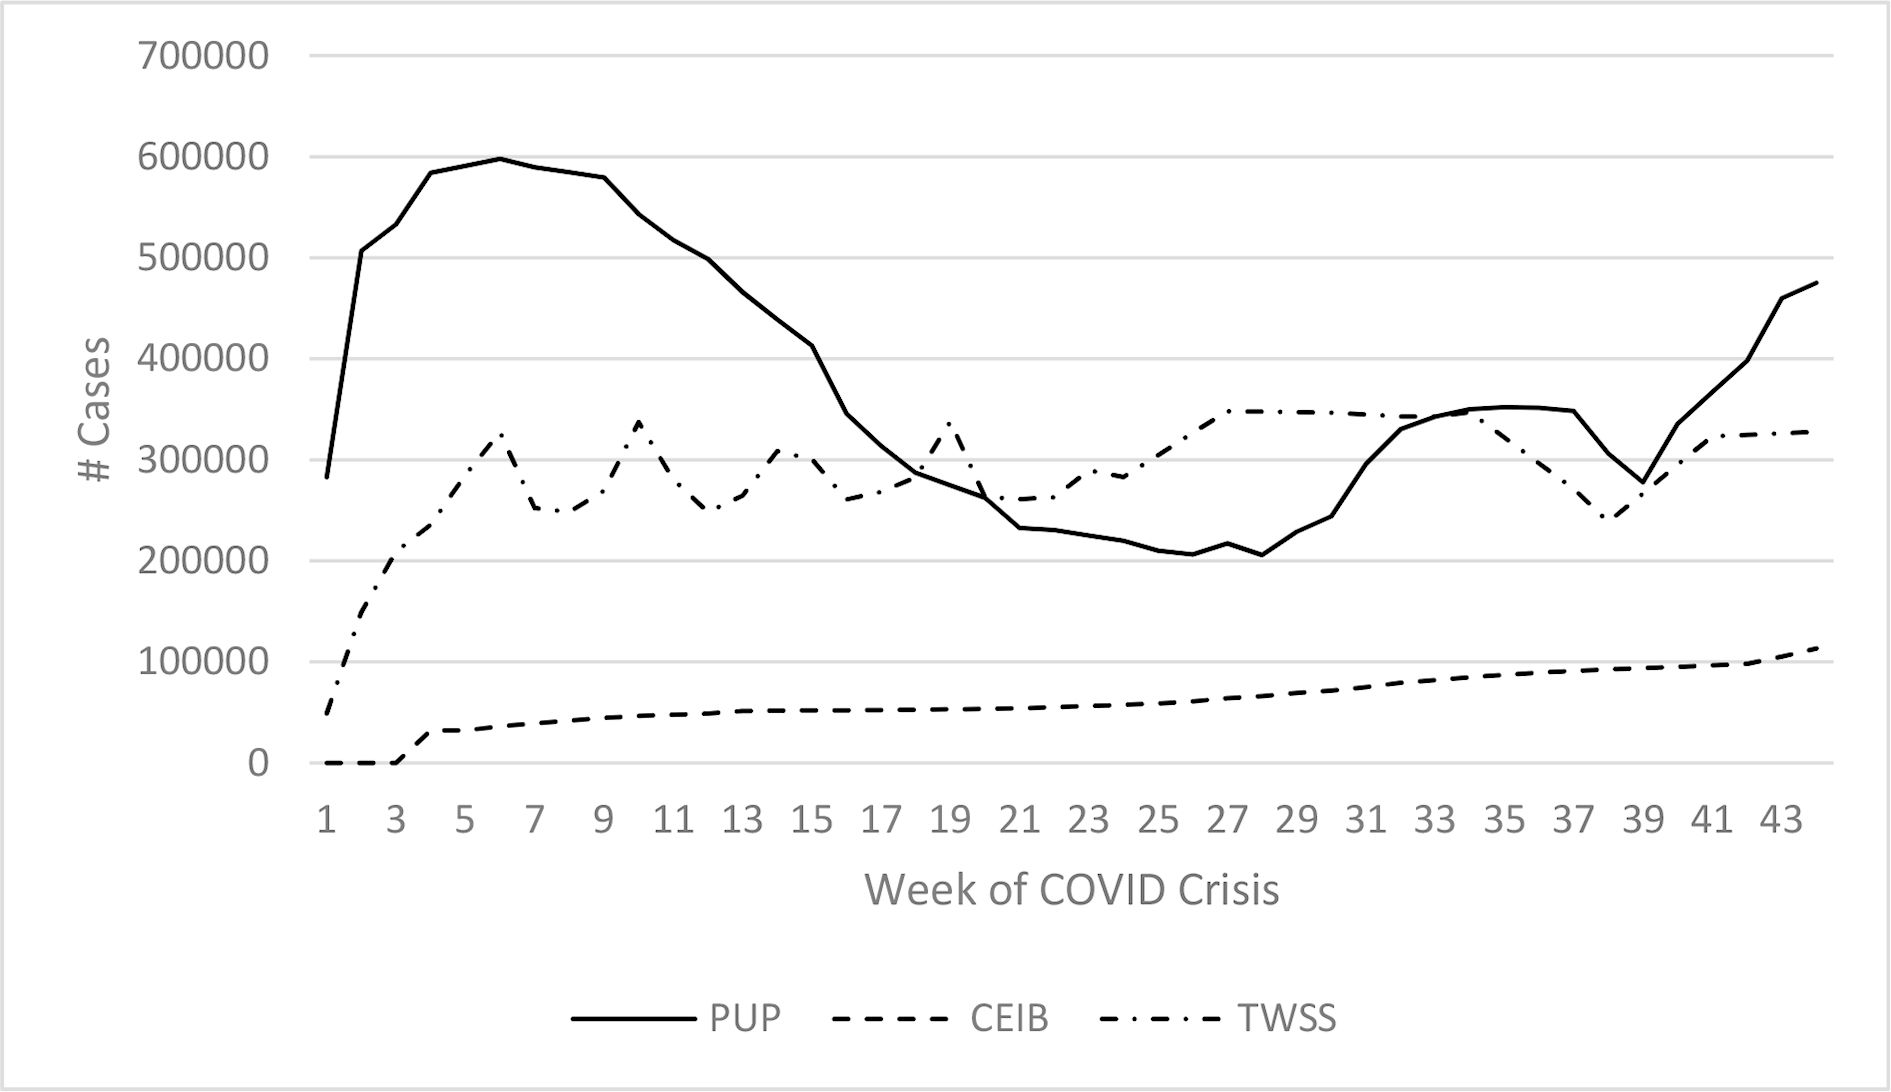
Trends in the recipients of the pandemic related payments. Note: CWS stands for various COVID Wage Subsidies; PUP stands for Pandemic Unemployment Payment; CEIB stands for COVID Enhanced Illness Benefit; TWSS stands for the Temporary Wage Subsidy Scheme.

Distributional characteristics of income before and during the crisis (in € per month per adult equivalent). Note: Adjusted disposable income stands for household equivalized disposable income adjusted for housing, work related expenses and capital losses.

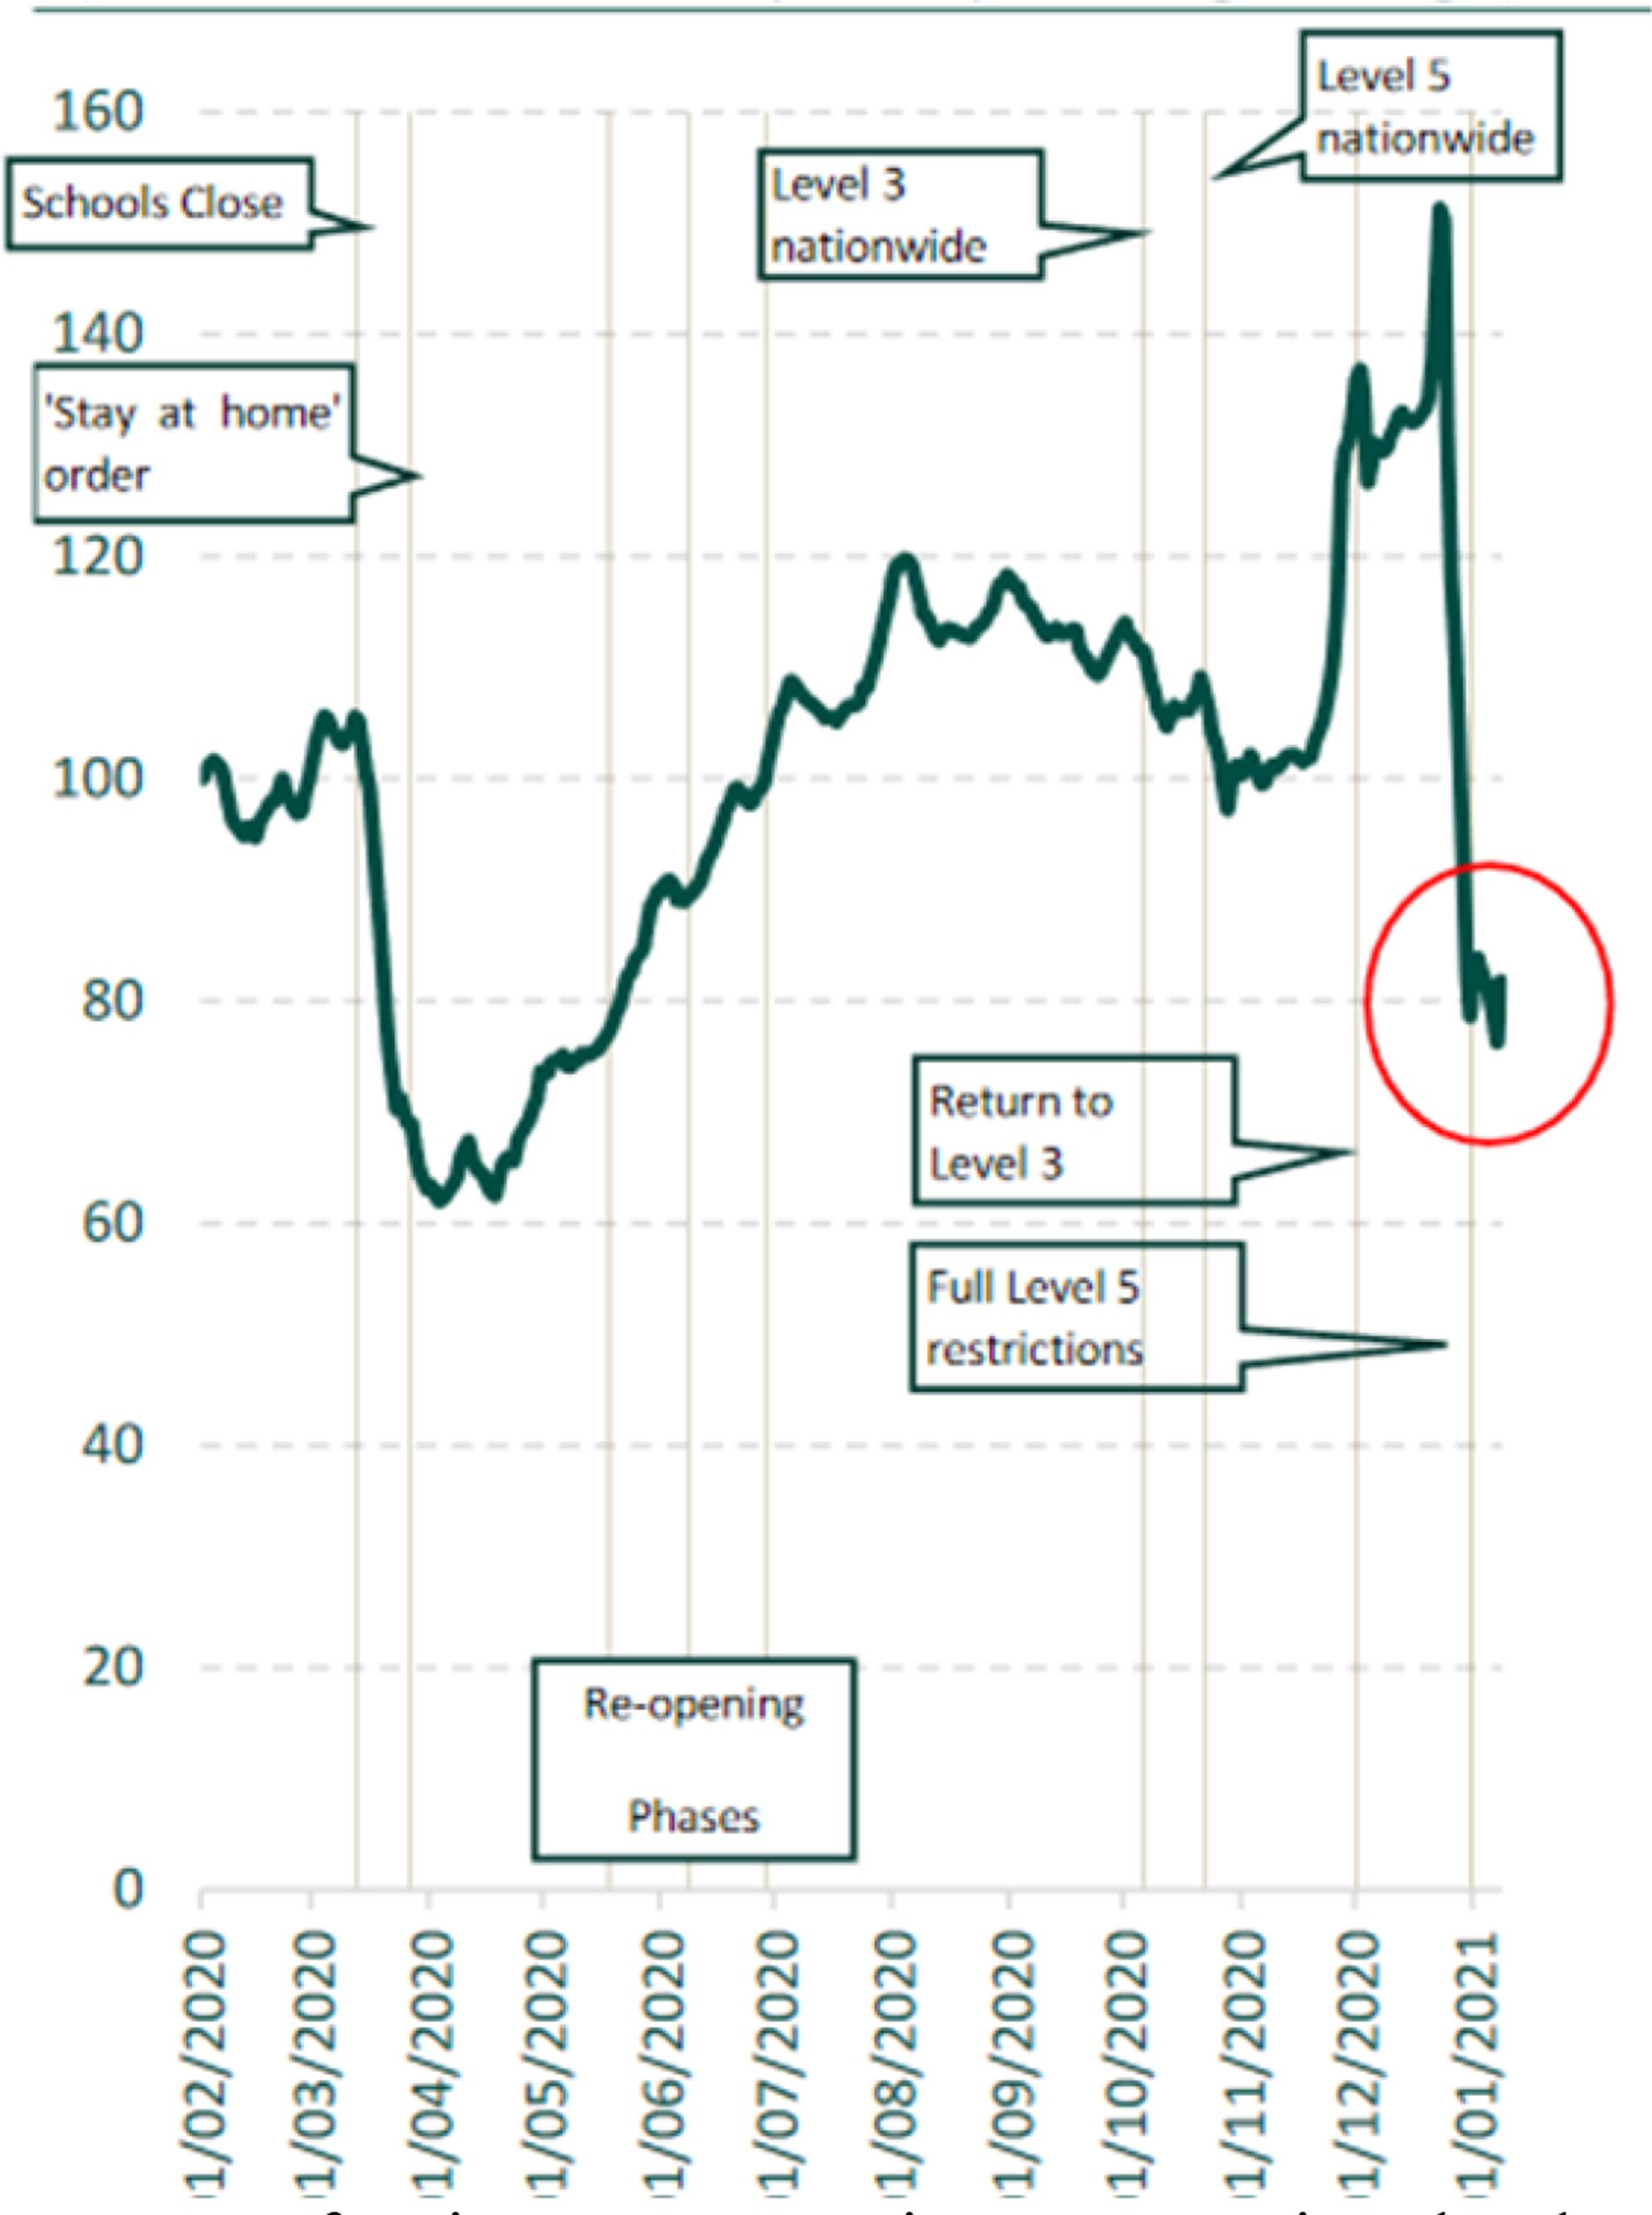
Phases of the COVID-19 crisis and total expenditure in Ireland, per user (indexed to 1stFebruary, 7-day moving average). Source: Revolut in Department of Finance Emerging economic developments-real-time economic domestic indicators. 11November 2020.

Methodology
Tables
Changes in the number of recipients of Pandemic Unemployment Payment and COVID Enhanced Illness Benefit over the first 9 months of the COVID-19 crisis
| PUP | CEIB | |||||||
|---|---|---|---|---|---|---|---|---|
| Before Crisis | May 5th | June 6th | August 28th | November 15th | May 5th | June 6th | August 28th | November 15th |
| Agriculture, Forestry and Fishing; Mining and Quarrying | 8600 | 7100 | 3,200 | 4321 | 400 | 500 | 500 | 4321 |
| Manufacturing | 37400 | 28100 | 12,500 | 15465 | 5100 | 6600 | 7800 | 15465 |
| Electricity, gas supply; Water supply, sewerage and waste management | 2100 | 1700 | 900 | 1134 | 200 | 200 | 300 | 1134 |
| Construction | 79300 | 51500 | 17,500 | 21061 | 1700 | 1900 | 2200 | 21061 |
| Wholesale and Retail Trade; Repair of Motor Vehicles and motorcycles | 90300 | 76900 | 32,900 | 57015 | 8400 | 10400 | 11900 | 57015 |
| Transportation and storage | 17900 | 15400 | 9,600 | 9127 | 1600 | 1900 | 2200 | 9127 |
| Accommodation and food service activities | 128500 | 120000 | 48,700 | 102682 | 1600 | 1800 | 2400 | 102682 |
| Information and communication activities | 11800 | 11600 | 6,800 | 7526 | 700 | 800 | 900 | 7526 |
| Financial and insurance activities | 12500 | 11600 | 6,000 | 7119 | 1700 | 2100 | 2300 | 7119 |
| Real Estate activities | 8100 | 7600 | 3,500 | 5442 | 300 | 400 | 500 | 5442 |
| Professional, Scientific and Technical activities | 24800 | 22300 | 11,700 | 13294 | 1300 | 1600 | 1800 | 13294 |
| Administrative and support service activities | 45800 | 41100 | 23,600 | 29674 | 3900 | 4900 | 5500 | 29674 |
| Public Administration And Defence; Compulsory Social Security | 14400 | 11700 | 5,600 | 5354 | 1700 | 2000 | 2200 | 5354 |
| Education | 22000 | 21600 | 14,400 | 10340 | 600 | 800 | 900 | 10340 |
| Human Health And Social Work activities | 22500 | 19700 | 9,900 | 10271 | 8300 | 10900 | 12200 | 10271 |
| Arts, entertainment and recreation | 14200 | 13800 | 6,300 | 11973 | 200 | 300 | 400 | 11973 |
| Other Sectors | 39200 | 37500 | 10,300 | 31048 | 1200 | 1400 | 1700 | 31048 |
-
Note: Numbers are expressed at each point in time.
-
Source: COVID-19 Statistics https://www.gov.ie/en/publication/f4c60c-covid-19-statistics/
Distribution of COVID-19 cases by age group and by work status (April 2020)
| Age Group | |||||||||
|---|---|---|---|---|---|---|---|---|---|
| 0 | 1-4 | 5-14 | 15-24 | 25-34 | 35-44 | 45-54 | 55-64 | 65+ | |
| In-work by Age | 0 | 0 | 0 | 91 | 413 | 452 | 441 | 259 | 61 |
| Out-of-Work by Age | 9 | 12 | 33 | 164 | 265 | 299 | 323 | 325 | 857 |
-
Note: The same approach was utilised to simulate COVID-19 cases for other age groups.
-
Source: COVID-19 Dashboard (https://geohive.maps.arcgis.com/apps/opsdashboard/index.html#/29dc1fec79164c179d18d8e53df82e96), accessed April 6th 2020.
Number of requests for mortgage deferral
| Number of Requests as of March 28 | 28000 |
| Number of Requests as of April 12 | 45000 |
| Number of Requests as of July | 160000 |
| Number of Requests as of September | 90539 |
-
Source: https://www.rte.ie/news/business/2020/0328/1127000-banking-mortgages-coronavirus/ https://www.irishexaminer.com/breakingnews/ireland/mortgage-breaks-for-six-months-as-45000-apply-for-payment-pause-993714.html https://www.centralbank.ie/statistics/statistical-publications/behind-the-data/covid-19-payment-breaks-who-has-needed-them
Cost of commuting per week
| Number of Workers | |||
|---|---|---|---|
| 1 | 2 | 3 | |
| Proportional Increase in Cost relative to not working | |||
| Motor Fuels | 0.263 | 0.482 | 0.721 |
| Public Transport | 0.172 | 0.253 | 0.595 |
| Cost per week | |||
| Motor Fuels | 7.41 | 13.59 | 20.33 |
| Public Transport | 1.76 | 0.83 | 3.49 |
| Total per week (€) | 9.17 | 14.42 | 23.82 |
-
Source: Household Budget Survey 2015-16.
Distribution of Child Care Costs (€) per Week by Family Type and Disposable Income Decile
| Family Type | 1 | 2 | 3 | 4 | 5 | 6 | 7 | 8 | 9 | 10 | Total |
|---|---|---|---|---|---|---|---|---|---|---|---|
| 1 adult with children | 2.9 | 7.8 | 3.3 | 22.0 | 22.4 | 39.1 | 68.0 | 65.9 | 191.2 | 268.5 | 18.1 |
| 2 adults with 1-3 children | 1.9 | 5.1 | 2.2 | 14.5 | 14.7 | 25.8 | 44.8 | 43.4 | 126.1 | 177.0 | 49.9 |
| Other households with children | 0.7 | 2.0 | 0.8 | 5.6 | 5.7 | 9.9 | 17.2 | 16.7 | 48.4 | 68.0 | 15.2 |
| Total | 0.4 | 1.0 | 0.6 | 5.5 | 4.7 | 7.6 | 12.9 | 13.6 | 30.2 | 40.3 | 12.0 |
-
Source: Household Budget Survey 2015-16
Distribution of holding and value of shares, 2018
| Percentile of household income | Less than 20 | 20-39 | 40-59 | 60-79 | 80-100 |
|---|---|---|---|---|---|
| Participation in total financial assets (%) | 3.3 | 3 | 8.3 | 11.3 | 24.8 |
| Median values of financial assets (€Thousand) | 1.4 | 8.8 | 3.1 | 4.4 | 12.2 |
| Distribution of total financial assets (%) | 1.4 | 4.3 | 11 | 12.5 | 12.4 |
| Age group | Under 35 years | 35 - 44 years | 45 - 54 years | 55 - 64 years | 65 years and over |
| Participation in total financial assets (%) | 5.4 | 8.7 | 13.3 | 13.8 | 8.3 |
| Median values of financial assets (€Thousand) | 14.1 | 8.4 | 4 | 10 | 12.9 |
| Distribution of total financial assets (%) | 4.6 | 15.3 | 11.9 | 5.4 | 15.5 |
-
Source: Household Finance and Consumption Survey.
Change in shareholdings across the age-income distribution, January 1 – April 1, 2020 (€000)
| Percentile in the income distribution | ||||||
|---|---|---|---|---|---|---|
| Age group | Less than 20 | 20-39 | 40-59 | 60-79 | 80-100 | Total |
| 30 | 0.000 | -0.004 | -0.003 | -0.006 | -0.011 | -0.005 |
| 40 | -0.002 | -0.036 | -0.032 | -0.063 | -0.117 | -0.055 |
| 50 | -0.003 | -0.047 | -0.041 | -0.082 | -0.151 | -0.072 |
| 60 | -0.012 | -0.194 | -0.168 | -0.336 | -0.623 | -0.246 |
| 70 | -0.058 | -0.902 | -0.783 | -1.563 | -2.901 | -0.698 |
| Total | -0.025 | -0.248 | -0.134 | -0.197 | -0.328 | -0.183 |
-
Note: a similar approach was applied to later periods.
Average income by income definition over the course of the crisis per month during the time point considered, in Euros
| Before Crisis | May 5th | June 6th | August 28th | November 13th | December 22nd | January 26th | |
|---|---|---|---|---|---|---|---|
| Market Income | 2362 | 1600 | 1675 | 1931 | 1810 | 1791 | 1817 |
| Disposable Income | 2150 | 1945 | 1957 | 2020 | 2005 | 2003 | 2000 |
| Adjusted disposable Income | 1861 | 1798 | 1810 | 1868 | 1853 | 1853 | 1853 |
-
Source: Authors’ calculations. The estimates refer to corresponding points in time.
Gini coefficient before and during crisis
| Market Income | Gross Income | Disposable Income | Adjusted disposable income | |
|---|---|---|---|---|
| Gini | ||||
| Before Crisis | 0.490 | 0.363 | 0.290 | 0.308 |
| May 5th | 0.609 | 0.349 | 0.276 | 0.290 |
| June 6th | 0.594 | 0.354 | 0.279 | 0.294 |
| August 28th | 0.548 | 0.361 | 0.291 | 0.304 |
| November 15th | 0.572 | 0.356 | 0.282 | 0.296 |
| December 22nd | 0.582 | 0.362 | 0.287 | 0.301 |
| January 26th | 0.578 | 0.361 | 0.287 | 0.301 |
| Change | ||||
| May 5th | 0.119 | -0.015 | -0.015 | -0.019 |
| June 6th | 0.104 | -0.009 | -0.011 | -0.014 |
| August 28th | 0.058 | -0.002 | 0.001 | -0.004 |
| November 15th | 0.082 | -0.007 | -0.009 | -0.012 |
| December 22nd | 0.092 | -0.001 | -0.003 | -0.007 |
| January 26th | 0.088 | -0.002 | -0.004 | -0.008 |
-
Note: The Modified OECD Equivalence Scale is used. The estimates refer to the corresponding points in time.
Redistribution before and during crisis
| Period | Benefits | Taxes | Work Expenses and Housing Costs |
|---|---|---|---|
| Before Crisis | -0.127 | -0.073 | 0.018 |
| May 5th | -0.260 | -0.073 | 0.014 |
| June 6th | -0.240 | -0.075 | 0.016 |
| August 28th | -0.187 | -0.070 | 0.014 |
| November 15th | -0.216 | -0.074 | 0.014 |
| December 22nd | -0.220 | -0.075 | 0.014 |
| January 26th | -0.217 | -0.074 | 0.014 |
Probability of using public transport or private transport
| Public Transport | Private Transport | Not Public Transport | |||||
|---|---|---|---|---|---|---|
| coef | S.E. | p-value | coef | S.E. | p-value | |
| Manufacturing industries, mining, quarrying and turf production, electricity, gas and water supply | 0.692 | 0.073 | 0.000 | 0.677 | 0.022 | 0.000 |
| Construction | 0.362 | 0.076 | 0.000 | 1.214 | 0.024 | 0.000 |
| Commerce | 1.314 | 0.072 | 0.000 | 0.145 | 0.021 | 0.000 |
| Transport Storage Communications | 2.179 | 0.072 | 0.000 | 0.138 | 0.021 | 0.000 |
| Public administration and defence | 1.719 | 0.073 | 0.000 | 0.846 | 0.023 | 0.000 |
| Education, health and social work | 1.167 | 0.073 | 0.000 | 0.532 | 0.021 | 0.000 |
| Other | 1.424 | 0.073 | 0.000 | 0.043 | 0.022 | 0.055 |
| Border Midland and Wester Region | -1.457 | 0.011 | 0.000 | 0.257 | 0.005 | 0.000 |
| Occupation 1 | 0.148 | 0.013 | 0.000 | 0.697 | 0.008 | 0.000 |
| Occupation 2 | 0.098 | 0.015 | 0.000 | 0.412 | 0.010 | 0.000 |
| Occupation 3 | 0.044 | 0.014 | 0.002 | 0.559 | 0.009 | 0.000 |
| Occupation 4 | 0.402 | 0.012 | 0.000 | 0.287 | 0.007 | 0.000 |
| Occupation 5 | -1.643 | 0.099 | 0.000 | -1.369 | 0.023 | 0.000 |
| Occupation 6 | -0.918 | 0.104 | 0.000 | 0.156 | 0.028 | 0.000 |
| Occupation 7 | -0.342 | 0.018 | 0.000 | 0.926 | 0.010 | 0.000 |
| Occupation 8 | 0.040 | 0.015 | 0.009 | 0.259 | 0.009 | 0.000 |
| Aged 20-24 | -0.439 | 0.028 | 0.000 | 0.802 | 0.022 | 0.000 |
| Aged 25-29 | -0.705 | 0.027 | 0.000 | 1.136 | 0.022 | 0.000 |
| Aged 30-34 | -0.906 | 0.027 | 0.000 | 1.467 | 0.022 | 0.000 |
| Aged 35-39 | -1.147 | 0.027 | 0.000 | 1.662 | 0.022 | 0.000 |
| Aged 40-44 | -1.322 | 0.028 | 0.000 | 1.677 | 0.022 | 0.000 |
| Aged 45-49 | -1.377 | 0.028 | 0.000 | 1.613 | 0.022 | 0.000 |
| Aged 50-54 | -1.334 | 0.028 | 0.000 | 1.489 | 0.022 | 0.000 |
| Aged 55-59 | -1.289 | 0.029 | 0.000 | 1.363 | 0.022 | 0.000 |
| Aged 60-64 | -1.287 | 0.031 | 0.000 | 1.172 | 0.023 | 0.000 |
| Aged 65-69 | -1.350 | 0.041 | 0.000 | 0.816 | 0.026 | 0.000 |
| Aged 70-74 | -1.471 | 0.066 | 0.000 | 0.431 | 0.033 | 0.000 |
| Aged 75+ | -1.606 | 0.091 | 0.000 | -0.035 | 0.039 | 0.360 |
| University Education | 0.242 | 0.007 | 0.000 | 0.016 | 0.005 | 0.002 |
| Constant | -2.839 | 0.077 | 0.000 | -0.988 | 0.030 | 0.000 |
| Pseudo R2 | 0.109 | 0.089 | ||||
| Number of Obs | 1682588 | 1682588 | ||||
-
Note: Calculated on the basis of Census of Population Data.
Regression models for having child care (Logit) and level of childcare expenditure
| Coef. | Std. Err. | P>z | Coef. | Std. Err. | P>z | |
|---|---|---|---|---|---|---|
| Has Child Care | Child Care Expenditure | |||||
| Number of Children Aged 0 -4 | 0.833 | 0.073 | 0.000 | 28.0 | 4.8 | 0 |
| Number of Children | -0.018 | 0.057 | 0.750 | 0.0 | 4.0 | 0.992 |
| Disposable Income (Equivalised) | 0.003 | 0.000 | 0.000 | 0.1 | 0.0 | 0 |
| Disposable Income (Equivalised) Squared | 0.000 | 0.000 | 0.000 | |||
| Number of Workers = 2 | Lone Parent Working | 1.224 | 0.129 | 0.000 | 54.0 | 9.6 | 0 |
| Constant | -3.584 | 0.246 | 0.000 | -15.5 | 13.1 | 0.238 |
| R2 | 0.1437 | |||||
| Pseudo R2 | 0.1836 | |||||
| Observations | 1,937 | 719 | ||||
-
Note: Calculated on the basis of Household Budget Survey 2015-2016.
Age-income distribution of shareholdings proportion, 2018
| Percentile in the income distribution | ||||||
|---|---|---|---|---|---|---|
| Age group | Less than 20 | 20-39 | 40-59 | 60-79 | 80-100 | Total |
| 30 | 0.012643 | 0.013099 | 0.039393 | 0.056208 | 0.12114 | 0.054 |
| 40 | 0.020834 | 0.021585 | 0.064915 | 0.092623 | 0.199625 | 0.087 |
| 50 | 0.030946 | 0.032062 | 0.096424 | 0.137582 | 0.296521 | 0.133 |
| 60 | 0.037694 | 0.039053 | 0.117449 | 0.167581 | 0.361176 | 0.138 |
| 70 | 0.037777 | 0.039139 | 0.117707 | 0.16795 | 0.36197 | 0.083 |
| Total | 0.029736 | 0.027031 | 0.074783 | 0.101811 | 0.223442 | 0.09066 |
-
Source: Household Finance and Consumption Survey, with Iterative Proportional Fitting
Age-income distribution of shareholdings €000, 2018
| Percentile in the income distribution | ||||||
|---|---|---|---|---|---|---|
| Age group | Less than 20 | 20-39 | 40-59 | 60-79 | 80-100 | Total |
| 30 | 0.001 | 0.010 | 0.009 | 0.018 | 0.033 | 0.016 |
| 40 | 0.007 | 0.103 | 0.090 | 0.179 | 0.332 | 0.156 |
| 50 | 0.009 | 0.133 | 0.116 | 0.231 | 0.428 | 0.205 |
| 60 | 0.035 | 0.548 | 0.476 | 0.950 | 1.763 | 0.698 |
| 70 | 0.164 | 2.554 | 2.217 | 4.427 | 8.214 | 1.976 |
| Total | 0.069 | 0.703 | 0.379 | 0.558 | 0.930 | 0.518 |
-
Source: Household Finance and Consumption Survey, with Iterative Proportional Fitting
Distributional characteristics of income before and during crisis (€ per month per adult equivalent)
| Before Crisis | May 5th | June 6th | August 28th | |||||||||||||
| Decile | Market Income | Gross Income | Disposable Income | Disposable Income* | Market Income | Gross Income | Disposable Income | Disposable Income* | Market Income | Gross Income | Disposable Income | Disposable Income* | Market Income | Gross Income | Disposable Income | Disposable Income* |
| 1 | 504.0 | 960.3 | 878.6 | 522.2 | 306.5 | 1021.6 | 933.1 | 694.7 | 281.5 | 949.0 | 871.8 | 631.1 | 517.6 | 1135.2 | 1012.6 | 765.1 |
| 2 | 501.6 | 1294.6 | 1132.5 | 957.7 | 296.4 | 1299.7 | 1142.6 | 1043.8 | 316.7 | 1279.4 | 1124.9 | 1023.5 | 453.5 | 1360.5 | 1188.2 | 1081.8 |
| 3 | 746.0 | 1518.1 | 1315.7 | 1121.9 | 436.6 | 1480.5 | 1289.7 | 1179.8 | 477.1 | 1468.9 | 1278.1 | 1171.1 | 708.4 | 1630.9 | 1376.4 | 1260.7 |
| 4 | 1087.8 | 1765.3 | 1498.0 | 1278.3 | 706.7 | 1707.1 | 1455.7 | 1341.9 | 730.5 | 1704.4 | 1455.7 | 1339.2 | 839.0 | 1786.5 | 1524.5 | 1405.4 |
| 5 | 1398.3 | 2005.1 | 1665.3 | 1434.7 | 810.8 | 1842.5 | 1563.3 | 1471.1 | 912.7 | 1898.3 | 1590.0 | 1480.8 | 1196.8 | 1988.1 | 1636.2 | 1531.8 |
| 6 | 1959.9 | 2579.5 | 2020.2 | 1757.4 | 1258.4 | 2326.3 | 1861.1 | 1755.0 | 1272.9 | 2360.1 | 1880.4 | 1769.5 | 1689.9 | 2507.1 | 1972.0 | 1844.2 |
| 7 | 2361.9 | 2847.5 | 2203.0 | 1907.2 | 1613.6 | 2582.7 | 2028.6 | 1869.7 | 1642.3 | 2604.7 | 2044.0 | 1889.5 | 1966.8 | 2648.9 | 2046.3 | 1887.3 |
| 8 | 3053.2 | 3542.6 | 2680.3 | 2326.0 | 1946.1 | 3053.2 | 2354.0 | 2204.8 | 2139.6 | 3123.1 | 2400.6 | 2260.8 | 2377.3 | 3146.4 | 2423.9 | 2263.1 |
| 9 | 3859.7 | 4270.8 | 3083.2 | 2740.6 | 2740.6 | 3677.0 | 2694.9 | 2535.1 | 2694.9 | 3631.3 | 2672.1 | 2535.1 | 3106.0 | 3814.0 | 2786.3 | 2603.6 |
| 10 | 7350.1 | 7620.7 | 4599.5 | 4193.6 | 5298.4 | 6087.5 | 3787.8 | 3584.9 | 5659.1 | 6403.2 | 3900.5 | 3697.6 | 5817.0 | 6335.5 | 3923.1 | 3720.1 |
| Total | 2362.0 | 2916.3 | 2149.9 | 1860.7 | 1600.4 | 2554.8 | 1945.0 | 1798.0 | 1675.1 | 2603.0 | 1957.1 | 1810.0 | 1930.6 | 2699.4 | 2019.7 | 1867.9 |
| November 13th | December 22nd | January 26th | ||||||||||||||
| Decile | Market Income | Gross Income | Disposable Income | Disposable Income* | Market Income | Gross Income | Disposable Income | Disposable Income* | Market Income | Gross Income | Disposable Income | Disposable Income* | ||||
| 1 | 342.8 | 962.6 | 880.9 | 635.7 | 295.1 | 933.1 | 862.7 | 624.3 | 347.4 | 958.1 | 878.6 | 635.7 | ||||
| 2 | 352.2 | 1289.6 | 1132.5 | 1031.1 | 334.4 | 1287.0 | 1129.9 | 1028.6 | 334.4 | 1289.6 | 1135.0 | 1031.1 | ||||
| 3 | 500.2 | 1463.2 | 1278.1 | 1171.1 | 508.9 | 1492.1 | 1295.4 | 1176.9 | 523.4 | 1477.6 | 1286.8 | 1168.2 | ||||
| 4 | 778.1 | 1725.6 | 1471.5 | 1352.4 | 719.9 | 1683.3 | 1442.4 | 1333.9 | 738.4 | 1696.5 | 1453.0 | 1341.9 | ||||
| 5 | 954.0 | 1903.2 | 1597.3 | 1488.1 | 990.4 | 1903.2 | 1590.0 | 1483.2 | 944.3 | 1869.2 | 1570.6 | 1468.7 | ||||
| 6 | 1432.0 | 2434.8 | 1918.9 | 1796.0 | 1374.1 | 2381.8 | 1890.0 | 1779.1 | 1403.0 | 2393.8 | 1897.2 | 1781.5 | ||||
| 7 | 1816.7 | 2670.9 | 2086.0 | 1929.3 | 1726.2 | 2648.9 | 2072.7 | 1918.2 | 1796.8 | 2648.9 | 2066.1 | 1909.4 | ||||
| 8 | 2302.7 | 3262.9 | 2493.8 | 2330.7 | 2232.8 | 3216.3 | 2470.5 | 2312.0 | 2319.0 | 3239.6 | 2470.5 | 2316.7 | ||||
| 9 | 3106.0 | 3905.4 | 2854.8 | 2694.9 | 2946.1 | 3836.8 | 2809.1 | 2626.4 | 2969.0 | 3791.2 | 2786.3 | 2626.4 | ||||
| 10 | 5862.0 | 6515.9 | 3990.7 | 3787.8 | 6132.6 | 6763.9 | 4126.0 | 3923.1 | 6132.6 | 6718.8 | 4103.4 | 3900.5 | ||||
| Total | 1810.0 | 2675.3 | 2005.3 | 1853.4 | 1790.8 | 2675.3 | 2002.9 | 1853.4 | 1817.3 | 2675.3 | 2000.4 | 1853.4 | ||||
-
Note: Disposable income* stands for household equivalized disposable income adjusted for housing, work related expenses and capital losses.
Data and code availability
The analysis is based on EU-SILC data which can only be accessed by submitting a EUROSTAT application. The access to the code is subject to authors' approval. Those interested should contact the authors directly.