Sima – an Open-source Simulation Framework for Realistic Large-scale Individual-level Data Generation
- Department of Mathematics and Statistics, University of Jyvaskyla, Finland
- Faculty of Information Technology, Finland
Cite this article
as: S. Tikka, J. Hakanen, M. Saarela, J. Karvanen; 2021; Sima – an Open-source Simulation Framework for Realistic Large-scale Individual-level Data Generation; International Journal of Microsimulation; 14(3); 27-53.
doi: 10.34196/ijm.00240
Figures
Figure 1

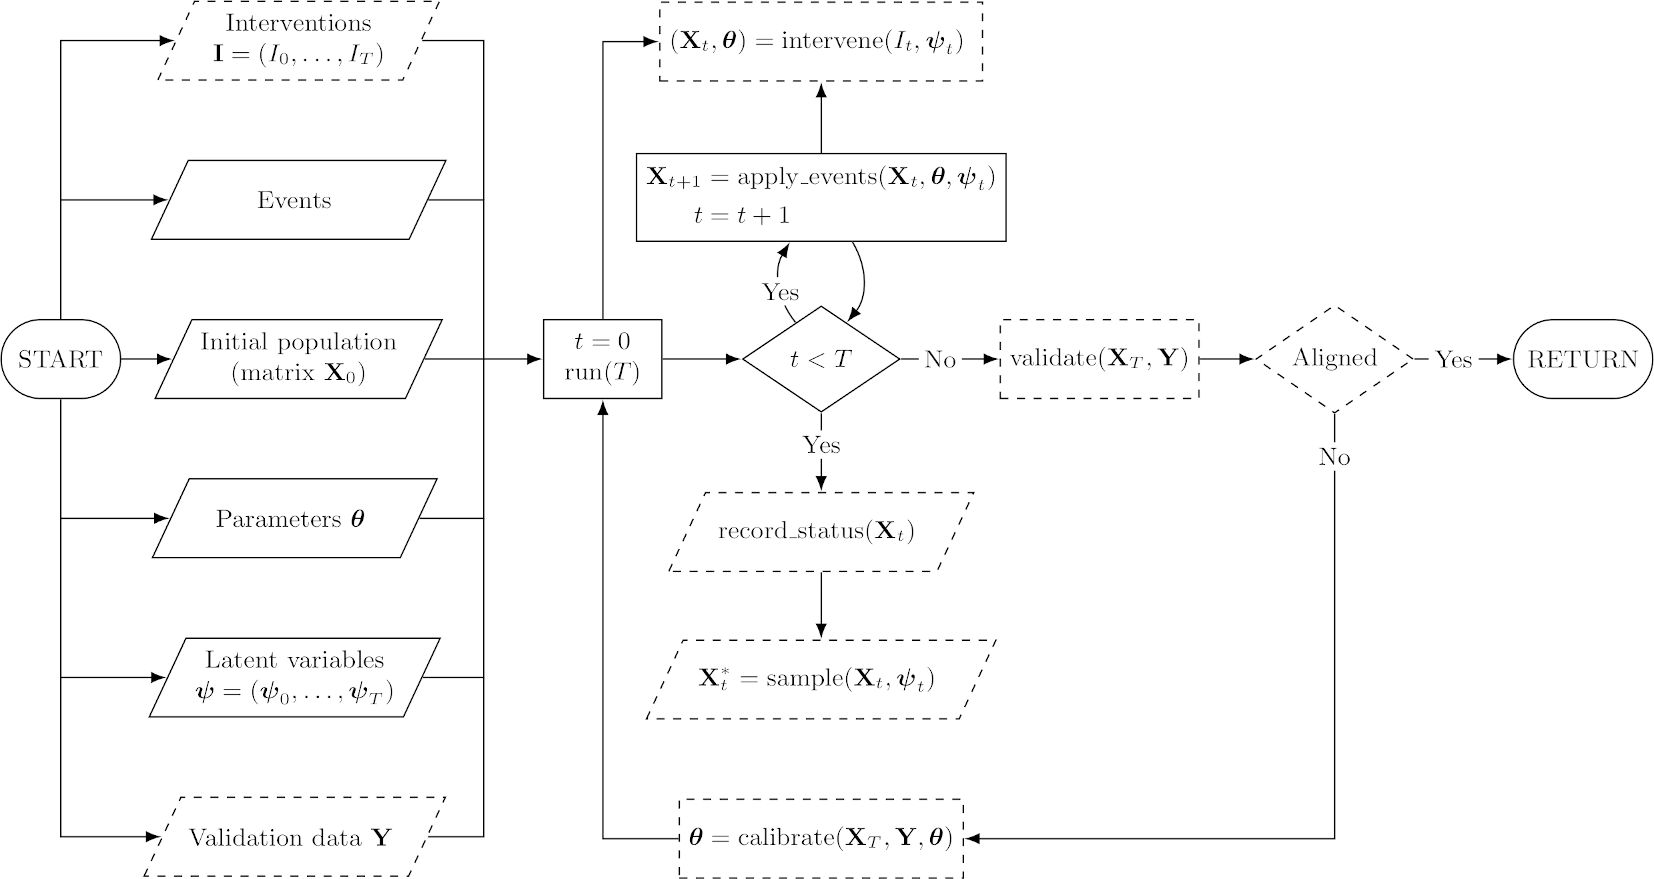
Flowchart of a simulator constructed within the Sima framework. Slanted nodes are inputs and outputs, rectangular nodes are processes, and diamond nodes are decisions. Dashed nodes depict optional components. At the “RETURN” node, we return all generated outputs, meaning the final status of the population and any samples or entire records of the status that may have been collected during the simulation. The node including “calibrate” should be understood as a procedure that provides a new values for the simulator parameters based on the results of current run and the validation data.
Figure 2

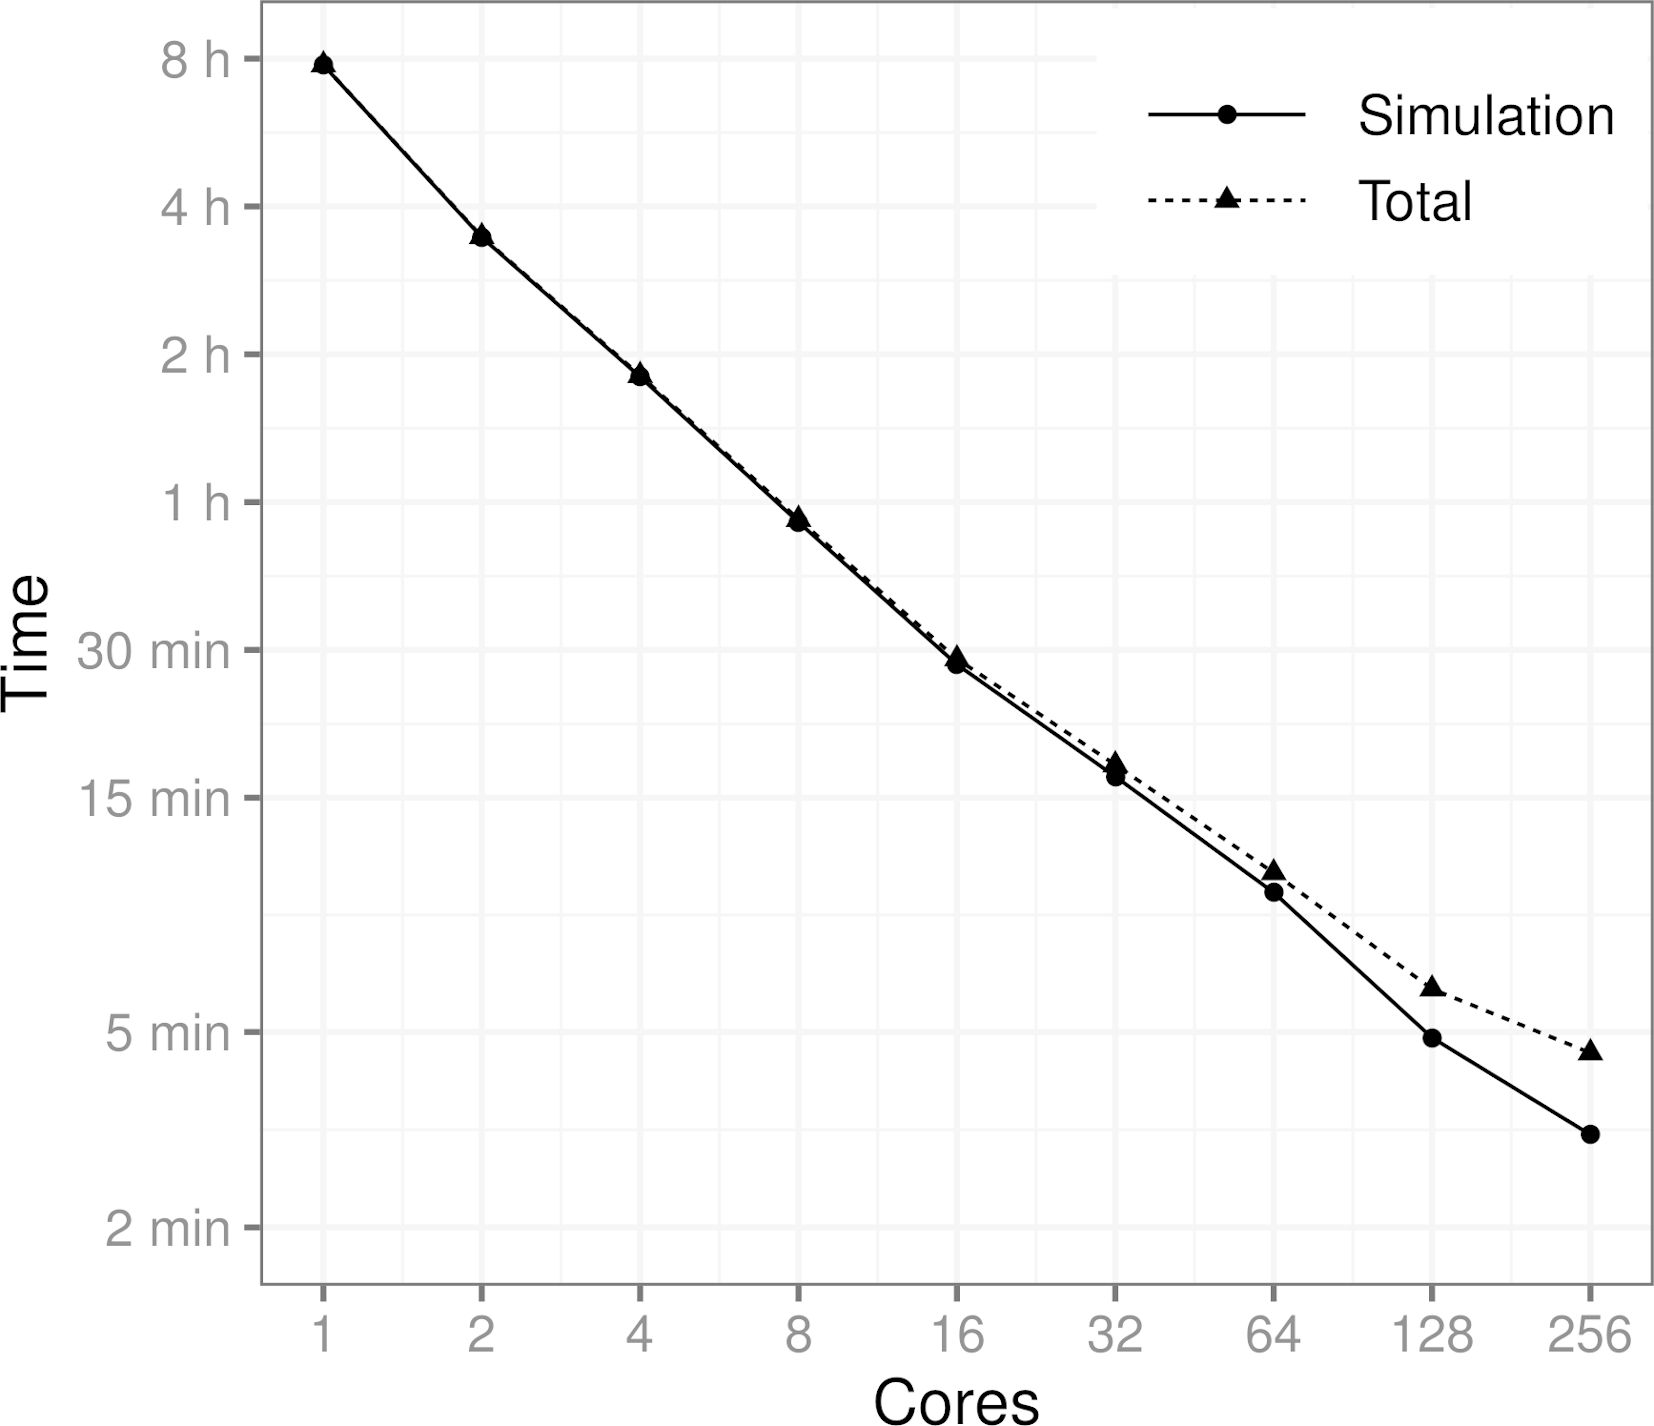
Performance benchmark using a population of 10 million individuals, 5 events and a simulation period of 10 years on a time scale of one day. Total time also includes the time it takes to generate the initial population, initialize the parallel computation cluster and to distribute the data to the cores. MPI was used to conduct the benchmark.
Figure 3

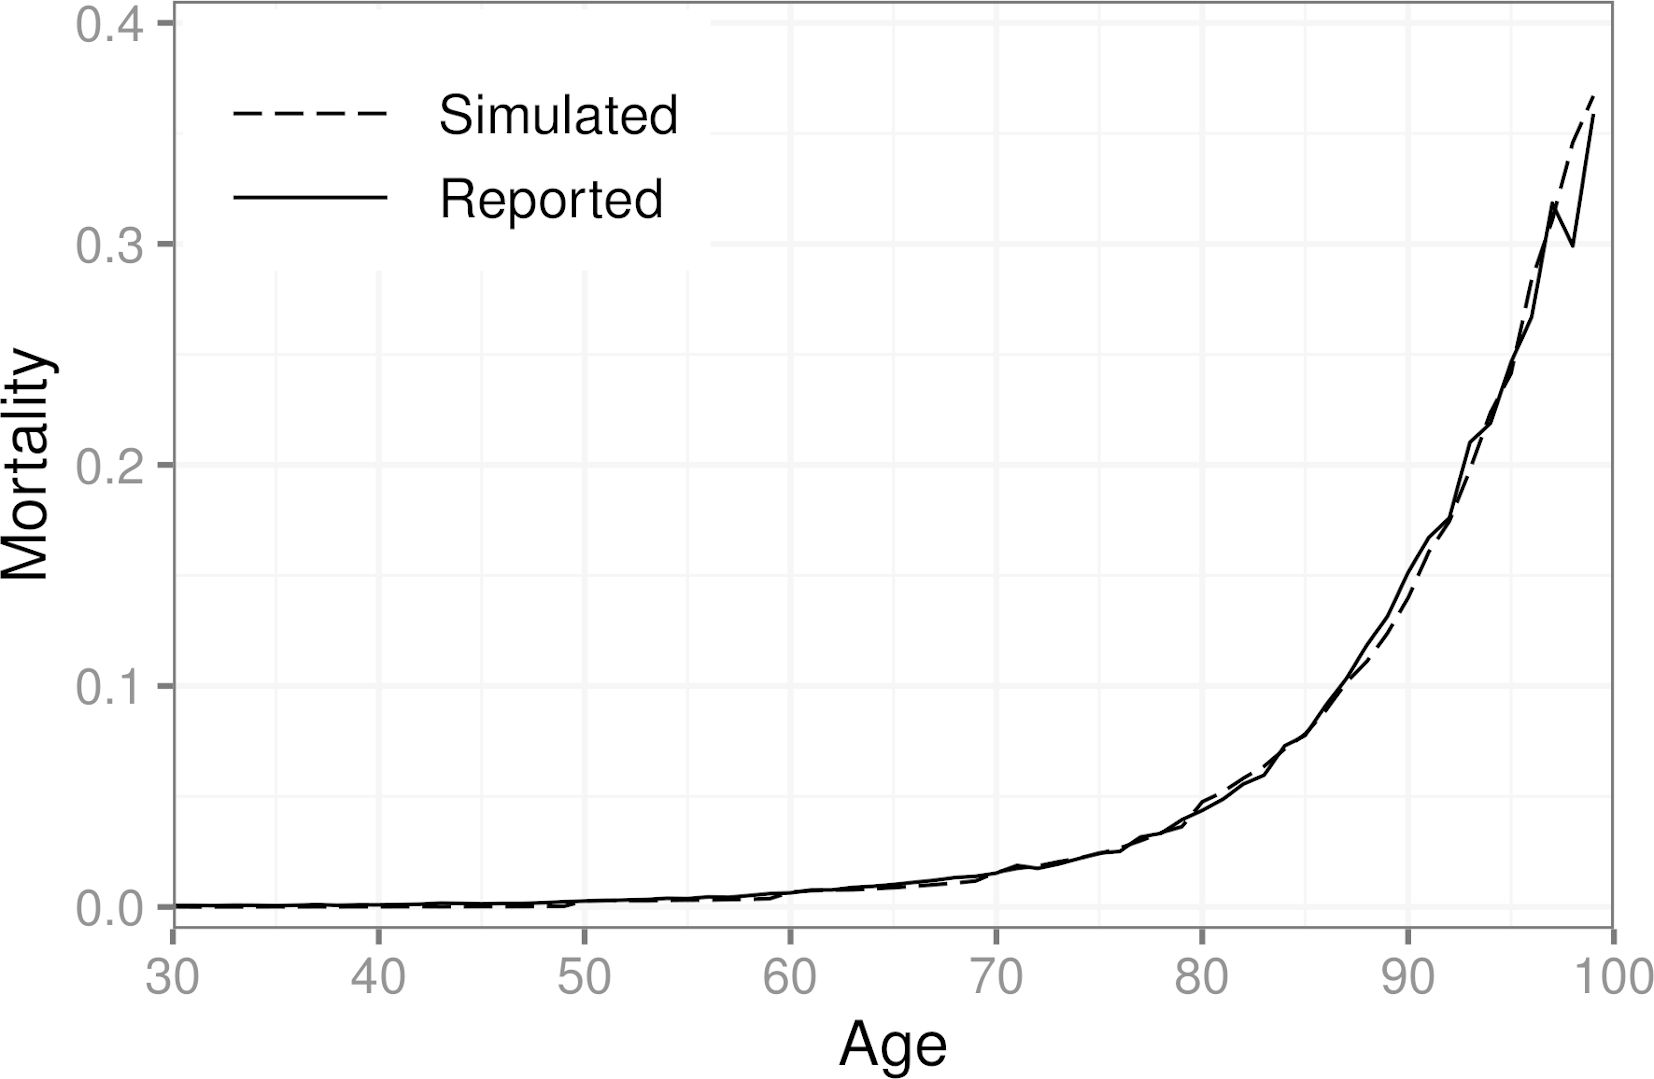
Simulated mortality in a population of 3.6 million individuals after calibration and official mortality statistics of Finland for the year 2017 by age. A population of one million individuals was used for the calibration.
Figure 4

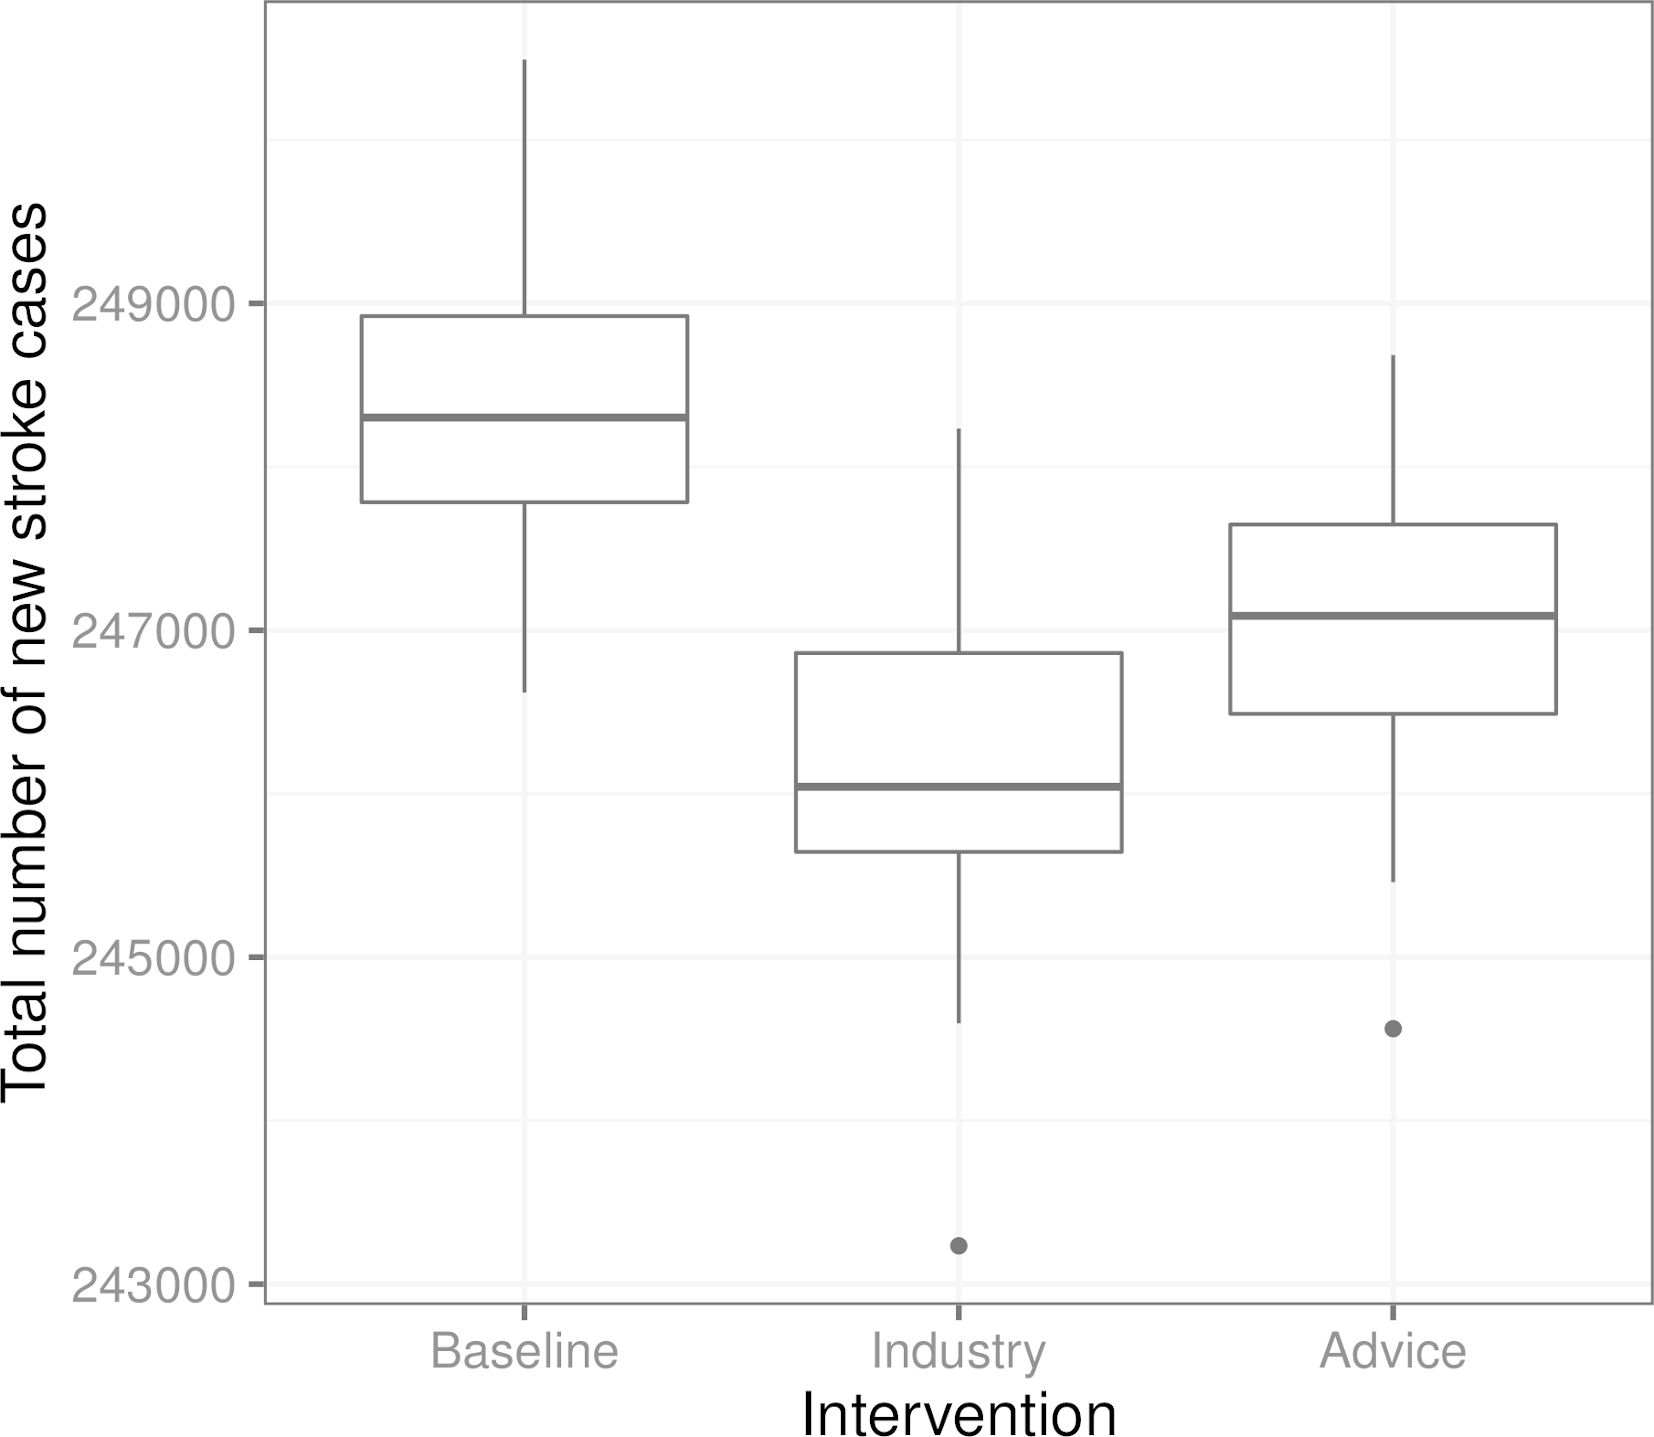
Boxplots of the total number of new stroke cases in the three scenarios from 100 replications of each scenario (from the same initial population in each scenario and replication). “Baseline” is the scenario without interventions, “Industry” corresponds to the salt content reduction carried out by the food industry, and “Advice” is the recommendation regarding salt use targeted towards individuals with high blood pressure.
Figure C1

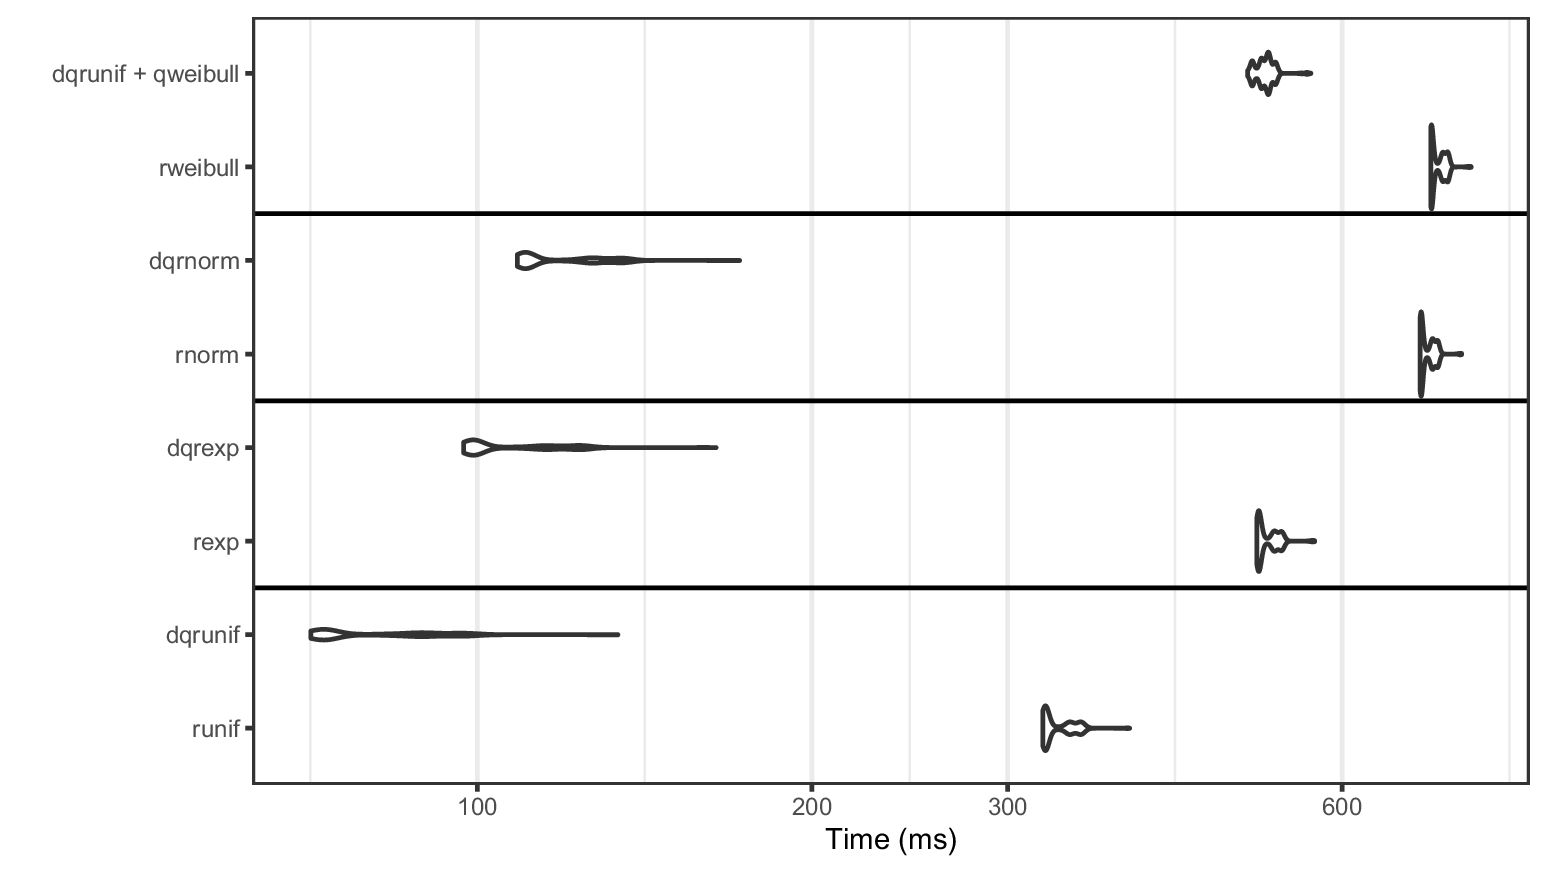
Density plots of time taken (in milliseconds) for 10 million random draws over 1000 replications for the Xoroshiro128+ PRNG implementation of dqrng and the 32 bit Mersenne-Twister of base R with Weibull, normal, exponential and uniform distributions. Prefix “dq” denotes the dqrng version of the function. The horizontal axis uses log10-scaling. Weibull-distributed random variables are generated using the inverse method.
Tables
Table 1
Estimated parameter values, odds ratios, and their 95% confidence intervals for the model of baseline nonparticipation.
| Intercept | −9.48 (−10.68, −8.32) | |
| Gender | −0.31 (−0.62, −0.01) | 0.73 (0.54, 0.99) |
| Age | 0.11 (0.10, 0.12) | 1.12 (1.11, 1.13) |
| BMI | −0.09 (−0.15, −0.03) | 0.91 (0.86, 0.97) |
| Smoking | 0.69 (0.44, 0.94) | 1.99 (1.56, 2.56) |
| Waist Circumference | 0.04 (0.02, 0.06) | 1.04 (1.02, 1.06) |
Table 2
Estimated odds ratios and their 95% confidence intervals for the model of 10-year risk of stroke for men.
| A | B | C | FINRISK | |
|---|---|---|---|---|
| Age | 1.11 (1.10, 1.13) | 1.10 (1.10, 1.11) | 1.10 (1.09, 1.10) | 1.12 |
| Smoking | 2.13 (1.52, 2.96) | 1.67 (1.27, 2.19) | 1.53 (1.50, 1.55) | 1.65 |
| Systolic blood pressure | 1.01 (1.00, 1.02) | 1.01 (1.01, 1.02) | 1.02 (1.02, 1.02) | 1.02 |
| HDL cholesterol | 0.73 (0.48, 1.07) | 0.67 (0.49, 0.91) | 0.65 (0.64, 0.66) | 0.64 |
| Diabetes | 2.30 (1.67, 3.13) | 2.38 (1.87, 3.02) | 2.31 (2.28, 2.34) | 2.41 |
| Parents’ stroke | 1.25 (0.83, 1.84) | 1.41 (1.04, 1.89) | 1.33 (1.31, 1.35) | 1.34 |
Table 3
Estimated odds ratios and their 95% confidence intervals for the model of 10-year risk of stroke for women.
| A | B | C | FINRISK | |
|---|---|---|---|---|
| Age | 1.06 (1.05, 1.08) | 1.05 (1.04, 1.06) | 1.05 (1.05, 1.05) | 1.07 |
| Smoking | 1.67 (1.01, 2.66) | 1.62 (1.05, 2.44) | 1.40 (1.37, 1.44) | 1.52 |
| Systolic blood pressure | 1.01 (1.00, 1.01) | 1.01 (1.01, 1.02) | 1.01 (1.01, 1.01) | 1.01 |
| HDL cholesterol | 0.50 (0.32, 0.76) | 0.54 (0.37, 0.78) | 0.45 (0.44, 0.46) | 0.47 |
| Diabetes | 3.70 (2.54, 5.34) | 3.37 (2.43, 4.62) | 3.21 (3.16, 3.27) | 3.45 |
| Parents’ stroke | 2.18 (1.42, 3.27) | 2.02 (1.39, 2.87) | 1.69 (1.65, 1.72) | 1.73 |
Table A1
Selection of related work on using simulation for medical decision making applications. Typically, models are not made open-source and—with the exception of DYNAMIS-POP—developed only for one particular country and decision making problem
| Authors | Simulation Model, Objective | Software, Tools, Open-source Availability |
|---|---|---|
| Eldabi et al. (2000) | Discrete event simulation to simulate economic factors in adjuvant breast cancer treatment in England. | A package called ABCSim was created using the commercial simulation software Simul8. ABCSim is not open-source. |
| Cooper et al. (2002) | Discrete event simulation to model the progress of English patients who have had a coronary event through their treatment pathways and subsequent coronary events. | The simulation was written using the POST (Patient Oriented Simulation Technique) software with a Delphi interface. The developed model is not open-source. |
| Caro et al. (2006) | Discrete event simulation to simulate the course of individuals with acute mania in bipolar I disorder and estimation of the budget impact of treatments for them from a United States healthcare payer perspective. | The model is not open-source and the article does not provide any information on the used software. |
| Ahmad and Billimek (2007) | A 75-year dynamic simulation model comparing the long-term health benefits to society of various levels of tax increase to a viable alternative: limiting youth access to cigarettes by raising the legal purchase age to 21 in the United States. | Vensim (i.e., commercial software) was used to develop a dynamic simulation model for estimating the population health outcomes resulting from raising taxes on cigarettes and raising the legal smoking age to 21. The developed model is not open-source. |
| Huang et al. (2007) | A Monte Carlo simulation model to estimate the cost-effectiveness of improving diabetes care in federally qualified community health centers in the United States. | Microsoft Excel 2000 and @Risk 4.5.4 for Windows were used to conduct the simulations and an older diabetes complications model (Eastman et al., 1997) was adapted. The model is not open-source but the inputs are described in the article. |
| Zur and Zaric (2016) | Microsimulation model of alcohol consumption and its effects on alcohol-related causes of death in the Canadian population. Estimation of the cost-effectiveness of implementing universal alcohol screening and brief intervention in primary care in Canada. | The model was programmed and run in C and the results analyzed in R version 3.1.2. The programmed model is not open-source. |
| Larsson et al. (2018) | Individual-based microsimulation model to project economic consequences of resistance to antibacterial drugs for the Swedish health care sector. | A dynamic microsimulation model developed by the Swedish Ministry of Finance called SESIM was used. Currently (May 2021), it is not possible to download SESIM. |
| Prakash et al. (2017); Sai et al. (2019) | CMOST is a microsimulation model for modeling the natural history of colorectal cancer, simulating the effects of colorectal cancer screening interventions, and calculating the resulting costs. | CMOST (Colon Modeling Open Simulation Tool) was implemented in Matlab and is freely available under the GNU General Public License at https://gitlab.com/misselwb/CMOST. |
| Kuchenbecker et al. (2018) | The authors adapted an existing microsimulation US model (Weycker et al., 2012) to depict lifetime risks and costs of invasive pneumococcal diseases and nonbacteremic pneumonia, as well as the expected impact of different vaccination schemes, in a hypothetical population of German adults. | No link to a documentation of the model or open-source framework can be found in the articles (Weycker et al., 2012; Kuchenbecker et al., 2018). |
| Spielauer and Dupriez (2019) | DYNAMIS-POP is a dynamic micro-simulation model for population and education projections, health applications, and for the simulation of policies. Adaptation of the model to a specific country only requires adapting a single setup script and simulation module. | All components of DYNAMIS-POP including its code and all statistical analysis files are freely available and documented online at http://dynamis.ihsn.org/. Most statistical analysis scripts and scripts for post-processing and visualization of the results are implemented in R. |
| Hennessy et al. (2015); Manuel et al. (2014); Manuel et al. (2016); Wolfson (1994) | POHEM (POpulation HEalth Model) is a longitudinal microsimulation model of health and disease. The model simulates representative populations and allows the rational comparison of competing health intervention alternatives, in a framework that captures the effects of disease interactions. | POHEM was developed in Modgen (see Table A2). However, the POHEM model implementation itself is not open-source (and so far still limited to Canada, i.e., one country). https://www.statcan.gc.ca/eng/microsimulation/modgen/new/mods/pohem. |
Table A2
Related work on open-source frameworks for microsimulation models
| Authors | Simulation Model/ Objective | Link / Open-source Availability |
|---|---|---|
| De Menten et al. (2014) | LIAM2 is an open-source development tool for discrete-time dynamic microsimulation models. The framework is for general purposes (not specifically health related). It allows for the simulation of discrete-time dynamic models with a cross-sectional time step of whatever kind of objects the modeler chooses. It provides functionalities to calibrate to exogenous information of any number of dimensions. | LIAM2 was developed primarily in Python, it can be downloaded from http://liam2.plan.be. It is licensed under the GNU General Public License, meaning one can freely use, copy, modify and redistribute the software. |
| Mannion et al. (2012) | JAMSIM (JAva MicroSIMulation) is a synthesis of open-source packages that provides an environment and set of features for the creation of dynamic discrete-time microsimulation models that are to be executed, manipulated and interrogated by nontechnical, policy-oriented users. | JAMSIM is freely available as an open-source tool, for public reuse and modification at http://code.google.com/p/jamsim/. It combines R and the Java-based agent-based modeling graphical tool Ascape. |
| Richiardi and Richardson (2017) | JAS-mine is a Java-based computational platform that features tools for discrete-event simulations encompassing both dynamic microsimulation and agent-based modeling. Object-relational mapping is used to embed a relational database management system. It is a general-purpose platform (not specifically health related). | JAS-mine is freely available as an open-source tool, for public reuse and modification at https://github.com/jasmineRepo/JAS-mine-core. It is written in Java. |
| Kosar and Tomintz (2014); Tomintz et al. (2017) | simSALUD is a deterministic spatial microsimulation framework. Its main aim is to model health related issues for small areas using spatial microsimulation modeling to simulate information where no data exists or is accessible. | simSALUD is an open-source web-application, programmed using Java and based on Apache’s model-view-controller application Struts2. It can be accessed at http://www.simsalud.org/simulation/. |
| Clements et al. (2021) | microsimulation package for R provides implementations of discrete event simulations in both R and C++. The R implementation builds on several R5 classes (useful from a pedagogical perspective, but slow for larger microsimulations). For speed, the authors provide C++ classes. | The package is freely available at https://github.com/mclements/microsimulation. |
| Developed by Statistics Canada; used, for example, in Spielauer and Dupriez (2019) | Modgen and its open-source implementation openM++ are generic microsimulation software supporting the creation, maintenance and documentation of dynamic microsimulation models. Several types of models can be accommodated, be they continuous or discrete time, with interacting or noninteracting populations. Compared to its closed source predecessor Modgen, openM++ has many advantages like portability, scalability and open source. | openM++ is freely available at https://github.com/openmpp. |
Data and code availability
Sima source code, code for the examples, and data used for simulations are available via the Sima GitHub repository https://github.com/santikka/Sima and the package website https://santikka.github.io/Sima/. Please contact the authors for further information.
Download links
A two-part list of links to download the article, or parts of the article, in various formats.