Collecting Data for Micro Analysis: Experiences from the Hus-pilot Study
- Department of Economics, Sweden
1. The HUS-project: An introduction
The HUS-project was started with the ambition to analyse and understand household resource allocation and resource accumulation (The original research program is found in Eliasson and Klevmarken, 1981). As illustrated in Figure 1, a household has resources in form of human capital, wealth and time.
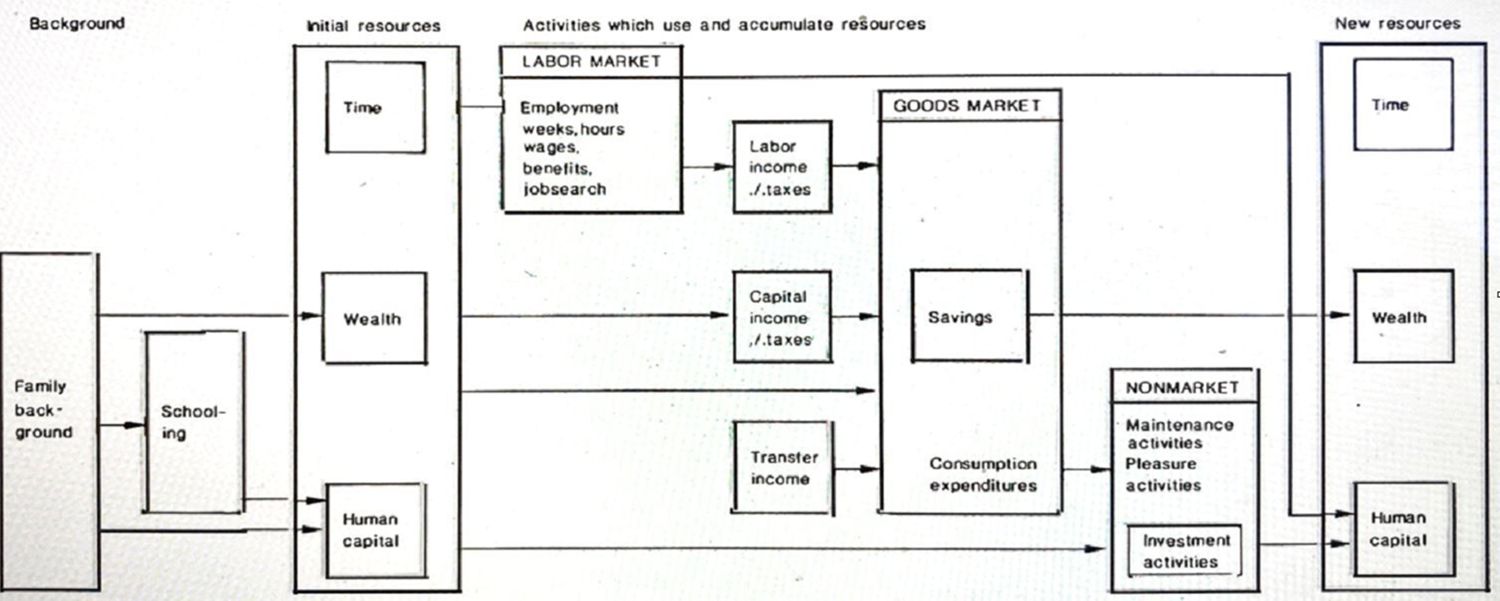
Use and accumulation of household resources in market and nonmarket activities.
They are used:
in the labor market to earn money incomes and to invest in human capital (experience),
in the commodity markets to purchase commodities,
in the financial markets to accumulate wealth,
during leisure time to acquire direct utility and to invest in human capital,
and also to obtain services from the public sector which are not sold in markets.
All these aspects of household behavior are more or less interrelated. To study and understand household behavior one has to take this into account. For instance, demand for goods and services do not only depend on incomes and prices, but also on the number of household members who have a market job, what kind of job they have, and also how they spend their leisure time. The amount of leisure time depends on each household member’s job, the household composition, their stock of durables, etc. Labor supply depends primarily on the choice between leisure and income for consumption, but also on the market work of other household members, on the supply of daycare services for children, etc.
Since it would be difficult to follow a research strategy which includes all these aspects of household behaviour in one single project, the HUS-project is organized in a number of coordinated subprojects, each of which is located in one of the participating institutes. These are the University of Gothenburg, the Industrial Institute for Economic and Social Research (IUI), the Stockholm School for Econo mics, and the University of Stockholm. Each subproject concentrates on one or a few aspects such as household labor supply, leisure time-use, demand for consumer goods, demand for public services and household savings, but has the ambition to test and include ties to other aspects of behavior. A future goal is to collect the result obtained from these subprojects for a micro simulation model for the Swedish household sector.
To understand the degree of interaction between consumption activities, maintenance activities, leisure activities, labor market activities, saving- and investment activities a data set is needed which covers all these aspects of behavior. In Sweden, there are cross-sectional surveys which give a partial coverage, like consumer expenditures, savings, and labor force surveys, but there is no single data source which includes all or most aspects of the economic behavior of households we would like to study in the HUS-project.
In micro simulation studies, it is common to pool data from various sources to get estimates of each submodel. In our case, however, multivariate analysis would probably meet with difficulties unless interdependent aspects of household behavior are observed in one single sample. On the other hand, it is easy to criticize the ambition to collect so much information from each household. Even if the degree of detail will become much less than in traditional expenditure, savings and labor force surveys we will most likely face severe nonresponse and missing data problems.
Our plan is to supplement existing register data with new survey data. But even if there are good register data, primarily from self-assessment forms and other government files, the response burden will become heavy for the sample households. Without losing in other aspects of data quality, we would thus like to use data collection methods which do not require too much work on the part of the respondents.
Longitudinal data are needed for any powerful analysis of changes in economic behavior, and it is part of the research program repeatedly to return to the same respondents in order to create a longitudinal data base. Since the first wave of HUS-data have not yet been collected, the design problems particular to the collection of longitudinal data will not be dealt with in detail here. We will rather concentrate on the more immediate problems of the first wave of data.
A pilot study has been done to compare alternative data collection methods and to give us an idea of the likely response pattern. The main theme of this paper is to give a summary of experiences from the pilot study. The immediately following section, however, first offers a few general comments on the need for data in micro simulation and the feasibility of using multiple samples. In view of the non response problem encountered in the pilot study, this theme returns, at the end of the paper, but from a somewhat different angle.
2. Model structure and data need
In the micro simulation approach, the distributional properties of the economic variables are of key importance since these properties usually are our primary interest and not only a set of assumptions made for the convenience of estimation. For this reason, it is natural to write a micro simulation model in distributional form. Assume that we distinguish between endogenous variables, i.e. variables explained by the model, and exogenous or cause variables, which explain the endo genous variables in the sense that they determine their distribution. Both the endogenous and the exogenous variables are stochastic variables, and the class of exogenous variables might include predetermined endogenous variables. In a very general form the model is,
where Y is a vector of endogenous variables, X a vector of exogenous variables, and , and parameter vectors. We thus assume a multivariate distribution fyx and write it as the product of the marginal distribution for the exogenous variables and the conditional distribution for the endogenous variables given the exogenous. The distribution fx is not explained by the model but exogenously given, and it gives us the initial conditions for the simulation. is the economic model which in principle is specified by economic theory apart from the unknown vector of parameters 1. Micro simulation aims at simulating the marginal distribution
or some characteristic of this distribution.
Modeling a big micro model with many variables is a difficult task, and it is usually not practical or feasible to specify fY/X in one step. Usually, we attempt simplifying assumptions which allow us to work with marginal distributions. Assume, for instance, that the vector Y can be partitioned into two independent sub vectors Y1 and Y2, i.e.
where the vectors X1 and X2 are either identical with X or subvectors of X. They may or may not have variables in common. This factorization of the model facilitates estimation and testing. To estimate we only need a sample of (y1,x1)- observations and to estimate we could use a different sample of (y2,x2)-observations. No sample including all endogenous and exogenous variables is thus needed to estimate the model. If X1 and X2 have no variable in common, and if X1 and X2 are stochastically independent, then
It is then possible to simulate each part of the model separately and no sample needs to include all exogenous variables. If, however, X1 and X2 are not independent, the simulation must be done with the full model, although each submodel can be estimated separately.
In order to use the model to compute fY, i.e. without simulation, we would not only have to know , where is an estimate of , but also the distribution of the exogenous variables fx. In general, there is little theory which could be used to specify fx since, by definition, the X-variables are exogenous. The micro simulation approach circumvents this difficulty by simulating the model with a sample from fx. For a sample of, for instance, individuals, households, or firms, the observed x-values are used to simulate the corresponding y-values. If this sample is a random sample from a finite population which, in turn, is considered a random sample from fx, it is possible to use the simulated y-values for inference about fy without any assumptions about fx.
The nature of this inference does not only depend on the economic model but also on the sampling design. The selection probabilities must in general be used to weight the simulated y-values, when they are used to estimate If it is important for the purpose of the study to estimate a particular segment or some characteristics of with high accuracy, this might well motivate a sampling design with varying selection probabilities.
If the sample selection does not depend stochastically on any of the endogenous variables, we can estimate - but in general not simulate Y - as if the sample was obtained by simple random sampling. If we resort to ML-estimation, this result follows from the structure of the likelihood function. The likelihood of a sample of one observation is
where P(slx) is the selection probability given x. Since P and do not depend on
, the likelihood function for a sample of n units will take its maximum for the - value which maximizes
To summarize, in the micro simulation approach, data are needed for two purposes:
to estimate the unknown parameters of the simulation model;
to give initial conditions for the simulation.
Since it is usually very difficult to obtain one single sample with observations on all Y- and X - variables in a big simulation model, data collection is much facilitated if the model structure is such that a few independent samples can be used. We have found that it is always possible to use one sample for estimation and another for the initial conditions. If it is possible to identify independent submodels, the sample collected for estimation purposes could be replaced by two or more, independent samples with less variables.
One of the ultimate goals of the HUS-project is to construct a micro simulation model of the household sector in Sweden. The principal idea behind this project suggests that the household sector factorization has gone too far in most economic studies, i.e. primarily because of data shortage each aspect of household behavior has been analyzed in isolation, while theory rather suggests that consumption activities, maintenance activities, leisure activities, labor market activities, savings and investment activities are all more or less related. We thus proposed the collection of one comprehensive sample which would make it feasible to analyse how strongly the activities of a household are interrelated.
3. The HUS-pilot study
After a first small field test of the HUS questionnaires, a pilot study including interviews with approximately 300 households was started. There were five main purposes of this pilot study, namely, to
compare different methods of collecting expenditure and time-use data,
get estimates of response rates and an idea of what might be important for the response etc.,
test the questionnaires,
develop coding and editing procedures,
train the project staff in the entire survey operation.
Although c, d, and e were of great importance to the HUS-project, our ex periences from these more practical aspects of the study might be of less general interest. This paper thus concentrates on the first two aspects.
3.1. The pilot study design
It was desirable to design the pilot study to equal an anticipated main study as closely as possible. Because of time and budget constraints there were, however, several deviations. At first, a main study would cover an entire year, while the field work for the pilot study only lasted from April 16 through May 18, 1982.
Secondly, a main study would be based on a random sample from the entire Swedish population. For budget reasons the pretest was limited to three counties in Western Sweden (Göteborgs- och Bohus län, Älvsborgs län and Värmlands län). The choice of these particular counties gave us a reasonable mixture of rural and urban areas including one big city, Gothenburg. Although the expenditure patterns, the labor market situation and, in particular, the time-use patterns might not be the same in all parts of Sweden, we have not found any reasons why the differential response to various collection methods would be different in the three chosen counties as compared to the rest of the country.
Our cooperation with Statistics Sweden (SCB) opened up a possibility to merge our survey data with the abundant data from a panel study of household incomes, the HINK study. Every year, the SCB draws a fresh panel of approximately 5000 individuals. For all members of the households to which these individuals belong detailed information about incomes, transfer payments, deductions etc. are collected from tax records and other files for two consecutive years. For the third and following years, only information available through the computer system of various central authorities is added to the panel.
The 1979 HINK panel was used as a sampling frame for the pilot study. This panel was in itself obtained by a stratified random sample of persons, 18 years of age and older, from the entire Swedish population (RTB) not living in institutions as of July 1979. Those who belonged to the 1979 HINK population and lived in any of the three chosen counties at the time of our field work thus belonged to our population. Consequently, our population did not exactly correspond to the population of persons (households) living in the three counties at the time of the pretest. Since inference to this finite population is not our major goal, this was not considered a great disadvantage.
For many types of analysis, the preferred unit of analysis is not the individual but rather the household. Since there is no sampling frame of households or dwellings, we had to identify the household through the randomly selected person.
The household definition included everyone who lived in the same dwelling and who regularly had meals together. Family members, who temporarily lived somewhere else and were expected to return, were also included.
In our case, it is essential to get good data about schooling, labor market history and time-use from both spouses, since the dependence and interaction between the spouses belong to our major interests. In a main study, these question would have to be asked to each spouse. In the pilot study, we decided to give time-use questions to both spouses (whether married or not), while we had to save interview time by not giving all remaining individual questions to all spouses.
In households with three or more adults, we would not only like to interview the two spouses but also other adults, since they can be expected to behave differently. It was, however, not feasible to spend that much interviewing time on each household. Instead it was decided that the randomly selected person (our primary selection unit) would always be interviewed, whether or not he or she was the household head, married or living together with the head or a third person. In this way, we could hope to get some information about "third persons." We also obtained a "clean" random sample of designated persons.
Although the period for the field work became relatively short, we decided in favour of a design with repeated contacts. There were two main reasons for this. First, the total amount of interviewing time needed per household to administer all questions would well exceed an hour per respondent. By rule of thumb, this was judged an upper limit for the average time of a personal interview.
Second, in a main study repeated contacts would be necessary also for other reasons - to control for seasonality of time-use and expenditures - and we wanted the pretest to reflect the main study in this respect as well. Repeated contacts tend to increase non-response cumulatively, and we also wanted to get some idea from the pretest to what extent this would be true in our case.
There were altogether three contacts with each household. The first one was a short contact interview by telephone with the randomly selected person to establish the household composition and to ask a few demographic questions. Then, two interviews followed with each respondent in each household. One interview was personal and one was made by telephone. In addition, leave-behind expenditure diaries were administered to each respondent and leave-behind time-use diaries to a few respondents.
Time-use data can either be collected by retrospective questions or by a self-administered leave-behind diary. A self-administered diary has to be relatively simple and those that have been used in previous studies have usually been structured by a list of more or less aggregate activities, cross-classified by a time scale. The units of this scale have sometimes been as coarse as 15 or 30 minutes.
The disadvantages of these self-administered diaries are that the list of activities tends to steer the respondent too much, classification of activities is not controllable by the project staff, small although frequent activities are not reported, secondary activities cannot be reported, and to keep a diary is in itself an activity which disturbs other activities. The main disadvantage with retrospective questions about specified activities is that certain activities tend to become underreported while others become overreported.
The method used in the pretest is an adaptation of the yesterday question technique used at the ISR, the University of Michigan. It is perhaps best described as a one-day retrospective interviewer administered diary. The basic idea is that the interviewer goes through the past 24 hours with the respondent and asks him or her to recall for each activity when it started and ended. One advantage of this method is that it forces the respondent to have the time-use of all activities to add up to 24 hours. Furthermore, with one day retrospective questions, the data collection does not interfere with the observed activities and the recall error is reduced as much as possible. Contributing to our decision not to try other methods were the results of a few comparisons made in Michigan with the so-called beeper technique, i.e. each respondent was equipped with a beeper and, when it gave a signal at random time intervals, the respondent made a note about his (her) present activity. These comparisons showed no systematic difference between the two methods.
Questions about time-use during one or a few days will, however, give a very low precision for infrequent activities. The yesterday questions should therefore be supplemented with a self-administered diary for specified infrequent activities. Both these methods were tried in the pretest.
In consumer expenditure surveys, data are usually obtained by a combination of self-administered diaries, which are kept for a period of two to four weeks and recall questions about rare but major purchases of, for instance, consumer durables. There are severe problems with both methods. With diaries certain commodities tend to become underreported (for instance, alcoholic beverages, tobacco and various kinds of small purchases without a receipt, see the discussion of this in Klevmarken, 1981b, chapt. 2). Retrospective questions are also burdened by underreporting. In our pretest a new method was tried. Each reported activity in the time use interview was followed by questions about any expenditures the respondent might have had while doing the activity. The approach to ask jointly about expenditures and time-use might be less burdened by underreporting, since the questions link the expenditures to certain activities. This should make it easier for the respondent to remember both expenditures and activities. One problem is, however, that it is not practical to ask, if there was an expenditure for every activity. It is necessary to leave some discretion to the interviewer and this is a possible source of underreporting.
To obtain a standard of comparison for this new method, a self-administered diary was also given to each respondent. It was kept for one week. A diary for purchases of durables and other rare expenditures for the extended period of two weeks was also administered to some households.
In summary the pilot study was designed to
compare estimates from yesterday questions with estimates from the one-week diary;
compare estimates from retrospective questions about time-use in infrequent activities with those from diaries for infrequent activities and both with time-use estimates from yesterday questions;
compare estimates, both of time-use and expenditures, obtained in a personal interview with those obtained by a telephone interview. Since telephone interviews are less expensive, it would be an advantage if the telephone could be used in the main study;
investigate if the response rate and the estimates depend on how the diaries are sent in, i.e. whether the interviewer collects them in person or the respondent is requested to send them in by mail.
Our budget did not permit a larger sample than about 300 households. With such a small sample it was difficult to make all these comparisons. A simple design with subsamples and one treatment for each subsample would give more than ten subsamples. Besides no subsample would then be given a treatment similar to that of a main study. Calculations also showed that the precision of an estimated mean difference would be very low even if the sample was only split into two groups and each group given a separate treatment (see Johnsson, 1982). This forced us to design the pretest primarily for one of the comparisons, a) above, and also to use a "crossover design."
Suppose we would like to estimate the mean difference of two treatments. If it is feasible to give both treatments to each individual, there would be a gained efficiency compared to a design with two separate treatment groups, because the between individual variance is eliminated. In our case it was, however, not possible to give both an expenditure diary and a yesterday question for the same week to a respondent since the two methods would influence each other. We could, however, administer the diary for one week and ask the yesterday questions for a day in another week. If there is a positive correlation between the two estimates, there would still be a gain in precision.
The sample would then be randomly divided into two groups of equal size. One group is first given the one-week diary and then the yesterday questions for a ran dom day in the second week. The two methods are administered to the second group in reverse order to balance out systematic differences between the two weeks. For broad aggregates of commodities, it is reasonable to assume that there is a positive correlation between estimates associated with the same individual. This design might then give a substantial reduction in variance compared to a design with one treatment for each group. (The details are explained in Johnsson, 1982 and Klevmarken, 1982).
In the pretest, the sample was randomly divided into six experimental groups rather than two. The first four were primarily designed to give a balanced comparison between the two methods for collecting expenditures and between personal and telephone interviews. Groups five and six were smaller and separated out from the first four to field test the two weeks diaries.
The questionnaires were put together to meet certain requirements about average interviewing time set by interviewing practice and budget considerations. Disregarding the contact interview, one telephone interview of 30 minutes and one personal interview of 60 minutes were planned for each household head. For the head’s spouse and for any designated third adult our design included one telephone interview and one personal interview of 30 minutes each.
The final step in the design was to draw a random day for each household. This was done for each experimental group and "without replacement" to ensure that each day of the week was included with the same frequency (additional details about the design are found in Klevmarken, 1982).
3.2. Nonresponse
The field work was done by experienced interviewers from Statistics Sweden who had participated in a one-day training course for this particular project. Nevertheless, the demanding design of the pilot study gave us problems with nonresponse. This was not unanticipated, but in designing the study we did not want to hide a nonresponse problem behind a pilot study design which would have been less demanding than a planned main study. In retrospect, we should perhaps have designed the study to include a comparison between alternative measures to stimulate response. However, when the pilot study design was decided, we did not believe we would have the financial resources, nor the time needed for this.
In Table 1 we find response rates by type of contact and nonresponse by reason. Of the 320 designated persons sampled from HINK, 10 had died, moved outside the three counties, or moved into an institution. They thus did not belong to the population. Of the remaining 310, 224 agreed to give a contact interview, i.e. 72.3 per cent. 88 per cent of the nonresponse was classified by the interviewers as refusal. A respondent, who refused to participate, was not approached again.
Response by Type of Contact
| Type of contact | ||||
|---|---|---|---|---|
| Contact interview | Leave behind diaries | Interview 1 inc. yesterday quest | Interview 2 | |
| Sample size, households | 315 | |||
| Household members in household with contact interview | 403 | 403 | 403 | 403 |
| Respondents, households | 224 | |||
| Respondents, individuals | 305 | 317* | 316 | |
| Response rate (%) | 72.3 | 75.7 | 78.7* | 78.4 |
| Nonresponse by reason (%) | ||||
| not found | 2.4 | 0.5 | 4.0 | 2.0 |
| refusal | 24.4 | 21.3 | 17.1 | 18.6 |
| other | 0.9 | 2.5 | 0.2 | 1.0 |
| total non-response | 27.7 | 24.3 | 21.3 | 21.6 |
| Cumulative response | 403 | 305 | 280 | 268 |
| Cumulative response rate (%) | 100.0 | 75.7 | 69.5 | 66.5 |
-
*
7 individuals (1.7 %) did not respond to the yesterday questions.
Since we do not know the household composition for those households to which nonresponding designated persons belonged, it is not possible to compute individual response rates. In Table 1 response rates for contacts after the first contact interview are given for the 403 persons who belonged to a household which agreed to give a contact interview. Of these, 75.7 per cent completed a leave-behind diary, either the one-week expenditure diary, or the expenditure and time-use diaries for two weeks, 87.7 per cent responded to the first interview after the contact, 77.0 per cent answered the time-use questions, and 78.4 per cent responded to the last interview.
The cumulative response rate is 66.5 per cent, i.e. 268 persons of the 403 participating in all contacts.
Nonresponse decreases the effective sample size and thus the efficiency of estimates, but the main problem is that it might be selective and introduce a bias. It is always very difficult to show that a particular nonresponse does not contribute to a bias. What can be done after the field work is completed is to attempt an analysis of the characteristics of the nonrespondents compared to those of the respondents and, if called for, try by various means to adjust for selectivity bias. This is, however, only possible if there is at least some information about the nonrespondents.
In the HUS project, information about nonrespondents is available through the strata definitions, i.e. the nonresponse rates can be analyzed by household type and income as of 1979. We also know the age of each sample member and in what county the household lives. We can, in addition, use HINK-data for the entire sample of designated persons for a nonresponse analysis.
In summary, the nonresponse analysis gave the following results:1
The initial nonresponse was rather high. This was probably the combined effect of the following features: (i) The survey was introduced by telephone rather than in a personal visit. (ii) In this telephone interview we asked for family composition and previous marriages and living arrangements which some respondents might have found invasive. (iii) When the interviewer concluded the interview by explaining the design of the study, many respondents found the workload too high. This shows that the first interview should be in person, and the telephone contact preceding it should not be used to ask questions, only to make arrangements for the first interview.
A major drop in the response rate also occurred immediately after the contact interview, i.e. many respondents refused to keep an expenditure diary. Leave behind diaries tend to increase nonresponse. In this case a better result might have been obtained if the relative simplicity of the diary had been demonstrated by the interviewer in a personal visit. In the pilot study the diary was explained in the initial telephone contact and then mailed to the respondents.
Old respondents showed a relatively high nonresponse in those parts of the survey which involved relatively more work, i.e. diaries and long interviews about time-use. For this reason, we should probably not include very old persons in the main survey. An upper age limit somewhere between 70 and 75 might be helpful. Another reason for this is that interviews with old people are relatively expensive.
Nonresponse was relatively high in urban areas.
There was no indication of a strong relationship between nonresponse and income or socioeconomic group.
Refusals made up a very large share of the nonresponse. This indicates that we have to do a much better job in explaining the importance of the survey and also provide some personal stimuli to obtain a better cooperation.
In evaluating the response rates the following features of the very complex and demanding design of the pilot study should be considered:
Under such a short period as five weeks, the household was contacted for three interviews and, in addition, asked to keep a diary for one or two weeks.
Up to three household members were asked to participate in the survey.
The time schedule left very little freedom for the respondents and the interviewers to choose date and time for an interview at their convenience. The yesterday questions about time-use and expenditures should apply to a particular designated day, and the interview had to take place within three days after that day. No replacement days were used. For households with more than one participating adult, all interviews would have to be made within the same three days. The time span was rather short also for the contact interview. The interviewers were instructed to make repeated attempts to contact the respondents only within the period for each interview.
The time of the year was not ideal for a high response. During April and May, people tend to go out to their vacation houses, work on their pleasure boats, etc. One long weekend was also part of the sample period.
Replacement interviews and indirect interviews were normally not permitted. For instance, fixed rules which determined who would be head in combination with no replacements or indirect interviews made us lose much information about the household, which we could have got from the spouse.
Households very reluctantly volunteer to keep a diary. Although the diaries were not complicated, any diary and written instructions are likely to be deterrent. If the diary had been explained at a personal visit by the interviewer, it might have been easier to convince respondents to participate.
The respondents were not paid.
There were twelve different questionnaires and three diaries with instructions as well as additional material. Many interviewers found it difficult to keep track of all this material and also to administer the right questionnaire to the right person at the right moment. Almost all interviewers had respondents from all or almost all experimental groups.
The technique to ask yesterday questions about time-use and expenditures were new to all interviewers. Although some advance training was provided, many interviewers found it difficult to go through 24 hours activity by activity with the required detail. Respondents (and interviewers) found it difficult to understand why we needed such details. Some respondents felt their privacy invaded.
Our questions were mostly on economic facts about the household, questions which the respondents at best found boring or sometimes invasive. Some of our questions where rather sensitive, and all questions taken together might in the respondents opinion have revealed too much.
Respondents often find it difficult to understand what use a research project has, and it might be difficult to explain it in simple words. No respondent had any personal benefit from our pilot study.
No nonresponse follow up was done in the pilot study. There were mainly two reasons for this. First, the very tight time schedule did not permit a follow up, and the design with designated weeks and days made it difficult. Second, our budget constraints did not permit a rather expensive follow up.
With these experiences from the pilot study, what can be done to increase the response rate in a future main study? Three main categories of measures can be distinguished:
Design measures to decrease nonresponse
The number of contacts with each household should be reduced to a minimum.
Since leave-behind diaries tend to increase the nonresponse, they should be avoided if possible. For expenditures there is, however, no equivalent method. One possibility might be to ask the respondent to keep a diary, and if he (she) refuses, resort to a yesterday interview. Another possibility is to try a shorter diary than for one week.
If a method with a designated day is used, it would be desirable to have a design with alternative days to be used if the respondent cannot give a response for the first day. If between individual variation dominates over between days variation, it can be shown that randomly selected replacement days do not only increase the number of respondents, but also decrease the bias which might arise, because selected groups of respondents do not cooperate.
If a diary is to be used it should be introduced to the respondents by a personal visit, not sent to them by mail.
Special activities to simulate response
It is extremely important to explain the purpose and uses of the survey to the respondents and to make them understand that their cooperation is very important. One way to do this is to give them a comprehensive but short printed explanation which appeals to their imagination. Another way is to train the interviewers carefully, not only before the fieldwork starts, but also during the fieldwork. It is important that the project staff stays in contact with the interviewers during the course of the fieldwork and gives them feedback.
Newspaper and journal articles about the project should be copied and made available to the interviewers so they can show them to the respondents. Presscoverage in local papers is also important.
We have to do a much better job in explaining why time-use data are needed in such detail.
The respondents should get some kind of feedback after the first interview. One possibility would be to give them an average expenditure and time budget calculated from the pilot study. It might also be possible to do it by household type and income group. We could provide comparisons with other countries. When the fieldwork is completed and the data are ready for analysis the respondents could get similar tables based on the main survey with their own figures added as a comparison. This assumes that we will have access to names and addresses.
Renumeration is likely to increase the response somewhat, in particular, if the respondents are asked to keep a diary. The effects observed in other studies are small, however. In order to get an effect of paying the respondents of any magnitude, one would probably have to give them an amount equivalent to pay for work. That would, however, quickly exhaust any research budget. One alternative which has been tried successfully by some survey institutes is to send the respondents a gift before the first interview. Still another alternative is to arrange a lottery for those who have responded. These methods could be combined.
Plan for a crisis
Analysis of the nonresponse in the first interview in order to find target groups for nonresponse measures.
Reminder letters specially designed for each target group.
Form groups of interviewers, in particular in big cities, which can cooperate in recalls and exchange respondents within the group.
4. Comparisons of measurement methods
4.1. Expenditure estimates from one week diaries as compared to estimates from yesterday questions
Table 2 shows the difference between estimates from the one-week diary and the yesterday questions of average expenditures per head by commodity. These results are based on those 147 households which provided data by both methods. No nonresponse adjustment was made.
Comparison between the 7 Days Expenditure Diary and Yesterday Questions.
| Commodity | Average expenditure difference per head | Standard error |
|---|---|---|
| 1. Meals outside home | 27.73 | 8.92 |
| 2. Everyday commodities | 161.34 | 68.06 |
| 3. Clothing, shoes, etc | 16.23 | 65.34 |
| 4. Personal care services | 12.33 | 14.53 |
| 5. Medicine, etc. | 24.35 | 7.08 |
| 6. Medical services | 6.15 | 7.35 |
| 7. Childcare | 24.58 | 7.96 |
| 8. Housing | 212.40 | 288.65 |
| 9. Durables | 147.05 | 48.78 |
| 10. Transport and communication | 171.44 | 121.40 |
| 11. Pleasure, hobby and recreation | 3.86 | 46.01 |
| 12. Use and maintenance of vacation house and boat | -3.07 | 13.95 |
| 14. Mortgage payments etc | -9.12 | 30.25 |
| 15. Other commodities | -0.23 | 0.23 |
-
Note: Sample size is 147 households. No expenditures were recorded for Commodity, 13, Courses and education, or for 16, Other services.
With exception of the last three groups the difference is positive and also larger than twice the standard error for groups 1, 2, 5, 7 and 9. Since there is no reason to believe that either method would systematically overestimate the average expenditure for any commodity, these results indicate that the estimates from the yesterday questions have a (larger) negative bias (than the one-week diary).
4.2. Comparisons between personal visits and telephone interviews
The yesterday questions were administered to experimental groups in personal visits and telephone interviews according to the following scheme:
| Week 16 | Week 17 | |
|---|---|---|
| Visit | 4,5 | 1, 6 |
| Telephone | 2 | 3 |
Any difference between interviewing method can thus be estimated by,
where, for instance, X(l,6) is the estimated average time-use obtained from experimental groups 1 and 6.
The results for expenditures in a few major commodities and for time-use in all aggregate activities are exhibited in Table 3. The only significant difference is for the activity "Travel". The difference for "Maintenance and Repairs" is also close to twice its standard error. It is difficult to find any good explanation as to why a personal visit would give significantly higher estimates than a telephone interview just for these two commodities. Until a larger sample permitting more accurate estimates is available, we might tentatively conclude that there is no serious systematic difference between results from the two types of interviews.
Comparison of Estimates from Personal Visits and Telephone Interviews. (Expenditures per head are given in Swedish kronor and time-use per head in minutes).
| Commodity or activity | Average difference | Standard deviation |
|---|---|---|
| Meals during work outside home | 1.70 | 1.25 |
| Everyday commodities | -18.71 | 14.74 |
| Clothing, shoes, etc | 1.32 | 18.87 |
| Durables | 9.77 | 5.70 |
| Transport and communication | 11.71 | 20.86 |
| Pleasure, hobbies and recreation | -1.31 | 11.31 |
| Work for pay, etc | -4.63 | 63.73 |
| Household work | -4.69 | 32.99 |
| Care activities excl. sleep and rest | -28.21 | 29.92 |
| Sleep and rest | -17.19 | 44.74 |
| Shopping | -2.13 | 18.44 |
| Maintenance and repairs | 33.74 | 17.37 |
| Education and courses | -6.29 | 26.38 |
| Pleasure and recreation | -28.91 | 68.17 |
| Travel | 57.36 | 23.00 |
| Other communication | -7.83 | 9.22 |
| Don’t remember, refusal, gap | 8.78 | 8.13 |
4.3. Time-use estimates from yesterday questions compared to estimates from retrospective questions for 14 days
Time-use estimates of less frequent activities from yesterday questions will have a relatively low precision. To supplement them with more reliable estimates, these activities have to be observed for a longer time period. The pilot study design included two alternative approaches. One was a leave behind diary for rare activities which the respondents were asked to keep for 14 days. The other approach was to ask retrospectively for the past 14 days about time-use in these infrequent activities (the diary form and the retrospective questions are reproduced in Klevmarken, 1982, Appendix G and Appendix H respectively).
The leave-behind diary was only given to respondents in the experimental groups 5 and 6. The small sample size, accentuated by a relatively high nonresponse, makes comparisons with this method impossible. It is, however, feasible to compare the results from the retrospective questions with the results from the yesterday questions.
Retrospective questions for 14 days were only given to respondents in experi mental group 2. To simplify the calculations, the responses from this group to the yesterday questions were not used. For this reason, the estimates from the two methods are independent. Also, only the response from designated persons were used to calculate the estimates given in Table 4. It covers five activities which were reported so frequently that a comparison is feasible.
Time-Use Estimates from Yesterday Questions Compared to Retrospective Questions for 14 Days.
| f | y | n | f | y | n | Δf | Δy | |
|---|---|---|---|---|---|---|---|---|
| Maintenance and repairs | 0.459 | 136 | 48 | 0.425 | 51 | 29 | 0.034 | 85* |
| (0.095) | (23) | (0.102) | (11) | (0.140) | (25) | |||
| Sport activities, walks etc | 0.419 | 88 | 43 | 0.148 | 23 | 12 | 0.271 | 65* |
| (0.104) | (13) | (0.087) | (6) | (0.136) | (14) | |||
| Spectator activities | 0.186 | 137 | 20 | 0.213 | 15 | 13 | -0.027 | 122* |
| (0.081) | (14) | (0.093) | (5) | (0.123) | (15) | |||
| Guests at home | 0.192 | 77 | 20 | 0.489 | 34 | 26 | -0.297* | 43* |
| (0.079) | (12) | (0.103) | (7) | (0.130) | (14) | |||
| Guest with someone else | 0.491 | 180 | 56 | 0.470 | 74 | 26 | 0.021 | 106* |
| (0.103) | (20) | (0.099) | (20) | (0.143) | (29) | |||
| Sample size (after non·response) | 206 | 57 |
-
*
Significant at the 5 % level with a one-sided t-test. Standard error in parenthesis.
The first three columns give results from yesterday questions and the next three from the retrospective questions. f is an estimate of the relative frequency of people who have done the activity at least once during the period and y is the corresponding estimate of the average amount of time per day used by those who have done the activity. n is the number of respondents in the sample who have reported the activity. The estimates in the first column are simply the sum of the corresponding frequency estimates for each week and the estimates in the second column are unweighted averages of the time-use estimates for each week. This implies that those who did an activity both in week 16 and in week 17 are double counted. Thus, the yesterday question estimates overestimate the number of persons who have done the activity at least once during the two-week period and underestimate their average time-use. This suggests one-sided tests in the comparisons with the retrospective questions. Both the point estimates and the variances were computed according to Cochran (1977), Section 5A. 14.
The differences between the estimates from the two methods are exhibited in the last two columns of the table. With retrospective questions for 14 days, time use is badly underreported for all activities. The relative frequencies of active people agree somewhat better. There is only one significant difference. The share of people who had entertained guests at home was reported much higher retrospectively for 14 days than in the yesterday interviews.
Since underreporting is likely to be a more serious problem the longer the period covered, these comparisons show that retrospective questions for 14 days or longer cannot be recommended.
4.4. Estimates of time off work at work
In the labor market segment of the questionnaire questions were asked about how much time the respondent usually spent on breaks while at work. There were three questions:
SY34 During a normal workday, how much time do you use for meal breaks which are not included in your worktime?
SY35 (In addition), how much time do you use for ordinary coffee breaks or equivalent during your worktime?
SY36 How much time in addition to the breaks do you use for personal matters unrelated to your work, for instance, speaking to friends, personal errands or just relaxing?
The answers to these questions can be compared to the corresponding time use diary estimates for the activity: "Lunch, coffee breaks, other breaks and pri vate errands, and telephone calls" in the main job. (No time-use was reported for the corresponding activities in a secondary job.)
In all, there were 78 respondents who had answered at least one of the questions SY34 - SY36 and also gave a time-use diary. In Table 5 the number of respondents are cross-classified by their time-use according to each method. The first row shows that 15 respondents did not report any time off work at all in their time diary. Possible explanations are that they did not work, only worked part time on the designated day or that they did not have any time off during that particular day. Even if we disregard these 15 respondents, Table 5 shows that there are more observations above the main diagonal than below, i.e. the retrospective questions give on the average higher estimates than the time-use diaries.
Time off Work at Work Estimated from Yesterday Time-Use Diaries and Retrospective Questions. (Number of respondents by time-use in minutes.)
| Time-use diaries | Retrospective questions SY34-SY36 | |||||
|---|---|---|---|---|---|---|
| 1-15 | 16-30 | 31-45 | 46-60 | 61- | Total | |
| 0 | 3 | 3 | 2 | 1 | 6 | 15 |
| 1-15 | 0 | 0 | 0 | 0 | l | |
| 16-30 | 0 | 0 | 3 | 2 | 7 | 12 |
| 31-45 | l | l | 2 | 2 | 9 | 15 |
| 46-60 | 0 | 1 | 0 | 5 | 8 | 14 |
| 61- | 2 | 0 | 2 | 3 | 14 | 21 |
| Total | 6 | 5 | 9 | 14 | 44 | 78 |
These comparisons indicate that there are systematic differences between the two methods. It is difficult to say anything about what causes these differences. What is normal, or what the respondents perceive as normal, could well differ from the average time off during the two observed weeks, i.e. there is a true difference. It could also be that people tend to overreport retrospectively or they could tend to underreport in the time diary, in particular, short breaks of say less than 5 to 10 minutes. Since the sample size is also relatively small, and there might be selectivity effects, the relative merits of these two methods need further analysis with new data.
5. Conclusions
This concluding section first summarizes our findings about collection methods and then addresses the broader problem of collecting so much micro data from each household as suggested by the HUS-project.
5.1. Summary of results from tests of alternative data collection methods
For almost all commodities the yesterday question technique gave smaller estimates of average expenditures than leave behind diaries. Since we have no reason to expect that leave behind diaries would give overestimates, this result shows that yesterday questions in their present form tend to underestimate household expenditures. However, it might be possible to improve the methodology by adding one or two follow up questions about expenditures previously not mentioned and by giving stricter rules for how the questions should be asked.
Even if it will be possible to modify the yesterday questions not to give any systematic error, expenditures recorded only for a few days for each respondent will give unreliable estimates. If the shopping pattern during the week is approximately the same for all commodities, then it might be possible to adjust the sampling design to this pattern and in this way increase the efficiency somewhat. It is, however, not likely that this gain in efficiency would become so high that a longer observation period for less frequent purchases would not be needed.
Until more experiences have been obtained from yesterday questions about expenditures, one should perhaps look upon it as a second-best method which could be used when respondents refuse to keep a diary.
The yesterday question technique to collect time-use information has worked relatively well once the interviewers got used to it. The time-use questionnaire requires much more training than a traditional interviewer briefing gives. The pilot study did not include a comparison with the closest alternative - a self-administered leave-behind diary - but a comparative evaluation of these two methods would be useful for future data collection. All we have been able to do so far is to compare estimates of time-use in aggregate activities for the United States and Finland with our own estimates. There is a striking similarity in the time-use pattern between the three countries (Flood, 1983). We have also compared the response to yesterday questions with that to retrospective questions covering two weeks. Similar to results from other studies, we found that retrospective questions for a longer period tend to give systematic errors. Time-use for less frequent activities was underreported compared to the results from yesterday questions.
Also, the estimates of time off work at work revealed differences due to the kind of questions used. Longer hours were on the average reported for "normal" time off work at work than for the corresponding activities from the yesterday question diary.
Another issue was to investigate if telephone interviews could be used instead of personal interviews. Our experiences show that a difficult and demanding study like ours should be introduced to the respondents in person. Otherwise, the non response rate is likely to increase. For respondents we could, however, find no significant difference in time-use or expenditures between interviews made in person and those made by telephone.
5.2. Strategies in view of high nonresponse
The response rate in the major contacts was 50-55 per cent which is lower than we would find acceptable in a main study. The reasons for this have been discussed extensively above. In short, we ascribe this result at least partly to the ambitious design, the short timespan during which the field work had to be done and the budget constraints which did not permit paying the respondents nor permitted expensive nonresponse follow-ups. The conclusion is, with improvements in the design and with response stimulating measures, it should be possible to increase the response rate in a main study. It is, however, difficult to say by how much.
The high nonresponse is not only a result of what we did or did not do in the pilot study, but it is also indicative of a general problem of obtaining the cooperation of respondents in household surveys. The privacy issues, the anxiety for what computers can do and the increasing opportunity cost of leisure time, all contribute to an increasing reluctance towards household surveys. Since household data are vital for future research, this raises the questions of the likely consequences of nonresponse and what can be done to reduce unwanted effects.
Research about household behavior usually has no direct consequence for specific individuals or households. It is also a gradual procedure with many checks. New results are subjected to the criticism of the profession and also repeatedly tried on new data. "Phony" results caused by selective nonresponse are therefore not likely to survive for a very long time. The situation is, however, different in administrative uses of surveys. Survey results used in an administrative process might well have direct consequences for specific individuals (crop yield surveys is a good example) and the standard for accuracy should be set very high in these applications.
I am not suggesting that one should carelessly accept a high nonresponse in research about household behavior, but the nature of the research process justifies an approach to the nonresponse problem which at least partly differs from what one might accept in an administrative survey, i.e. a model dependent approach.
The choice between responding and dropping out in a survey is just another aspect of human behavior which, as well as economic behavior, could be explained and modeled. Suppose that the statistical problem is to estimate the unknown parameters of the economic model and that response/nonresponse is a stochastic choice. If it is independent of the endogenous variables of the economic model, nonresponse will only influence the efficiency of the parameter estimates. If the response behavior depends stochastically on the endogenous variables, then ignoring the nonresponse will, with the usual ML and LS estimators in general, lead to biased and inconsistent estimates. In this case adjustments or alternative approaches are needed. One approach is to model the response mechanism and to estimate this model as an integral part of the economic model. If there is no specification error one can usually find estimators which are consistent.
In this methodology, compensation for nonresponse bias thus becomes part of the modelbuilding and estimation process. Suppose we would like to estimate the parameters of an ordinary regression model. If the probability of response is a function of a number of variables of which at least one stochastically depends on the dependent variable in the regression model, then the regression model and the function for the response probability would have to be estimated simultaneously. An example is given in Greenlees et al. (1982) where they estimated an earnings function. The log of earnings was a function of schooling, experience, a few other variables and a stochastic disturbance term. If one does not take into account that people with high earnings are less likely to respond, the estimates will become biased and the same will also be true for predictions generated by the earnings function. In their case, the probability of response followed a logistic distribution. It was made dependent on income, education, age, and a few geographical dummies.
Response/nonresponse is an example of a discrete choice and the literature about discrete choice models and estimation methods for these models is of relevance also for the nonresponse problem (see for instance Manski and McFadden, 1981). There are also parallels to a few papers in survey sampling which discuss estimation methods when the selection probability depends stochastically on the endogenous variables of the matter-of-fact model (see for instance Holt et al., 1980; Nathan and Holt, 1980). A survey of model-based nonresponse treatment is given in Little (1982). He also compares these methods with more traditional weighting and imputation methods.
Model-based adjustment methods, however, do not replace a good study design, they only supplement it. In household surveys, many resources will have to go into response-stimulating features and follow-ups as discussed above in Section 3.
The HUS-project was started with the ambition to analyze how closely various household activities depend on each other. Consequently, we did not want to impose assumptions about independence. Our plan was to collect a lot of data from each household. Although part of the information needed would be available in the data files of Statistics Sweden, the experiences from the pilot study indicate that we should perhaps scale down our ambitions somewhat and not collect all that much information from each household. A little more a priori structure on our general model for the household sector would be helpful in designing a study for which all subsets of information are not collected for all households, but some subsets are collected from some households. In a longitudinal study, it is also possible to ease the response burden by allocating subsets of questions to different waves.
A priori assumptions that certain variables are independent as outlined in Section 2 thus justifies a piecewise data collection and limits the scope of multivariate analysis. However, multivariate analysis is also possible with less stringent assumptions as is shown in Klevmarken (1981a; 1983). Suppose data have been collected in two independent samples and that the first sample includes Y and Z variables while the second includes X and Z variables. Assume furthermore that the economic model specifies a multivariate relation between Y and X. If it is possible to specify a predictor relation between X and Z, justified either by the economic model itself or by supplementary a priori information, this relation can be estimated from the second sample and used with the Z-variables from the first sample to predict the missing X-variables in this sample. The relation between Y and X can then be estimated from observed Y’s and predicted X’s. The properties of the resulting estimates of course depend on the predictor relation. If it reflects a "true" model structure it is possible to obtain consistent estimates, as shown for linear models in Klevmarken (1981a ; 1983).
In micro simulation, we do not only need estimates of the structural relations but also of the distribution fx or a sample from it which gives the initial conditions for the simulation. If a complete sample including all X’s is unavailable, one has to resort to a second-best solution. In principle, one could think of using the prediction approach above if it is modified to preserve in the predictions the variability of the X-variables.
Another similar approach is statistical matching. This is a technique by which similar but nonidentical individuals from two or more samples are matched into one synthetic sample. Similarity is defined by some distance measure on variables which are common to all samples (for a review see U.S. Department of Commerce (1980)). Suppose that observations on X1 and X2 from two different samples are matched by the common Z variables. The model assumption implicitly made by this technique is that X1 and Z are independent conditionally on X2. Sampling experiments show that if this assumption is true, matching methods which preserve the second order properties of the X’s give useful results. If, however, X1 and Z are not conditionally independent, then statistical matching results in a distorted matched X1, -distribution (see Paass, 1982; Rodgers and DeVol, 1982). A disadvantage with statistical matching is that it is a rather expensive technique.
Both approaches rely on model assumptions for which it might be difficult to find a justification. This is, in particular, true for assumptions about the "exogenous" distribution fx. The theoretical support for the distribution function fx is likely to be weak.
Since survey research is very expensive, few of us are likely to experience a project with so abundant resources that nonresponse does not become a severe problem. A good design and response stimulating measures will always have a high priority, but we might still have to use several data sources or samples, and we might still have to compensate for nonresponse selectivity. The approaches discussed briefly above can then prove useful, but there is still very little experience of their use in practice.
Footnotes
1.
Detailed tables can be found in Klevmarken (1982).
References
- 1
-
2
Household Market and Nonmarket Activities: Research Program and Proposal. IUI Research Reports No.12Stockholm: Industrial Institute for Economic and Social Research.
-
3
Time Allocation to Market and Nonmarket Activities in Swedish Households. Seminar Paper No 1Göteborg: Department of Statistics, University of Gothenburg.
-
4
Imputation of missing values when the probability of response depends on the variable being imputedJournal of the American Statistical Association 77:251–261.https://doi.org/10.1080/01621459.1982.10477793
-
5
Regression analysis of data from complex surveysJournal of the Royal Statistical Society. Series A (General) 143:474.https://doi.org/10.2307/2982065
-
6
Household Market and Nonmarket Activities: Design Issues for a Pilot Study. Research Report No 2Göteborg: Department of Statistics, Univerity of Gthenburg.
-
7
The 1981 Proceedings of the Business and Economic Statistics Section of the American Statistical Association, ASAMissing variables and two-stage least-squares estimation from more than one data set, The 1981 Proceedings of the Business and Economic Statistics Section of the American Statistical Association, ASA, Washington D.C.
-
8
On the Complete Systems Approach to Demand AnalysisStockholm: Industrial Institute for Economic and Social Research.
-
9
Household Market and Nonmarket Activities (HUS). A Pilot Study. Research Report No 3. Department of Statistics, University of GothenburgHousehold Market and Nonmarket Activities (HUS). A Pilot Study. Research Report No 3. Department of Statistics, University of Gothenburg, Göteborg.
- 10
-
11
Models for nonresponse in surveysJournal of the American Statistical Association 77:237–250.https://doi.org/10.1080/01621459.1982.10477792
-
12
Structural Analysis of Discrete Data with Econometric ApplicationsCambridge, Mass: MIT Press.
-
13
The effect of survey design on regression analysisJournal of the Royal Statistical Society 42:377–386.https://doi.org/10.1111/j.2517-6161.1980.tb01139.x
-
14
Statistical Match with Additional Information. Internal Report IPES 82.0204, Gesellschaft Fur Mathematik Und Datenverarbeitung, St. AugustinStatistical Match with Additional Information. Internal Report IPES 82.0204, Gesellschaft Fur Mathematik Und Datenverarbeitung, St. Augustin.
-
15
An Evaluation of Statistical Matching, Institute for Social ResreachAnn Arbor, M.I: University of Michigan.
-
16
Statistical Policy Working Paper No 5, U.SReport on exact and statistical matching techniques, Statistical Policy Working Paper No 5, U.S, Washington D.C, Government Printing Office.
Article and author information
Author details
Funding
No specific funding for this article is reported.
Acknowledgements
This article has been originally published as Part 3 ch 2 in Microanalytic Simulation Models to Support Social and Financial Policy; G.H. Orcutt, J. Merz and H. Quinke (editors). © Elsevier Science Publishers B. V. (North-Holland),1986.
Publication history
- Version of Record published: April 30, 2022 (version 1)
Copyright
© 2022, Anders Klevmarken
This article is distributed under the terms of the (Creative Commons Attribution License, which permits unrestricted use and redistribution provided that the original author and source are credited.