Cite as: L. Riccetti; 2022; Agent-based Multi-layer Network Simulations for Financial Systemic Risk Measurement: a Proposal for Future Developments; International Journal of Microsimulation; 15(2); 44–61. doi: 10.34196/ijm.00262
Abstract
The paper addresses the topic of measuring the systemic risk and of identifying Systemically Important Financial Institutions (SIFIs) with an agent-based multi-layer network simulation. The paper starts from the shortcomings of the models currently proposed in the literature and suggests directions for future researches and guidelines to realize a methodology able to accurately model the direct network contagion channel (interconnectedness of balance sheet of financial institutions, including direct losses and liquidity hoarding), also integrating the indirect contagion channel (fire sales and bank runs), in order to reach the full representation of the financial systemic risk.
This article contains 2 figures and 2 tables.
Figures
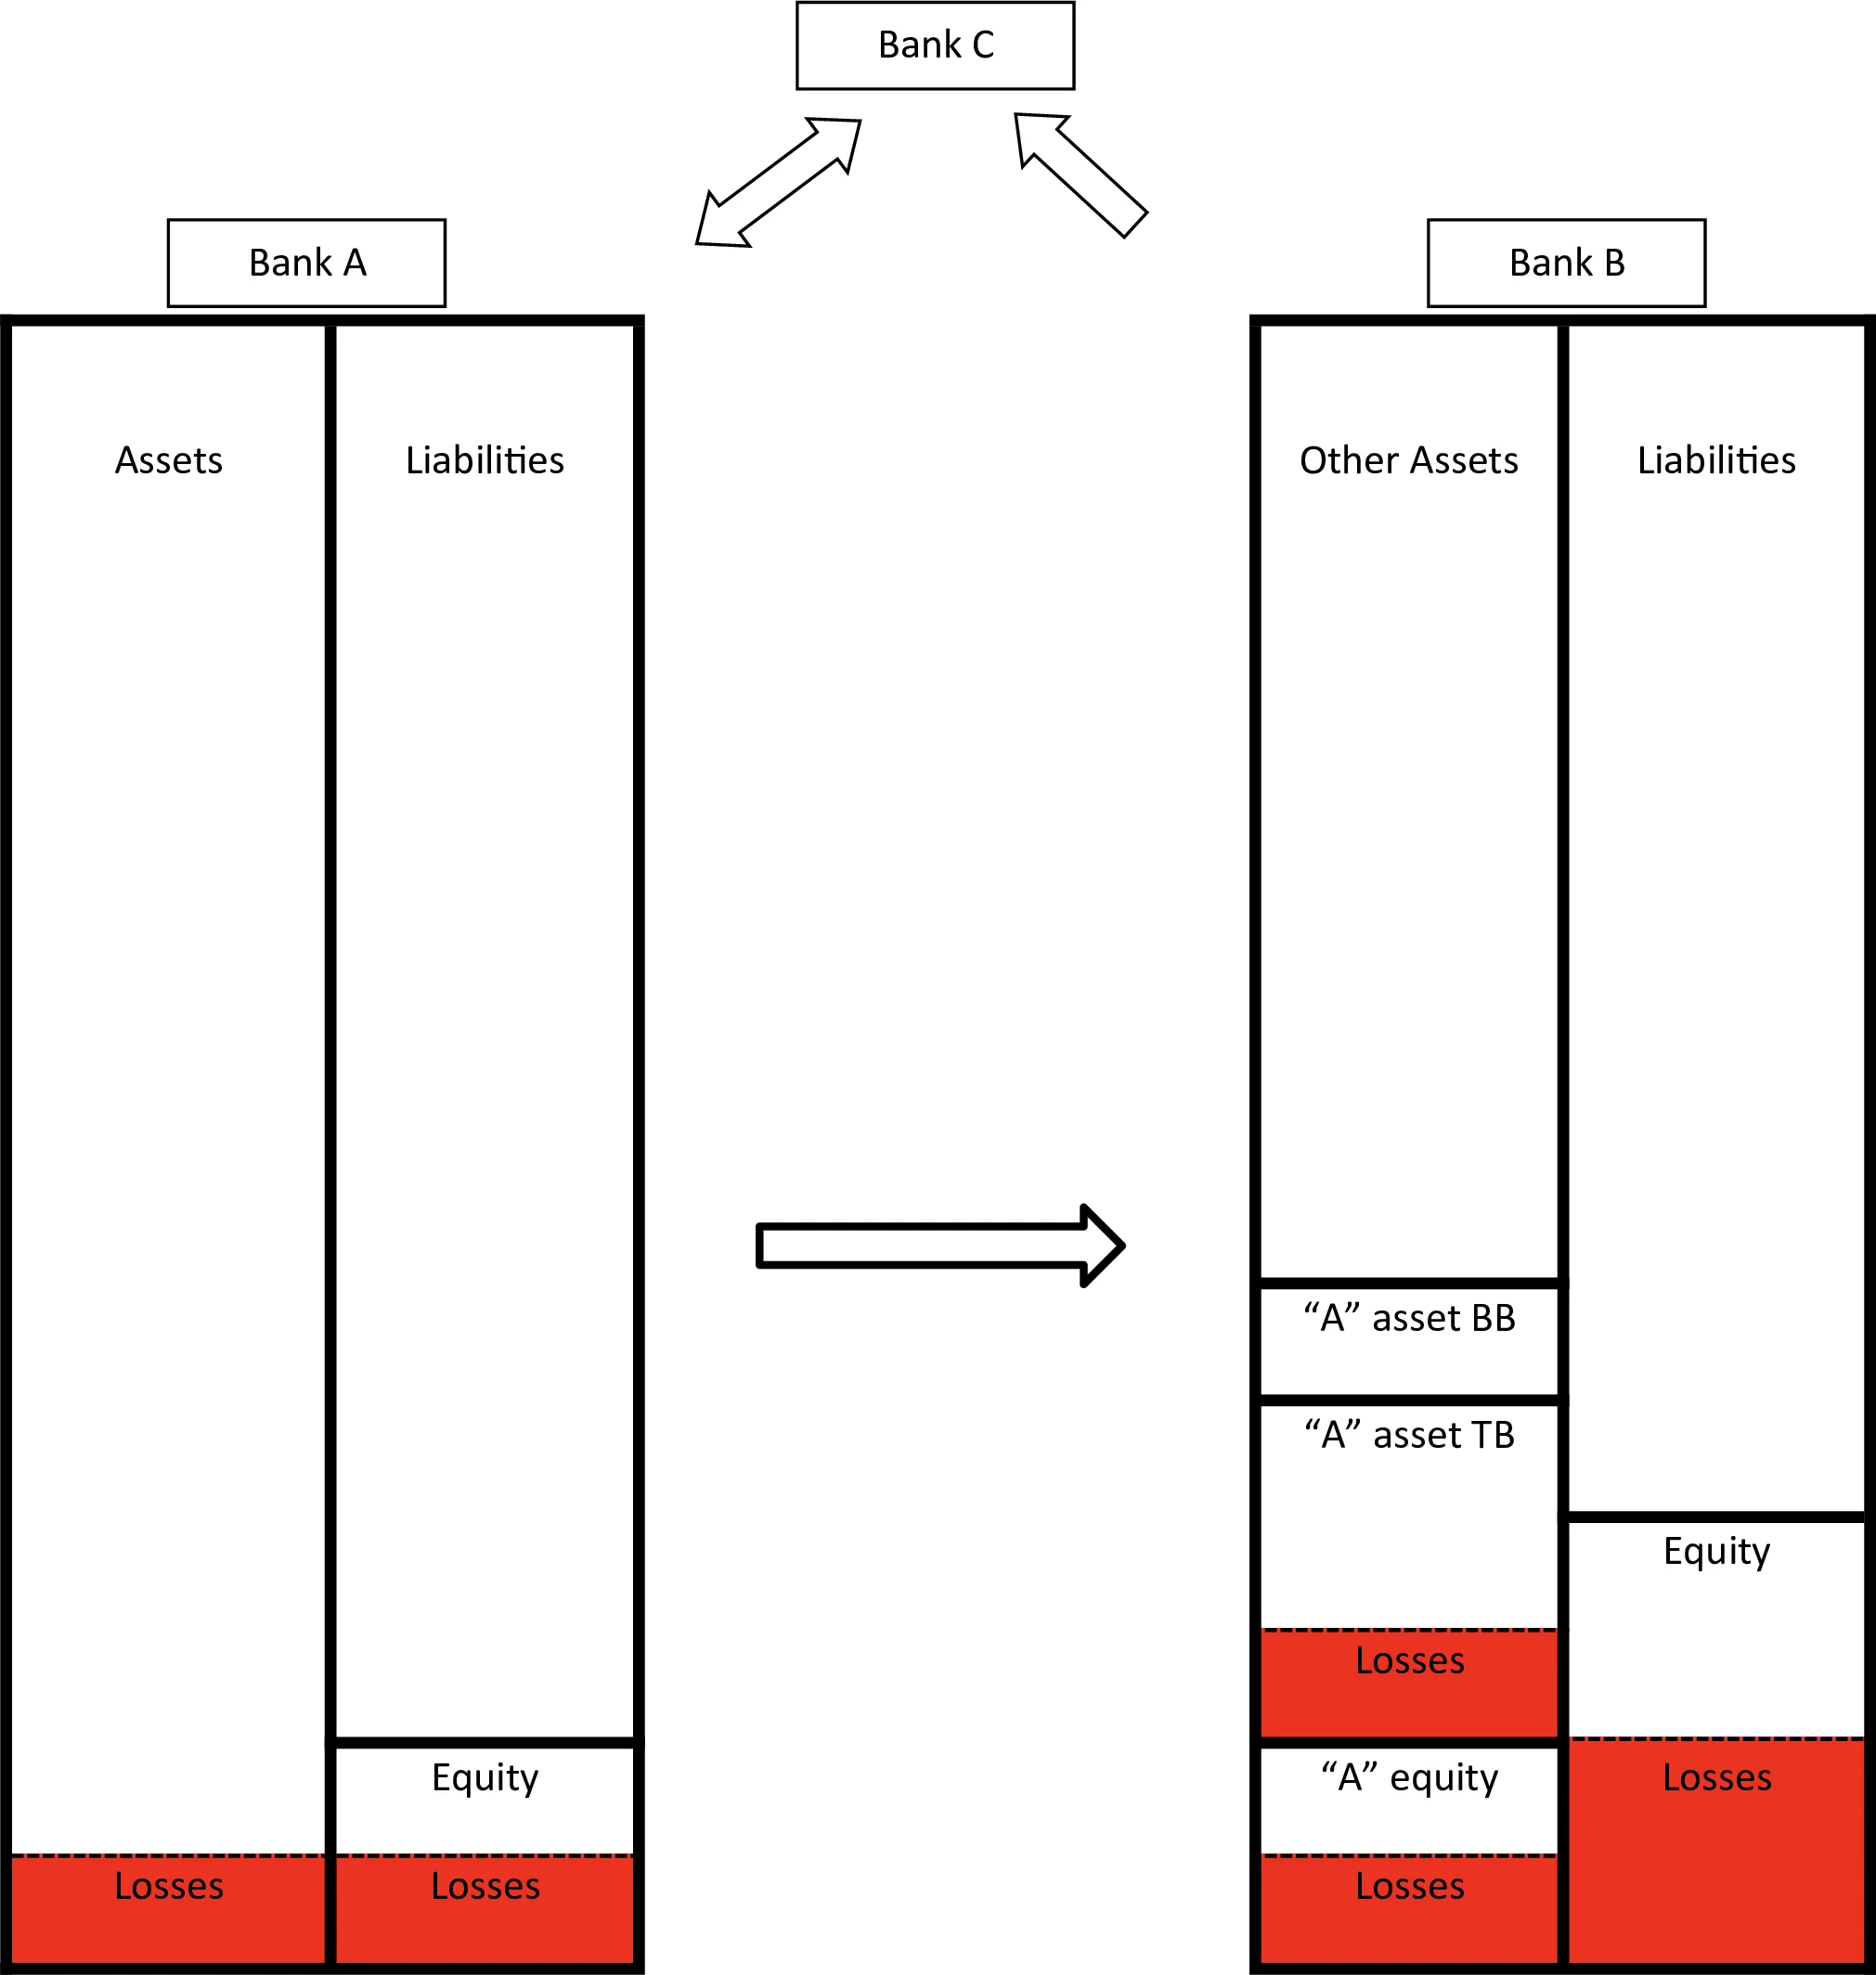
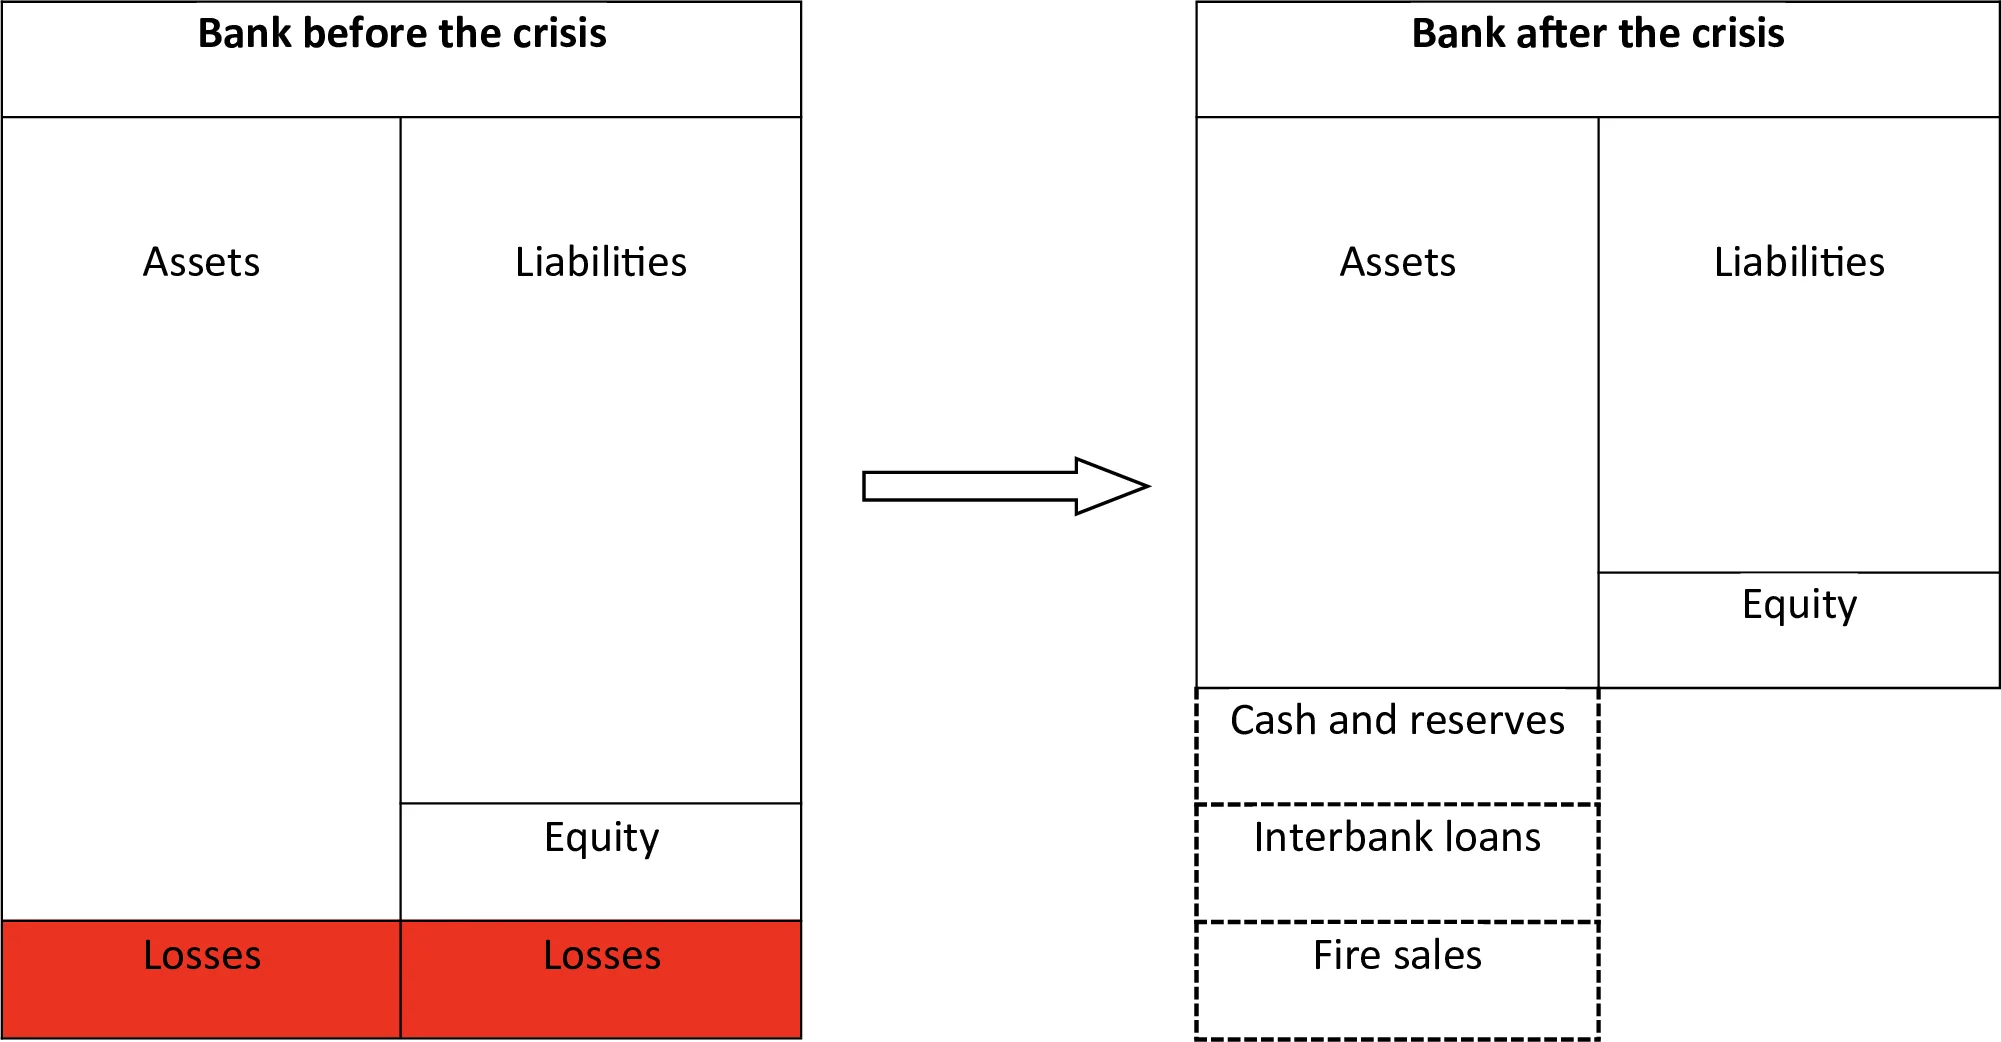
Figure 1. Bank A suffers a loss. This causes losses to banks B and C. For instance, we assume (using only equity and “other assets” exposures) that it largely reduces the value of bank A’s equity held by bank B (“A” equity), reduces less the value of the “other assets” held by bank B in its trading book (“A” asset TB), and does not reduce the value of the “other assets” held by bank B in its banking book (“A” asset BB). The same happens in the balance sheets of bank C. Moreover, for example, the losses of bank B implies losses for bank C that owns instruments issued by B, while the losses of bank C implies further losses to bank A, as indicated by the arrows. The figure is purely schematic and is not intended to indicate the relative magnitudes of the various parts of the balance sheet.Figure 2. Undercapitalized banks have to sell some assets to deleverage in order to conform to regulatory constraints. Banks should follow a strategy in order to dispose of the assets that minimize the reduction of the return, in particular trying to avoid fire sales. The figure is purely schematic and is not intended to indicate the relative magnitudes of the various parts of the balance sheet.
Tables
Table 1. The team. The activities are linked to the related tasks described below.
Researchers in
Activities
Tasks
Econometrics
Time-series analysis, with a particular focus on price modelling of financial instruments.
1 and 3
Financial markets
Study of asset pricing theory and price modelling with the econometricians.
1 and 3
Banking and financial regulation
Analysis of bank strategies to comply to regulatory constraint (task 2), and analysis of bank balance sheets (tasks 1 and 3).
1-2-3
Network analysis
Network simulations engineering.
4
BB
Banking Book
DGI
G-20 Data Gaps Initiative
EA
Euro Area
ECB
European Central Bank
EMIR
European Market Infrastructure Regulation (EU Regulation 648/2012)
EU
European Union
FIs
Financial Institutions
FSB
Financial Stability Board
G-SIBs
Global Systemically Important Banks
IASB
International Accounting Standards Board
IFRS
International Financial Reporting Standards
IMF
International Monetary Fund
LGD
Loss Given Default
MiFID 2
Markets in Financial Instruments Directive (EU Directive 65/2014)
MiFIR
Markets in Financial Instruments Regulation (EU Regulation 600/2014)
OFR
U.S. Office of Financial Research
PD
Probability of Default
RR
Recovery Rate
SIFIs
Systemically Important Financial Institutions
SPPI test
Solely Payments of Principal and Interest on the principal amount outstanding test