
This article contains 13 figures and 9 tables.
Figures
Tables
| All sectors | 57% |
|---|---|
| Metal and mechanical industries | 73% |
| Electrical and electronic industries | 56% |
| Chemical and pararchemical industries | 55% |
| Textile and leather industries | 76% |
| Agro-industries | 34% |
| Mining | 32% |
| Energy | 63% |
| Fishing | 24% |
| Services to individuals | 60% |
| Education and human health | 43% |
| Corporate services | 65% |
| Real estate activities | 63% |
| Information and telecommunication | 48% |
| Hotel and restaurant | 89% |
| Transport and storage | 54% |
| Trade | 46% |
| Construction | 59% |
Source: Haut-Commissariat au Plan (2020a).
The lockdown measures started on March 9th and a first wave of restrictions were removed on June 9th and a second wage at the end of July 2020.
| Freq. | % | |
|---|---|---|
| Households | ||
| Urban | 9 845 | 58.3% |
| Rural | 7 034 | 41.7% |
| Morocco | 16 879 | 100% |
| Individuals | ||
| Urban | 39 033 | 54.4% |
| Rural | 32 765 | 45.6% |
| Morocco | 71 798 | 100% |
Source: Authors’ computation based on the ONDH Household Panel Survey (2019 wave).
| Individuals | Freq. | % |
|---|---|---|
| Urban | 2 2369 714 | 62.9% |
| Rural | 13 201 998 | 37.1% |
| Morocco | 35 571 711 | 100% |
Source: Authors’ computation based on the ONDH Household Panel Survey (2019 wave).
| Average | Median | |
|---|---|---|
| Morocco | 18 769.68 | 14 437.59 |
| Urban | 22 724.15 | 17 500.8 |
| Rural | 12 069.16 | 10 092.96 |
Source: Authors’ computation based on the ONDH - EPM (2019 wave).
| Share of pop. | FGT0 | Contribution FGT0 | FGT1 | Contribution FGT1 | FGT2 | Contribution FGT2 | |
|---|---|---|---|---|---|---|---|
| Morocco | 1.19 | 0.13 | 100.00 | 0.02 | 100.00 | ||
| Urban | 62.89 | 0.25 | 13.06 | 0.02 | 8.00 | 0.00 | 4.58 |
| Rural | 37.11 | 2.79 | 86.94 | 0.33 | 92.00 | 0.06 | 95.42 |
Source: Authors’ computation based on the ONDH - EPM (2019 wave).
| Poverty incidence | |||
|---|---|---|---|
| Share in the population | FGT0 | Contribution to FGT0 | |
| Morocco | 100% | 1.19% | 100% |
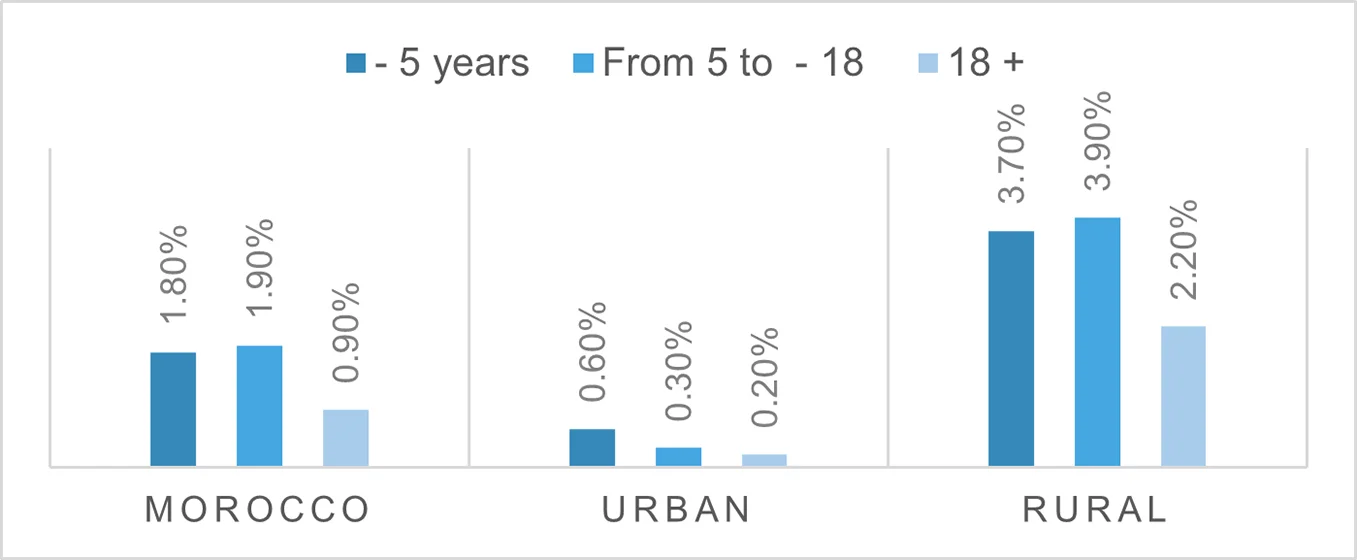
| - 5 Years | 8.2% | 1.8% | 12.5% |
| + 5 to - 18 Years | 23.2% | 1.9% | 36.1% |
| 18 and + | 68.6% | 0.9% | 51.4% |
Source: Authors’ computation based on the ONDH - EPM (2019 wave).
| Poor (FGT0) | Vulnerable | ||
|---|---|---|---|
| Base | Urban | 0.2% | 2.8% |
| Rural | 2.8% | 15.1% | |
| Morocco | 1.2% | 7.4% | |
| COVID | Urban | 5.5% | 5.6% |
| Rural | 9.9% | 17.0% | |
| Morocco | 7.2% | 9.8% | |
| Scenario 1 | Urban | 2.4% | 5.4% |
| Rural | 5.1% | 10.9% | |
| Morocco | 3.4% | 7.4% | |
| Scenario 2 | Urban | 1.4% | 4.7% |
| Rural | 3.2% | 9.3% | |
| Morocco | 2.1% | 6.4% |
Source: Authors’ computation based on the ONDH - EPM (2019 wave).
| Base | COVID-19 | Scenario 1 | Scenario 2 | ||
|---|---|---|---|---|---|
| Poverty | |||||
| Morocco | - 5 years | 1.8 | 10.1 | 5.1 | 3.2 |
| From 5 to - 18 | 1.9 | 9.9 | 5.1 | 3.1 | |
| 18 and + Years | 0.9 | 5.9 | 2.6 | 1.6 | |
| Urban | - 5 years | 0.6 | 8.9 | 3.9 | 2.4 |
| From 5 to - 18 | 0.3 | 7.8 | 3.9 | 2.3 | |
| 18 and + Years | 0.2 | 4.5 | 1.8 | 1.1 | |
| Rural | - 5 years | 3.7 | 11.8 | 7.0 | 4.5 |
| From 5 to - 18 | 3.9 | 12.7 | 6.6 | 4.1 | |
| 18 and + Years | 2.2 | 8.4 | 4.2 | 2.7 | |
| Vulnerability | |||||
| Morocco | - 5 years | 11.4 | 22.5 | 14.7 | 11.4 |
| From 5 to - 18 | 12.7 | 23.2 | 15.3 | 12.0 | |
| 18 and + Years | 6.8 | 14.3 | 8.8 | 7.0 | |
| Urban | - 5 years | 4.4 | 16.0 | 11.4 | 9.2 |
| From 5 to - 18 | 4.6 | 15.5 | 11.1 | 8.9 | |
| 18 and + Years | 2.5 | 9.4 | 6.4 | 5.0 | |
| Rural | - 5 years | 22.0 | 32.1 | 19.7 | 14.9 |
| From 5 to - 18 | 23.3 | 33.5 | 20.7 | 16.1 | |
| 18 and + Years | 15.0 | 23.3 | 13.5 | 10.7 | |
Source: Authors’ computation based on the ONDH - EPM (2019 wave).
| The total cost of the measure - MAD | Cost per capita (total population) - MAD | Cost per capita (beneficiary population) - MAD | Per capita cost per child under 18 out of poverty - MAD | ||
|---|---|---|---|---|---|
| Scenario 2 complete | Morocco | 172 900 000 | 4.86 | 6.33 | 789.87 |
| Urban | 78 186 400 | 3.50 | 5.06 | 768.2 | |
| Rural | 94 713 000 | 7.17 | 7.97 | 808.69 | |
| Scenario 2 School Aid | Morocco | 20 615 400 | 0.58 | 2.12 | 94.18 |
| Urban | 5 954 400 | 0.27 | 1.41 | 58.50 | |
| Rural | 14 661 000 | 1.11 | 2.67 | 125.18 |
Source: Authors’ computation based on the ONDH - EPM (2019 wave).