SWITCH: A Tax-Benefit Model for Ireland Linked to Survey and Register Data
- Economic and Social Research Institute, Ireland
Figures
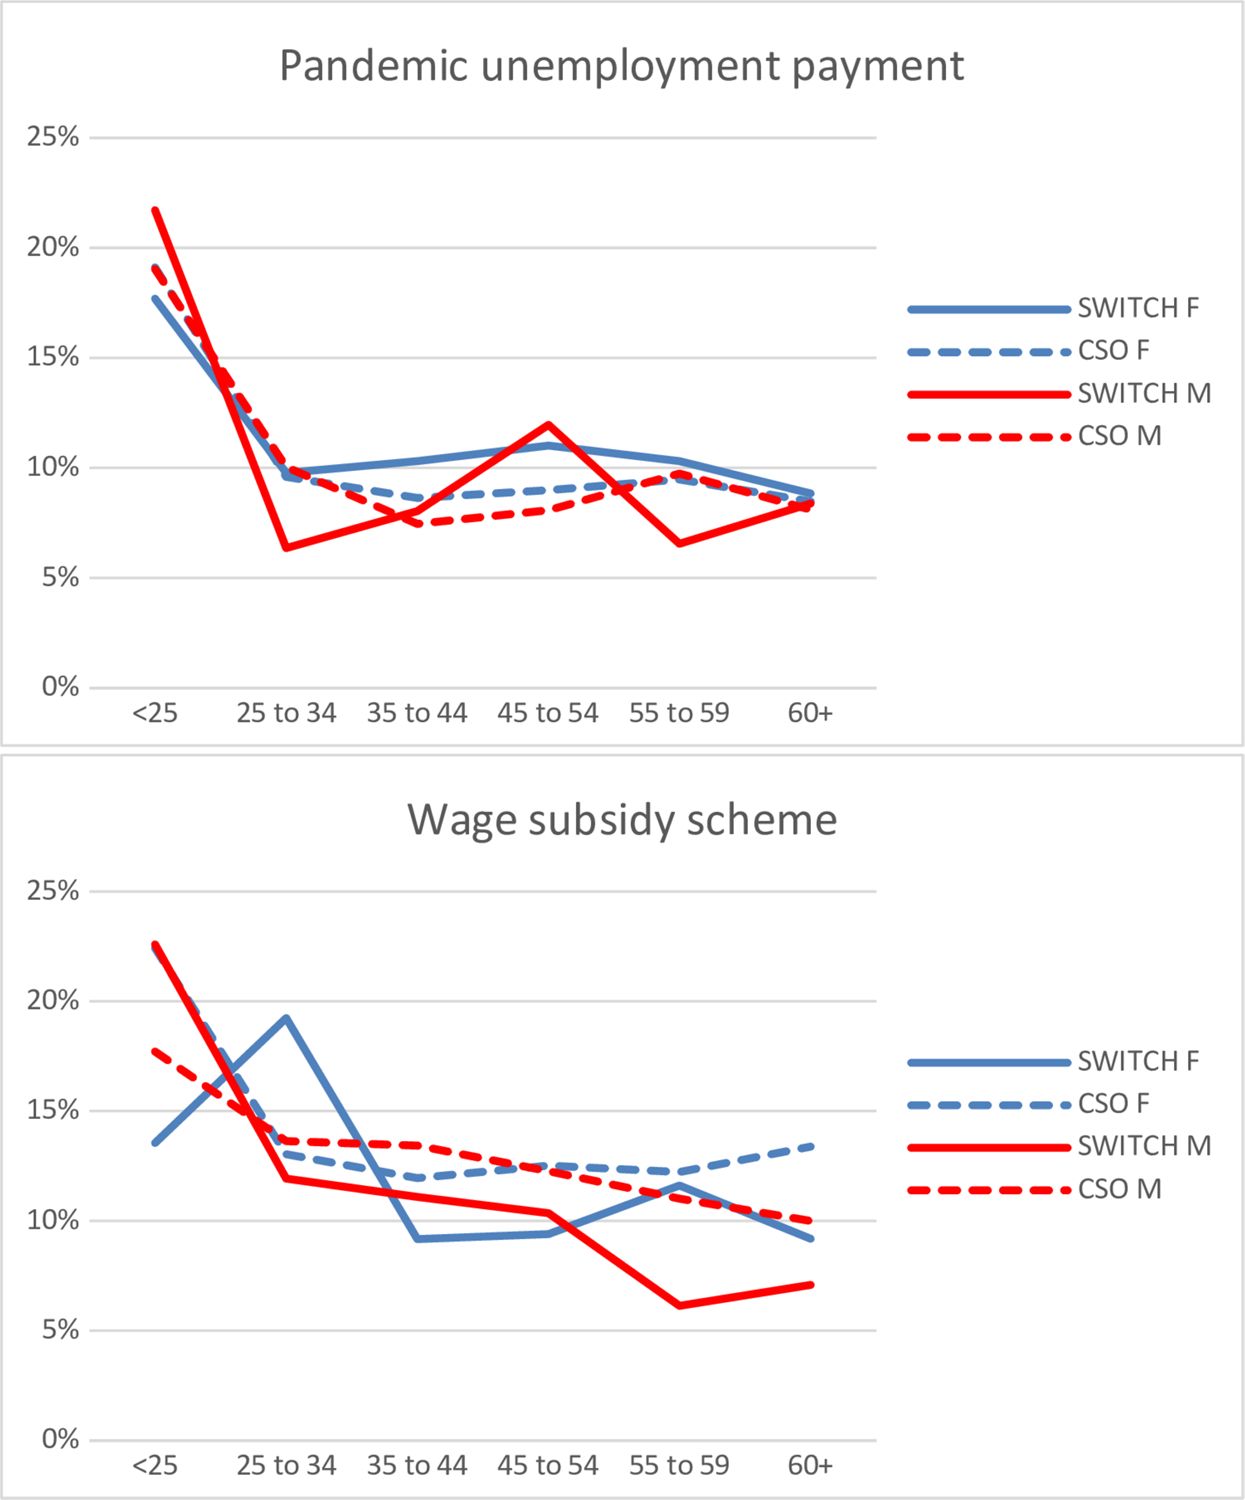
The proportion of workers receiving the PUP and the wage subsidy by gender and age category in August 2020. Note: SWITCH simulations are based on v2.1 F indicates female, M indicates male.
Tables
Uprating Factors
| Index | Source | Income components uprated |
|---|---|---|
| Average earnings per week, € | https://cso.ie/px/pxeirestat/Statire/SelectVarVal/Define.asp?maintable=EHQ03&PLanguage=0 | Employment income |
| Self-employed income (2006=1) | https://www.cso.ie/px/pxeirestat/Statire/SelectVarVal/Define.asp?maintable=RVA01&PLanguage=0 up to 2018, GNP per capita after 2018 | Self-employed income |
| GDP per capita (2007=1) | https://statbank.cso.ie/px/pxeirestat/Statire/SelectVarVal/Define.asp?maintable=NQQ40&PLanguage=0 | Investment income |
| https://cso.ie/px/pxeirestat/Statire/SelectVarVal/Define.asp?maintable=PEA01&PLanguage=0 | ||
| Consumer price index (2007=1) | https://www.cso.ie/px/pxeirestat/Statire/SelectVarVal/Define.asp?maintable=CPA01&PLanguage=0 | Non-simulated benefits, asset income, benefit-in-kind, expenditure. |
Control Totals Used in Weighting Process
| SILC control totals | SWITCH control totals | Source for controls |
|---|---|---|
| Household location (8 NUTS3 regions) | Household location (8 NUTS3 regions) | LFS (CSO Ireland) |
| Household composition | Household composition | LFS (CSO Ireland) |
| Demographics: 4 age groups by sex | Male demographics: 4 age groups | Projected Census (CSO Ireland) |
| Female demographics: 5 year-band age groups up to 64 and one for all above 65 years old | Projected Census (CSO Ireland) | |
| Employment and unemployment levels | LFS (CSO Ireland) | |
| Forecasted income distribution for employees and self-employed | Office of the Revenue Commissioners | |
| Number of recipients of key benefits | Annual Statistics Report of the Department of Social protection |
Simulated and non-simulated social welfare schemes
| Scheme | Simulation Status |
|---|---|
| Child Benefit | Fully Simulated |
| Early Childhood Care & Education Scheme | Fully Simulated |
| Job Seekers Allowance | Fully Simulated |
| Job Seekers Benefit | Fully Simulated |
| Jobseekers Transitional Payment | Fully Simulated |
| Maternity Benefit | Fully Simulated |
| National Childcare Scheme | Fully Simulated |
| One-Parent Family Payment | Fully Simulated |
| Pandemic Unemployment Payment | Fully Simulated |
| Rent or Mortgage Supplement | Fully Simulated |
| State Pension (Non-Contributory) | Fully Simulated |
| Temporary Wage Subsidy Scheme | Fully Simulated |
| Widow’s Non-Contributory Pension | Fully Simulated |
| Working Family Payment | Fully Simulated |
| National Childcare Scheme | Fully Simulated |
| Early Childhood Care and Education Scheme | Fully Simulated |
| Medical and GP visit card | Fully Simulated |
| Employment Wage Subsidy Scheme | Fully Simulated |
| Pandemic Unemployment Payment | Fully Simulated |
| Carer’s Allowance | Part-simulated |
| Disability Allowance | Part-simulated |
| Fuel Allowance | Part-simulated |
| Illness Benefit | Part-simulated |
| Injury Benefit | Part-simulated |
| Invalidity Pension | Part-simulated |
| State Pension (Contributory) | Part-simulated |
| State Pension (Transition) | Part-simulated |
| Supplementary Welfare Allowance | Part-simulated |
| Widow’s Contributory Pension | Part-simulated |
| Education Grant (from FAS) | Non-simulated |
| Grants/Education (Training) Allowances | Non-simulated |
| Household Benefits Package | Non-simulated |
| Minor Social Assistance Benefits* | Non-simulated |
| Non-Irish Social Welfare Payments | Non-simulated |
| Residual Family Allowances† | Non-simulated |
-
*
This aggregate benefit is composed of monies received from charities and local government
-
†
This aggregate benefit is composed of Back to School Clothing & Footwear Allowance, Carer’s Benefit, Deserted Wife’s Allowance, Deserted Wife’s Benefit, Guardian’s Payment Contributory, Guardian’s Payment Non-Contributory, Special Diet Supplement
Number of Taxpayer Units by Income Bands - Employees and Self Employed
| Gross Annual Income Range | 2019 Admin Estimates* | SILC 2019 weight† | SWITCH revised 2019 weight | ||
|---|---|---|---|---|---|
| N | Ratio to 2019 Admin | N | Ratio to 2019 Admin | ||
| 10000 - 12000 | 83,398 | 67,995 | 82% | 83,398 | 100% |
| 12000 - 15000 | 128,504 | 77,999 | 61% | 128,504 | 100% |
| 15000 - 17000 | 87,411 | 57,914 | 66% | 87,411 | 100% |
| 17000 - 20000 | 132,041 | 93,864 | 71% | 132,040 | 100% |
| 20000 - 25000 | 222,622 | 148,259 | 67% | 222,622 | 100% |
| 25000 - 27000 | 90,614 | 60,305 | 67% | 90,614 | 100% |
| 27000 - 30000 | 128,098 | 81,699 | 64% | 128,098 | 100% |
| 30000 - 35000 | 197,218 | 124,738 | 63% | 197,218 | 100% |
| 35000 - 40000 | 175,005 | 120,624 | 69% | 175,005 | 100% |
| 40000 - 50000 | 246,907 | 169,937 | 69% | 246,907 | 100% |
| 50000 - 60000 | 176,301 | 150,004 | 85% | 176,301 | 100% |
| 60000 - 70000 | 129,339 | 100,134 | 77% | 129,339 | 100% |
| 70000 - 75000 | 52,152 | 34,144 | 65% | 52,152 | 100% |
| 75000 - 80000 | 44,201 | 31,987 | 72% | 44,201 | 100% |
| 80000 - 90000 | 69,282 | 64,746 | 93% | 69,283 | 100% |
| 90000 - 100000 | 51,727 | 76,357 | 148% | 51,726 | 100% |
| 100000 - 150000 | 118,559 | 121,949 | 103% | 118,559 | 100% |
| 150000 - 200000 | 33,656 | 33,653 | 100% | 33,656 | 100% |
| 200000 - 275000 | 17,014 | 13,797‡ | 81% | 17,014‡ | 100% |
| Over - 275000 | 16,264 | 10,380‡ | 64% | 16,264‡ | 100% |
-
Source: Office of the Revenue Commissioners available at https://www.revenue.ie/en/corporate/information-about-revenue/statistics/income-distributions/income-tax-distributions-interactive-tables.aspx
-
*
The last year for which data about the income distribution are available from Revenue is 2018. To align available information about income with the year of collection of the SWITCH input data, we forecasted the 2019 income distribution. The forecasted income distribution was created by applying the average annual change for years 2015 to 2018 to each income band to 2018’s income distribution.
-
†
The weight used in this analysis is the one described in CSO SILC 2019 i.e., it is based on demographics (4 age groups by sex), household location (8 NNUTS3 regions) and household composition.
-
‡
Statistics of lower statistical reliability due to low number of unweighted observations (30-50).
Benefit Recipient Numbers Comparison, 2019
| (1) | (2) | (3) | (4) | (5) | (6) | |||||||
|---|---|---|---|---|---|---|---|---|---|---|---|---|
| Scheme type | Scheme Name | 2019 Admin* | EUROMOD 2019† | SWITCH revised 2019 weight (output data) | SWITCH revised 2019 weight (input data) | SILC 2019 weight (output data) | SILC 2019 weight (input data) | |||||
| N | Ratio to 2019 Admin | N | Ratio to 2019 Admin | N | Ratio to 2019 Admin | N | Ratio to 2019 Admin | N | Ratio 2019 to Admin | |||
| Pensions | State Pension (Contributory)‡ | 367,133 | 358,098 | 98% | 356,998 | 97% | 367,133 | 100% | 365,237 | 99% | 634,000 | 173% |
| State Pension (Non-Contributory) | 94,854 | 89,117 | 94% | 86,122 | 91% | 94,954 | 100% | 84,846 | 89% | 71,000 | 75% | |
| Widow’s Pension (Contributory)‡ | 115,152 | 128,898 | 112% | 128,898 | 112% | 115,152 | 100% | 115,152 | 100% | 31,000 | 27% | |
| Widow’s Pension (Non-Contributory)‡ | 1,373 | § | § | § | § | § | § | § | § | 9,000 | 655% | |
| Working age income support | Supplementary Welfare Allowance | 15,770 | 16,302¶ | 103% | § | § | 15,770¶ | 100% | § | § | 0 | 0% |
| Jobseeker’s Allowance | 123,633 | 164,390 | 133% | 148,097 | 120% | 123,633 | 100% | 85,139 | 68% | 231,000 | 187% | |
| Jobseeker’s Benefit | 34,141 | 41,523 | 122% | 41,523 | 122% | 34,141 | 100% | 34,141 | 100% | 112,000 | 328% | |
| One Parent Family Payment | 39,533 | 37,405 | 95% | 42,389 | 107% | 39,533 | 100% | 46,006 | 116% | 107,000 | 271% | |
| Maternity Benefit | 21,279 | 18,184 ¶ | 85% | 37,681 | 177% | 20,209 ¶ | 95% | 37,964 | 178% | 16,000 | 75% | |
| Illness, Disability & Caring | Carer’s Allowance | 84,028 | 98,877 | 118% | 97,998 | 117% | 87,559 | 104% | 85,148 | 101% | n/a | n/a |
| Illness Benefit | 49,313 | 48,142 | 98% | 46,958 | 95% | 49,313 | 100% | 47,811 | 97% | 4,000 | 8% | |
| Invalidity Pension | 58,168 | 53,025 | 91% | 53,025 | 91% | 58,168 | 100% | 58,168 | 100% | 197,000 | 339% | |
| Disability Allowance | 146,755 | 178,104 | 121% | 166,664 | 114% | 146,755 | 100% | 136,431 | 93% | 157,000 | 107% | |
| Injury Benefit | 1,314 | § | § | § | § | § | § | § | § | 5,000 | 381% | |
| Child-related payments | Working Family Payment | 53,104 | 47,564 | 90% | 54,243 | 102% | 53,104 | 100% | 58,066 | 106% | 15,000 | 28% |
| Child Benefit | 637,007 | ** | 695,878 | 109% | ** | 675,319 | 106% | 688,000 | 108% | |||
-
*
Source 2019 SISWS file: https://www.gov.ie/en/publication/02f594-annual-sws-statistical-information-report/
-
†
Source: EUROMOD Country Report Ireland 2018-2021, Table 4.7. Recipient numbers are rounded to the nearest thousand.
-
‡
SISWS 2019 figures adjusted to exclude recipients living outside the state and those living in long-term residential care.
-
§
Statistics are disclosed due to small sample sizes to ensure adherence to CSO Statistical Disclosure Control rules.
-
¶
Lower statistical reliability due to a small number of unweighted observations.
-
**
Child benefit is reported at a child level in the SILC data but at a recipient (i.e. parental) level in SWITCH and in administrative data, so the SILC input observations are excluded due to non-comparability.
Benefit Expenditure Comparison, 2019 (€, thousands)
| (1) | (2) | (3) | (4) | |||||
|---|---|---|---|---|---|---|---|---|
| Scheme type | Scheme Name | 2019 Admin Numbers* | SILC 2019 weight (output data) | SWITCH revised 2019 weight (output data) | EUROMOD 2019† | |||
| Expenditure | Ratio to 2019 Admin | Expenditure | Ratio to 2019 Admin | Expenditure | Ratio to 2019 Admin | |||
| Pensions | State Pension (Contributory)‡ | 5,603 | 4,959 | 89% | 5,052 | 90% | 9,137 | 163% |
| State Pension (Non-Contributory) | 1,043 | 1,021 | 98% | 994 | 95% | 894 | 86% | |
| Widow’s Pension (Contributory)‡ | 1559 | 1,685 | 108% | 1,489 | 96% | 356 | 23% | |
| Widow’s Pension (Non-Contributory) ‡ | 14 | § | § | § | § | 72 | 516% | |
| Working age income support | Supplementary Welfare Allowance | 120 | § | § | § | § | 1 | 1% |
| Jobseeker’s Allowance | 1,629 | 1,643 | 101% | 931 | 57% | 1,501 | 92% | |
| Jobseeker’s Benefit | 348 | 351 | 101% | 280 | 80% | 400 | 115% | |
| One Parent Family Payment | 533 | 497 | 93% | 485 | 91% | 1,329 | 249% | |
| Maternity Benefit | 267 | 174 | 65% | 163 | 61% | 113 | 42% | |
| Illness, Disability & Caring | Carer’s Allowance | 863 | 1,032 | 120% | 900 | 104% | n/a | n/a |
| Illness Benefit | 607 | 575 | 95% | 561 | 92% | 27 | 4% | |
| Invalidity Pension | 728 | 692 | 95% | 773 | 106% | 2,540 | 349% | |
| Disability Allowance | 1,706 | 1,957 | 115% | 1,530 | 90% | 1,799 | 105% | |
| Injury Benefit | 14 | § | § | § | § | 41 | 301% | |
| Child-related payments | Working Family Payment | 397 | 260 | 66% | 232 | 58% | 80 | 20% |
| Child Benefit | 2,103 | 2,067 | 98% | 1,992 | 95% | 2,034 | 97% | |
-
*
Source 2019 SISWS file: https://www.gov.ie/en/publication/02f594-annual-sws-statistical-information-report/
-
†
source: EUROMOD Country Report Ireland 2018-2021, Table 4.8.
-
‡
SISWS 2019 figures adjusted to exclude recipients living outside the state and those living in long-term residential care
-
§
Statistics are disclosed due to Secondary Disclosure Controls.
Non-Cash Benefits Comparison
| Non-cash Benefit | 2019 Admin Numbers | SILC 2019 weight (output data) | SWITCH revised 2019 weight (output data) | ||
|---|---|---|---|---|---|
| N | Ratio to 2019 Admin | N | Ratio to 2019 Admin | ||
| Medical Card | 1,544,374* | 1,389,272 | 90% | 1,004,881 | 65% |
| GP Visit Card | 524,494* | 573,932 | 109% | 659,999 | 126% |
| Early Childhood Care & Education Scheme | 118,896† | 71,656 | 60% | 75,635 | 64% |
| National Childcare Scheme | 62,686‡ | 154,926 | 247% | 5,441 | 264% |
-
*
-
†
source: data for 2017 from DCEDIY.
-
‡
source: administrative numbers for the monthly average participants between 2019-2020 from DCEDIY.
Data and code availability
The SWITCH model is based on the EUROMOD platform, available at https://euromod-web.jrc.ec.europa.eu/. We are happy to provide the front-end of the model upon request but due to restrictions imposed to us by the Irish Central Statistics Office, who provide the underlying data for the model, we cannot provide the input dataset the SWITCH model runs on. Only those appointed Officer of Statistics for the underlying data can access it and this is restricted to those residents in Ireland. We are committed of preserving the data and model for a period of no less than five years following publication of the manuscript, and to providing reasonable assistance to requests for clarification and replication.