Trends in Income and Expenditure Inequality in the 1980s and 1990s: A Re-Examination and Further Results
- NATSEM, University of Canberra, Australia. This article originally appeared as a NATSEM Discussion Paper no. 57 in June 2002.
Figures
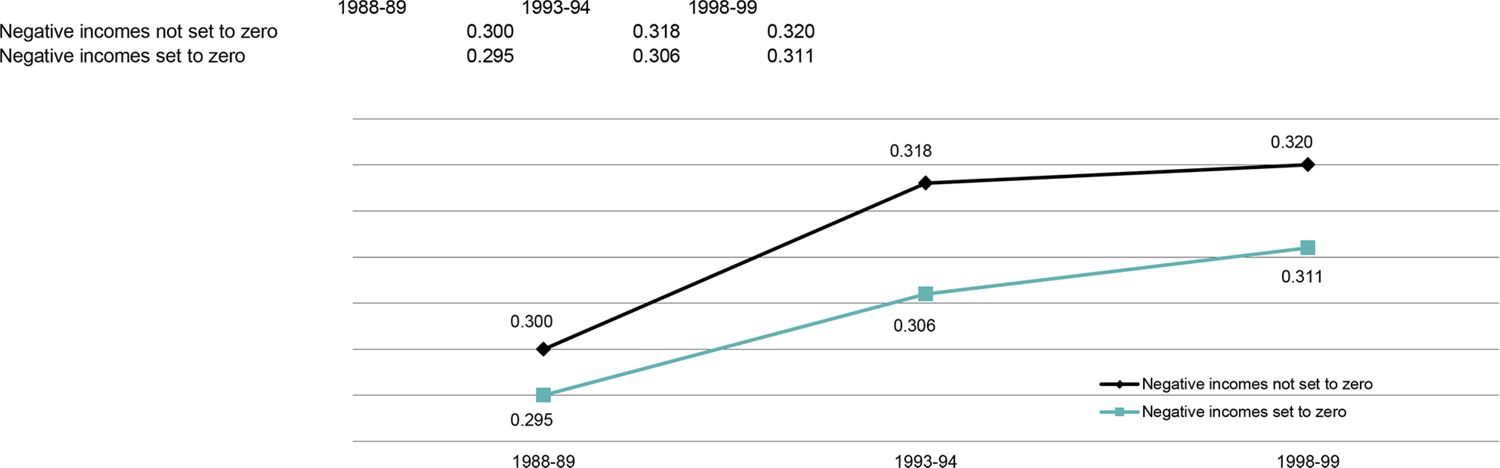
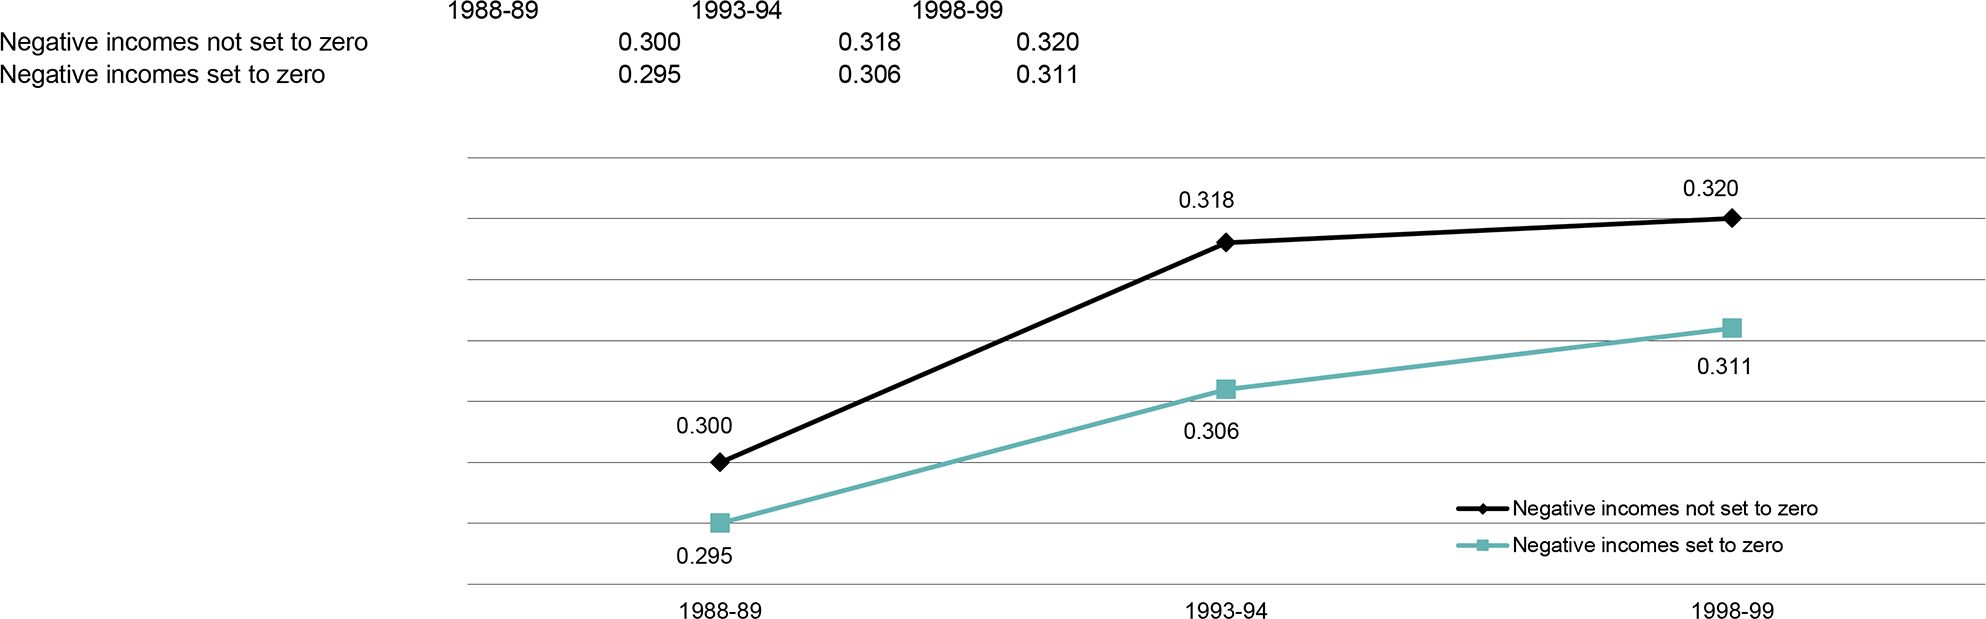
Gini coefficients for equivalent disposable income using the Household Expenditure Surveys 1988-89, 1993-94 and 1998-99.. Note: The results for 1984 are not included here because in 1984 negative incomes were already set to zero by the ABS. The ‘negative incomes set to zero’ Lorenz curves cross between 1993-94 and 1998-99. Consequently, no conclusion can be drawn about the change in inequality during that period.Data source: ABS Household Expenditure Survey unit record files.
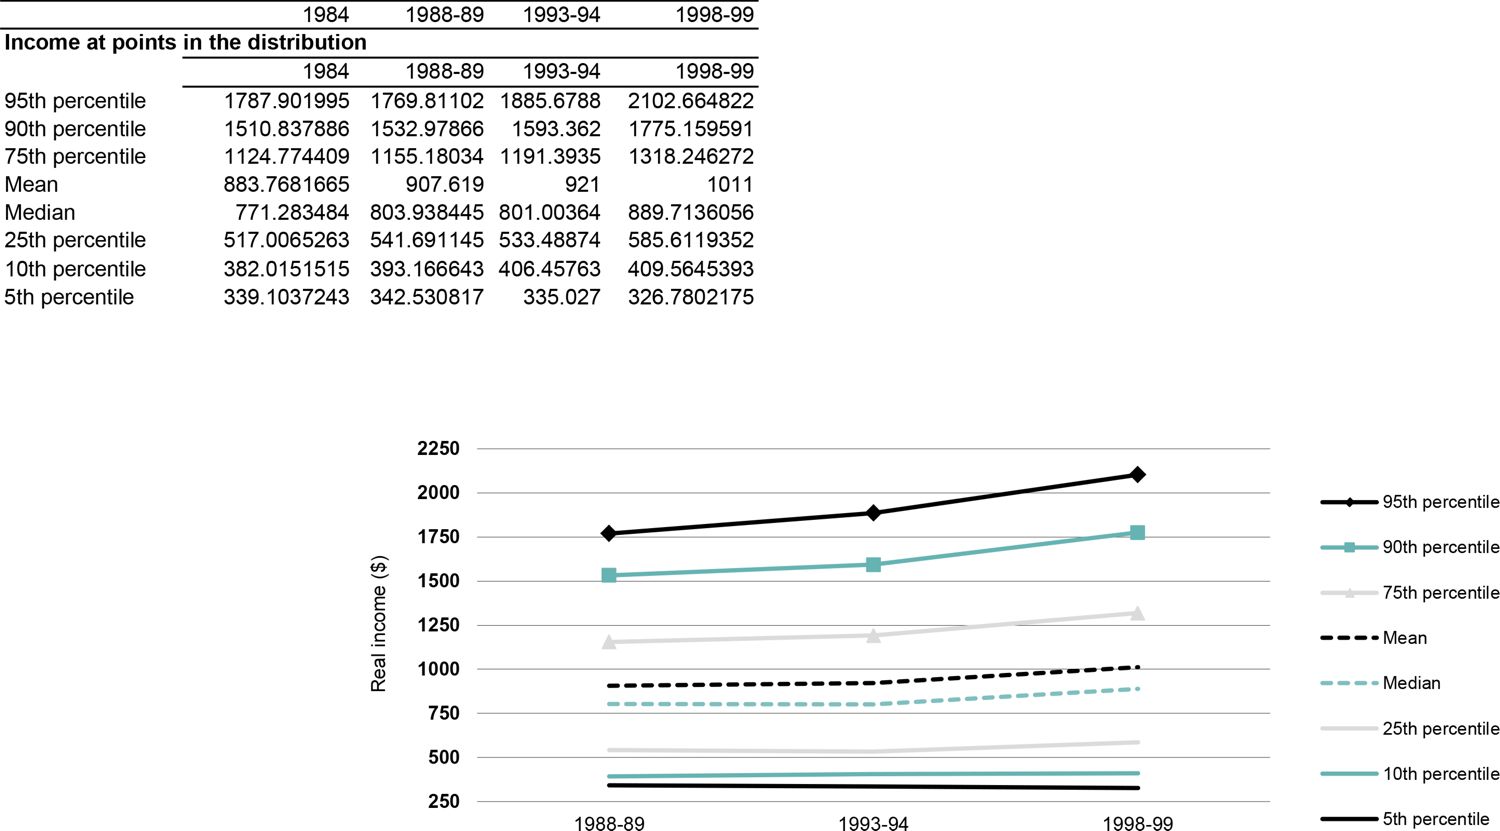
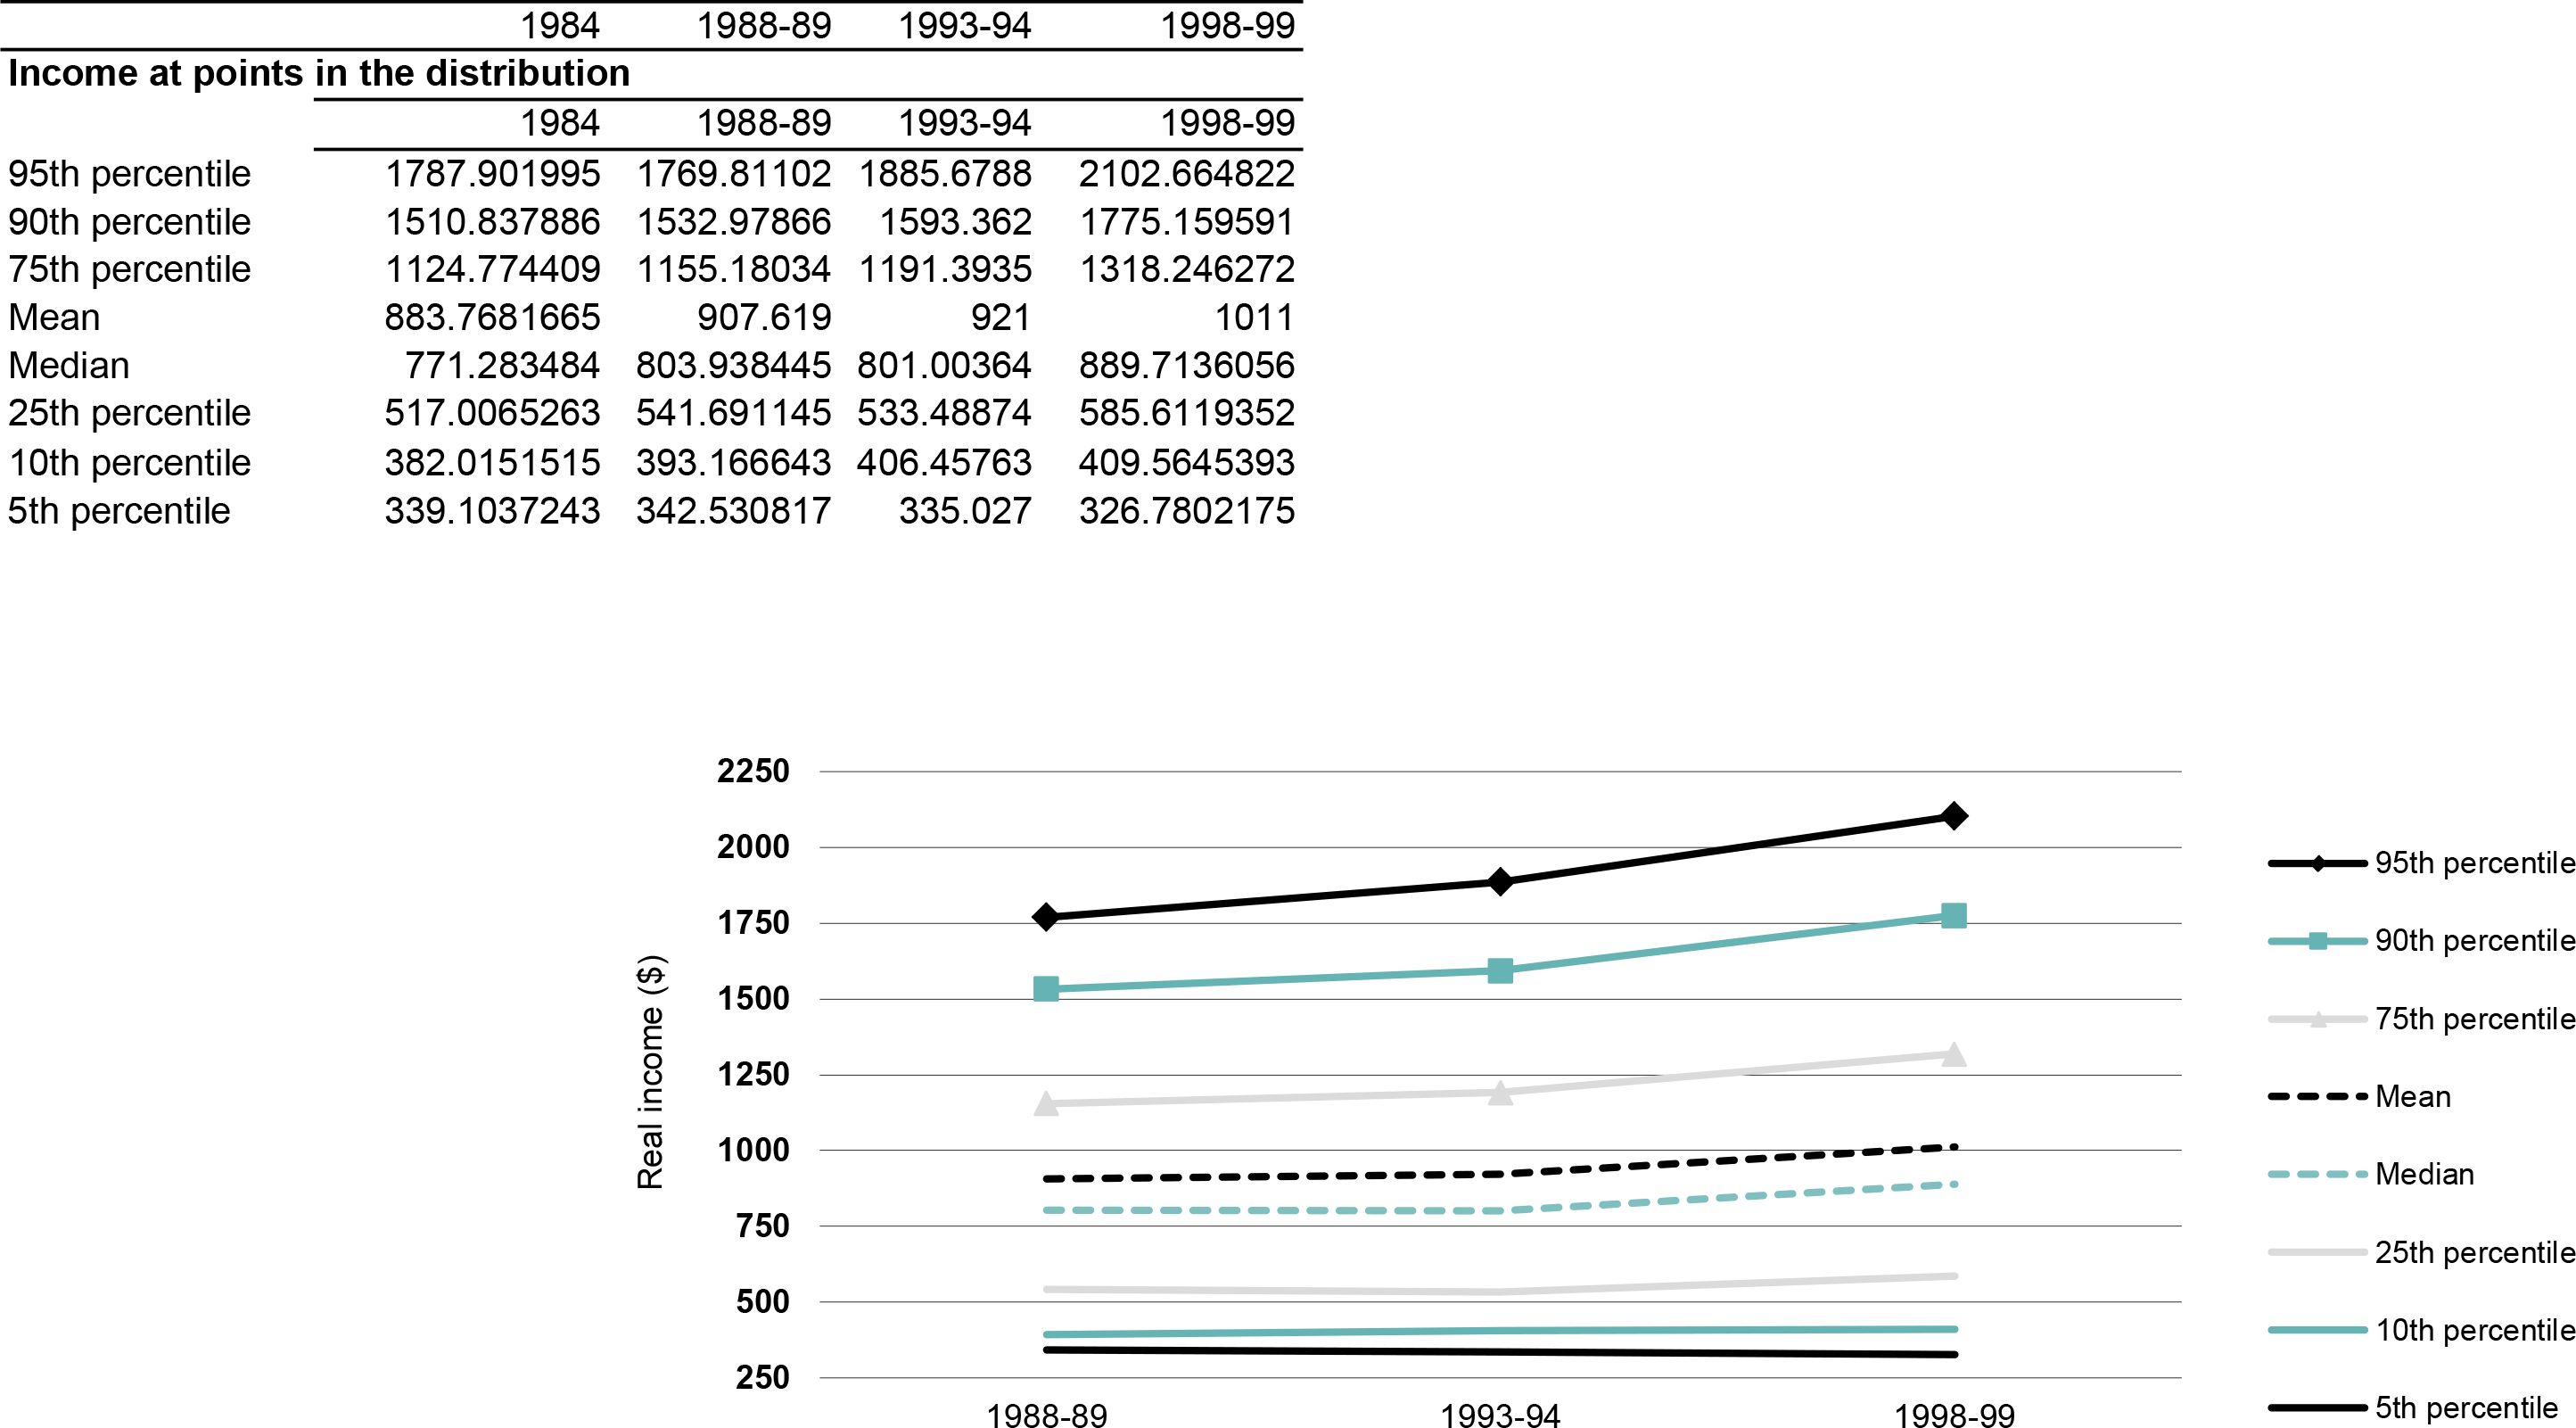
Real incomes at different points in the income distribution, Household Expenditure Surveys 1988-89, 1993-94 and 1998-99.. Note: The income measure is the International equivalent weekly disposable household income of individuals. All incomes have been adjusted for inflation to March 2001 dollars.Data source: ABS Household Expenditure Survey unit record files.

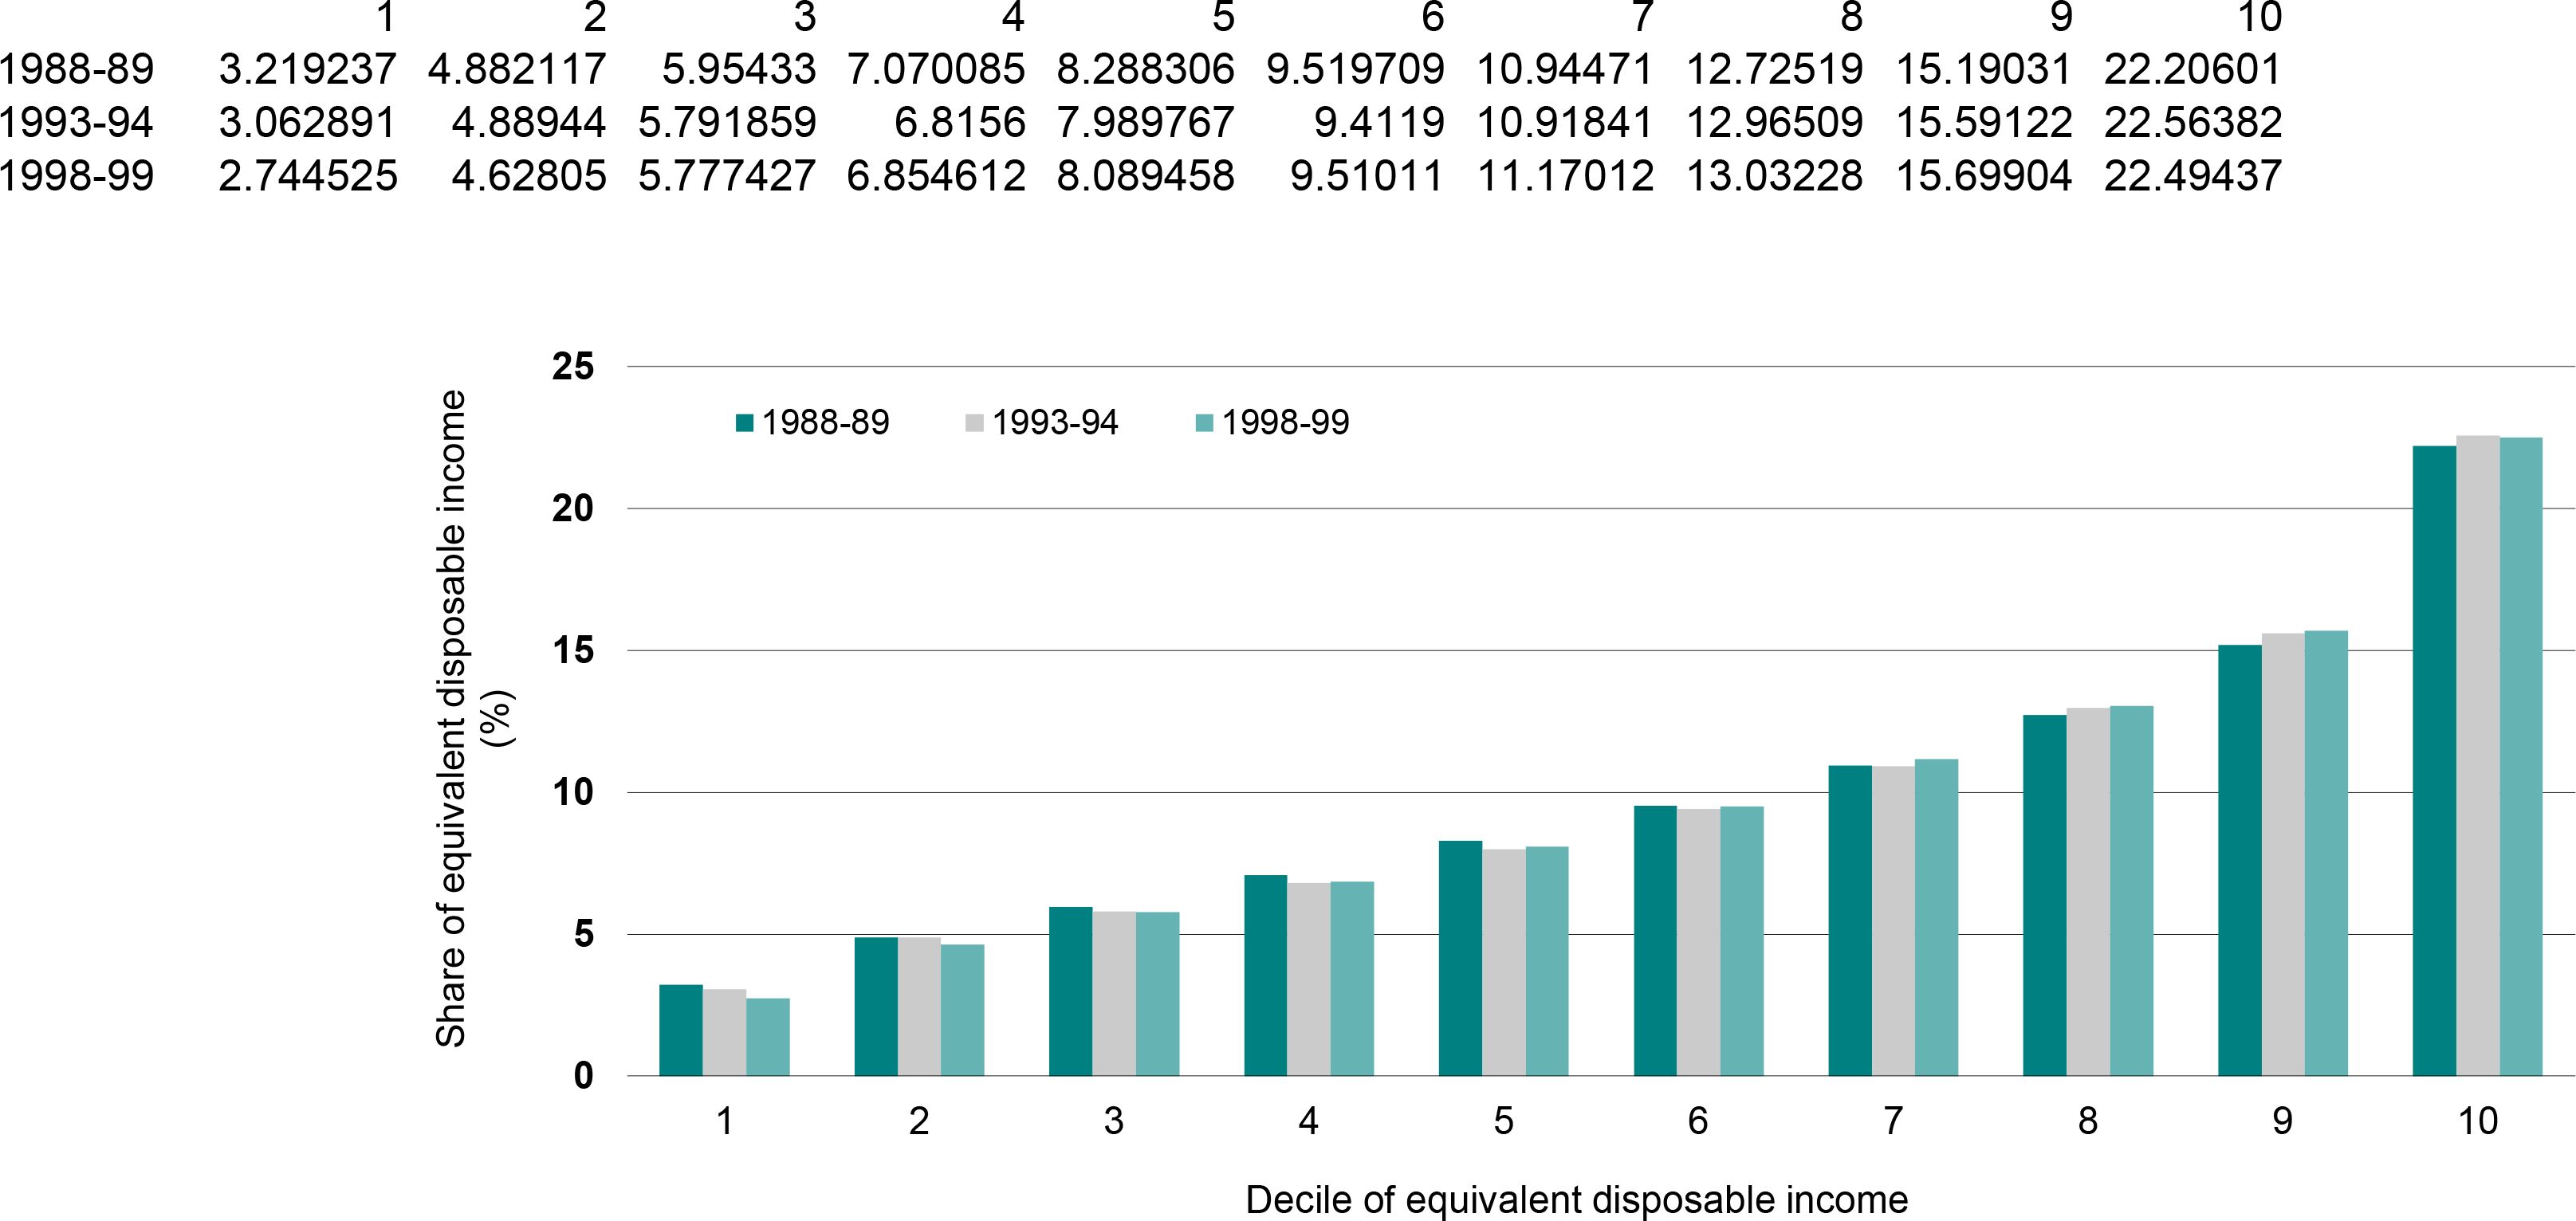
Share of equivalent disposable income by income decile, Household Expenditure Surveys 1988-89, 1993-94 and 1998-99.. Note: The income measure is the international equivalent weekly disposable household income of individuals. All incomes have been adjusted for inflation to March 2001 dollars.Data source: ABS Household Expenditure Survey unit record files.

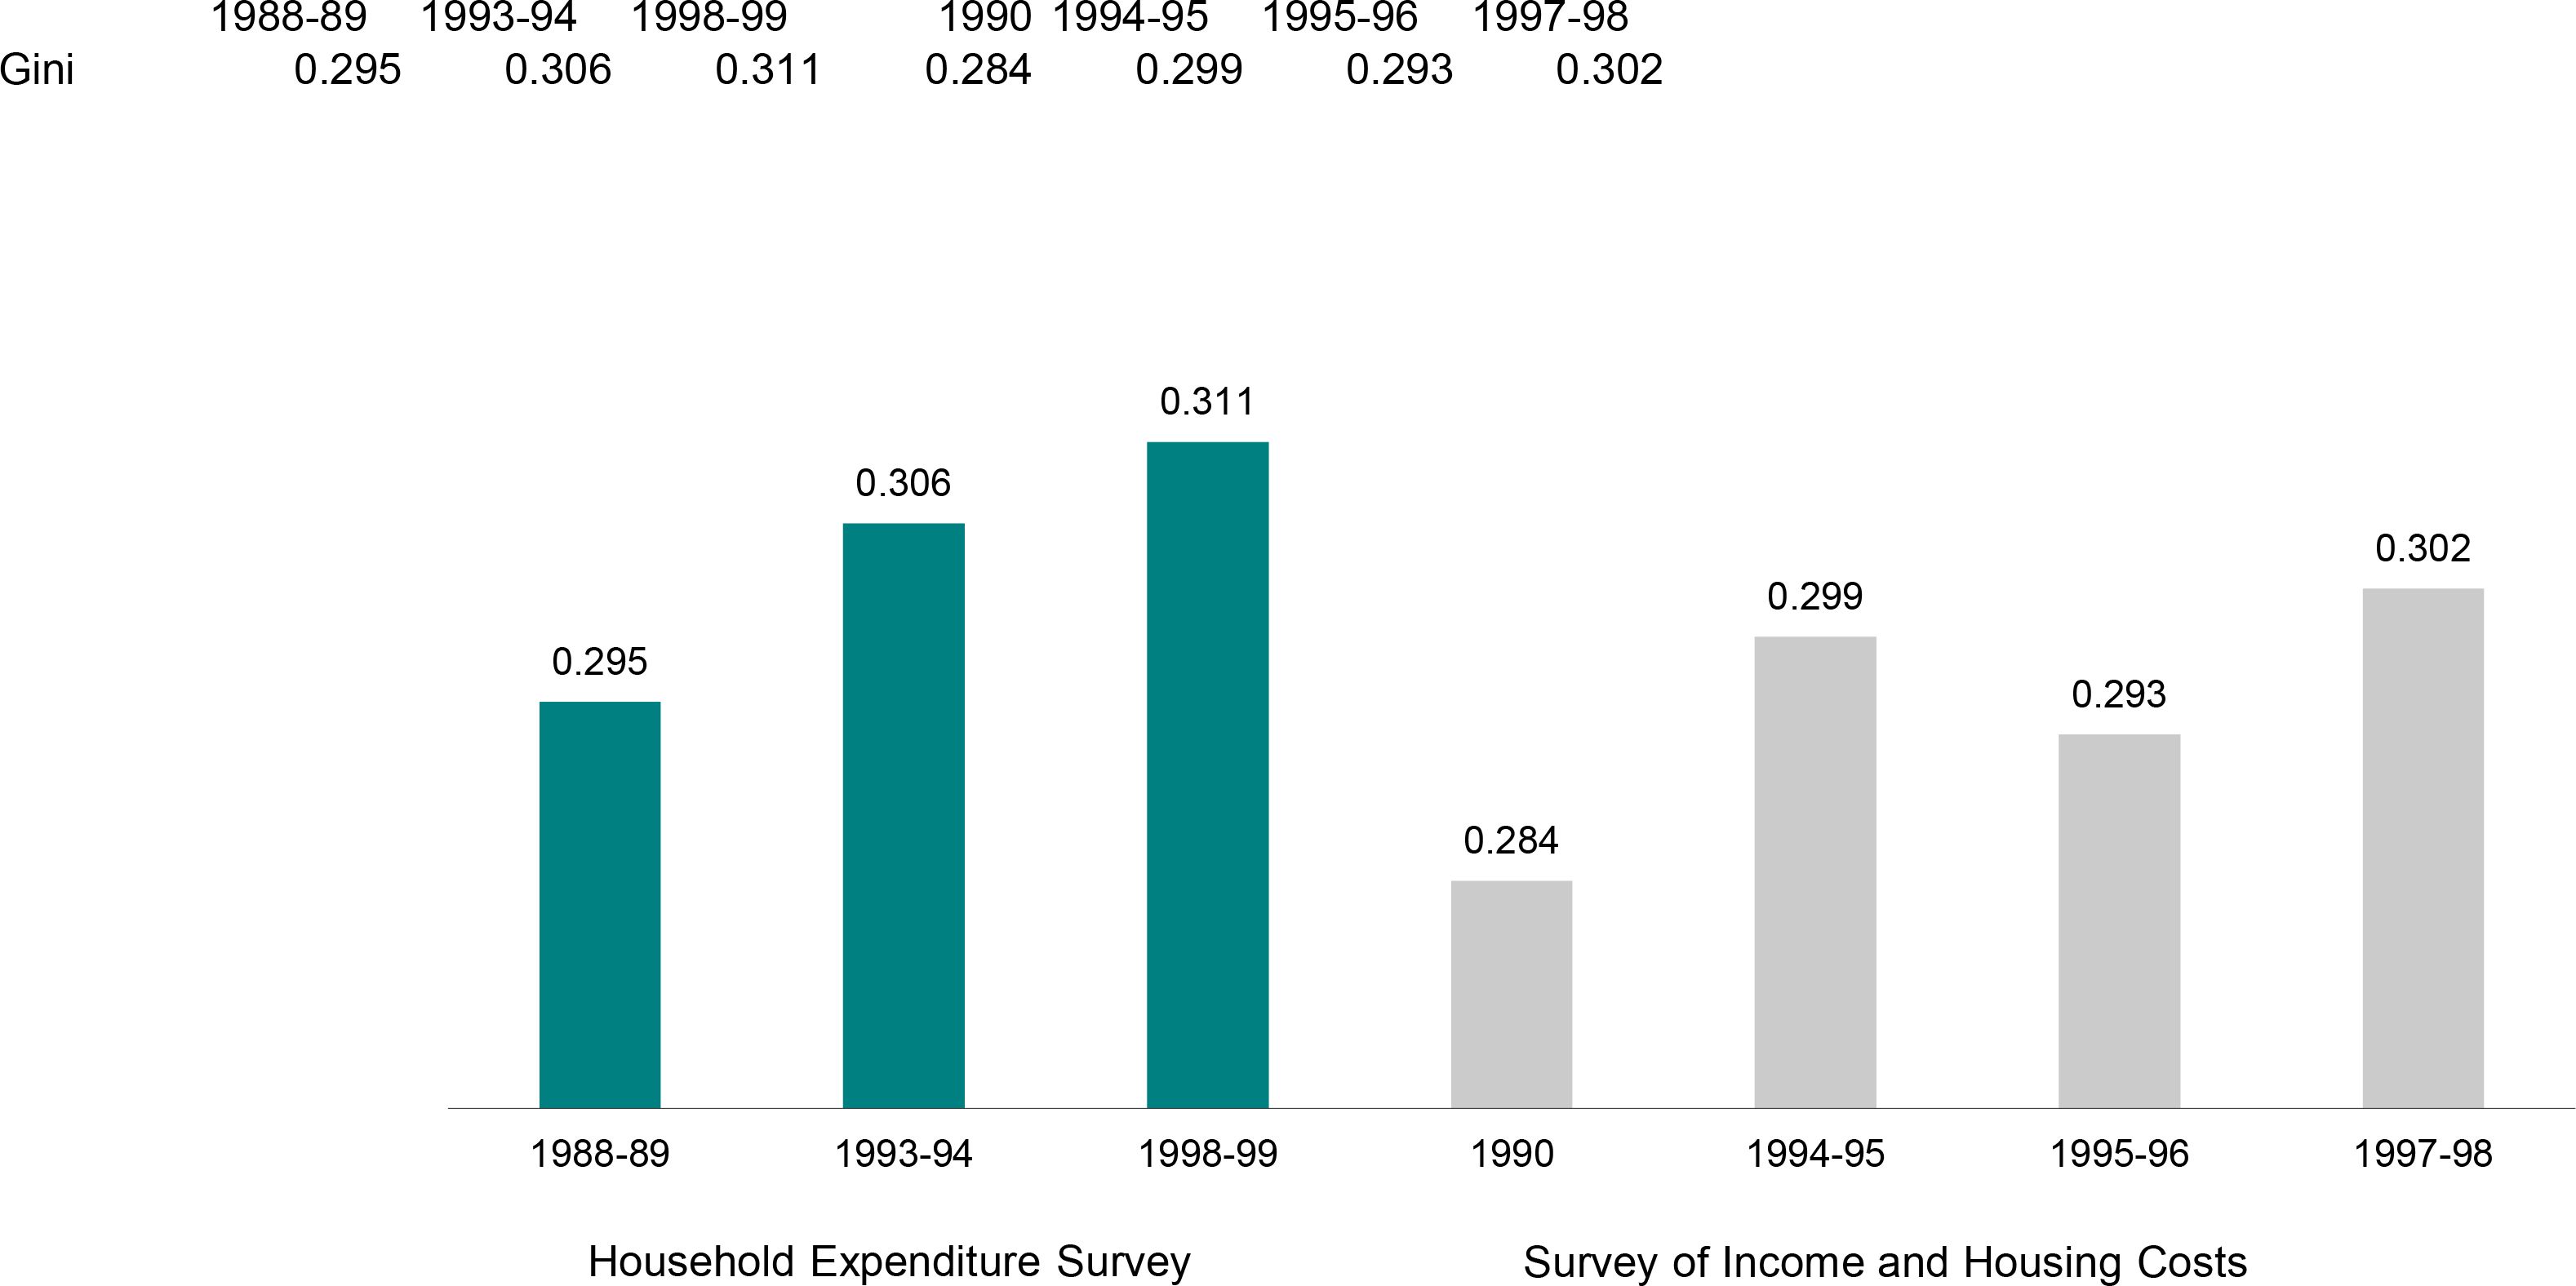
Gini coefficients for equivalent disposable household income from the expenditure and income surveys.. Note: The Lorenz curves cross for the Household Expenditure Survey between 1993-94 and 1998-99 and for the Survey of Income and Housing Costs between 1994-95 and 1997-98. Consequently, no conclusion can be drawn about the change in inequality during these periods.Data source: ABS Household Expenditure Survey and Survey of Income and Housing Costs unit record files.
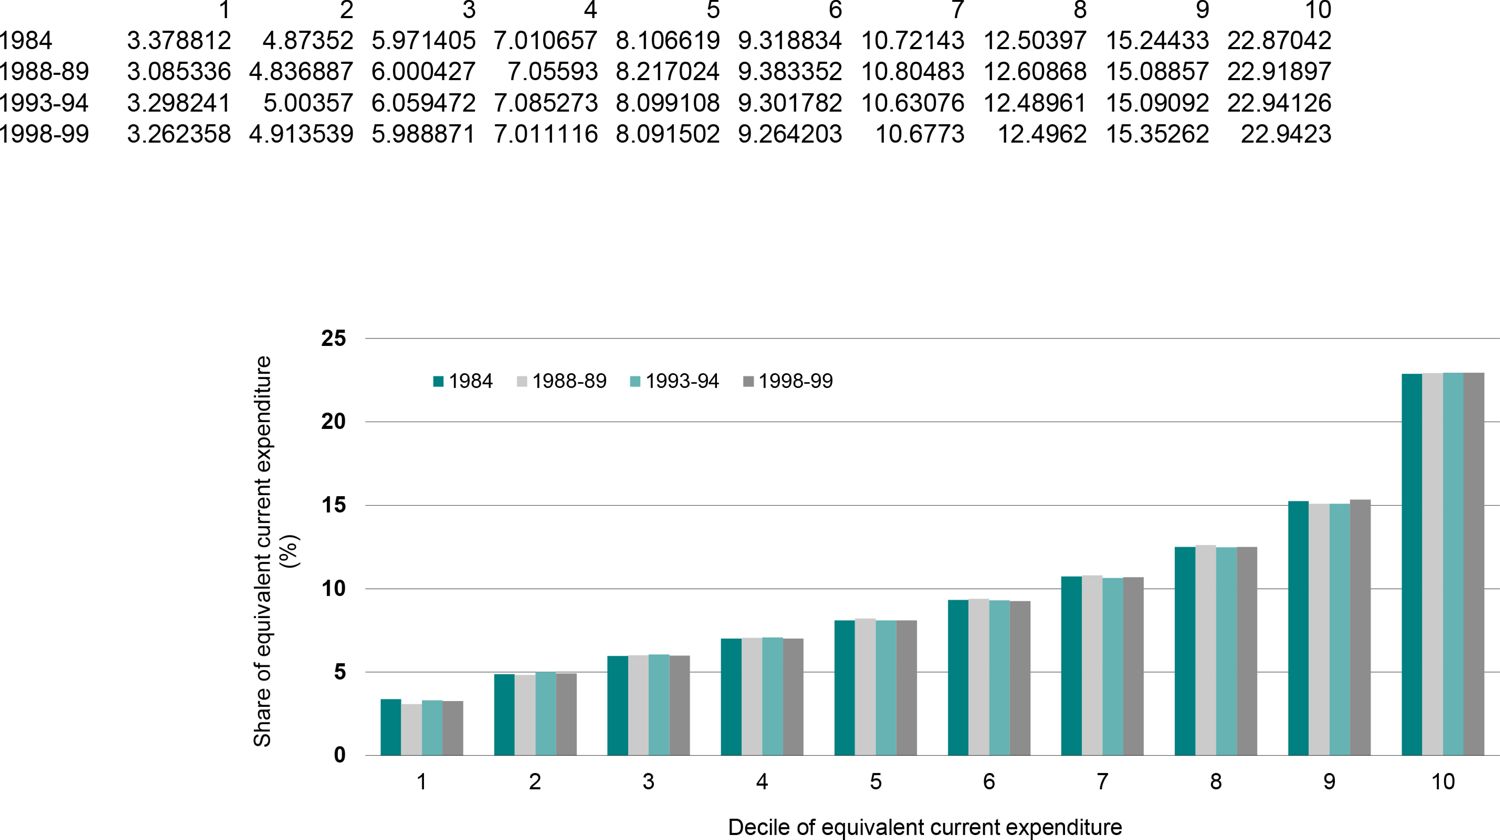
Share of equivalent current expenditure, by decile of equivalent current expenditure.. Note: Deciles are constructed by ranking all Australians by the equivalent current expenditure of their household.Data source: ABS Household Expenditure Survey unit record files.
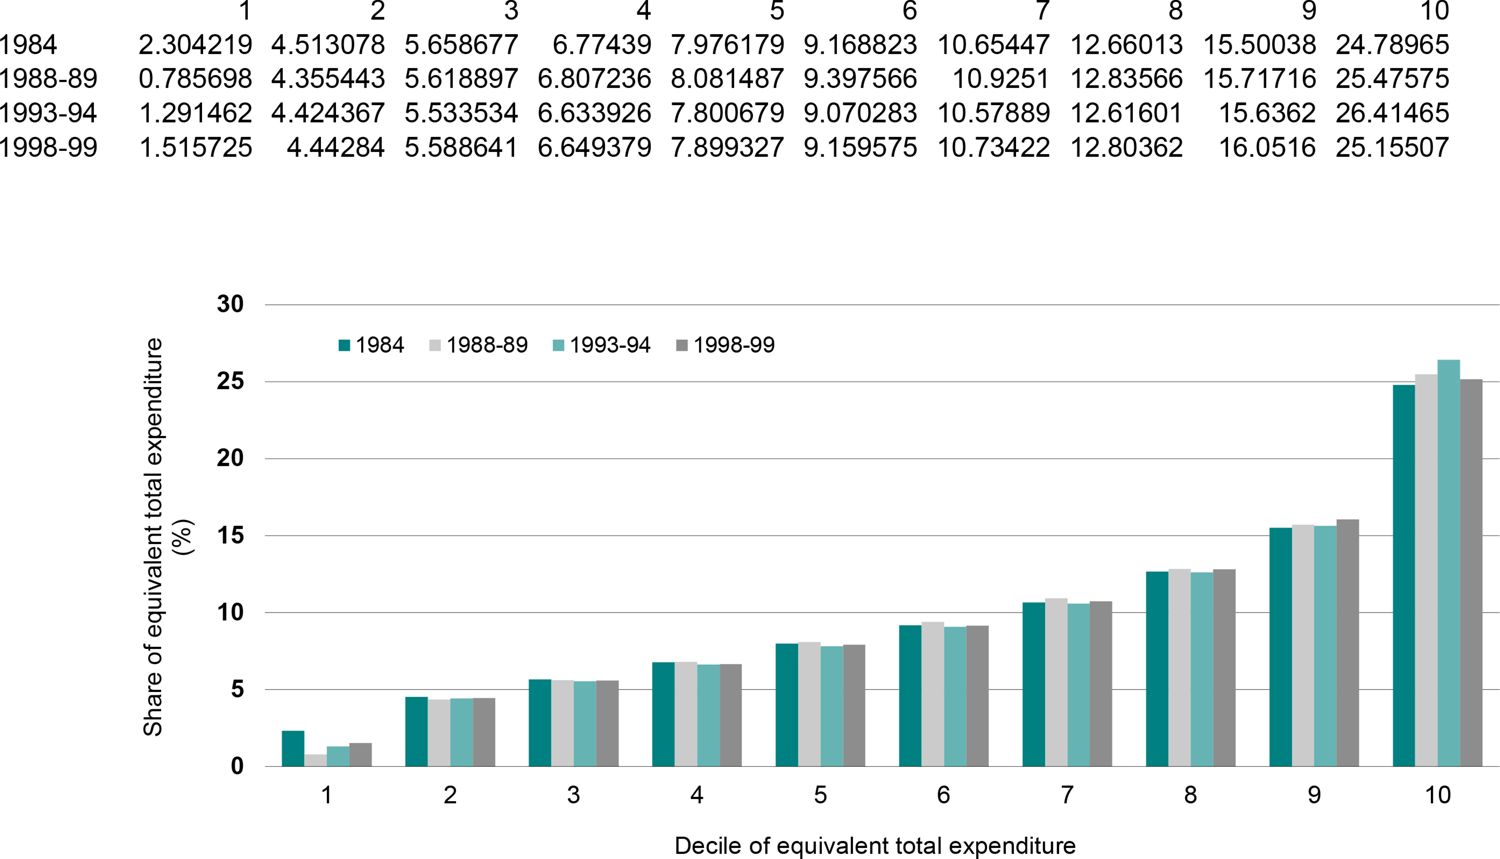
Share of equivalent total expenditure, by decile of equivalent total expenditure.. Note: Deciles are constructed by ranking all Australians by the equivalent total expenditure of their household.Data source: ABS Household Expenditure Survey unit record files.
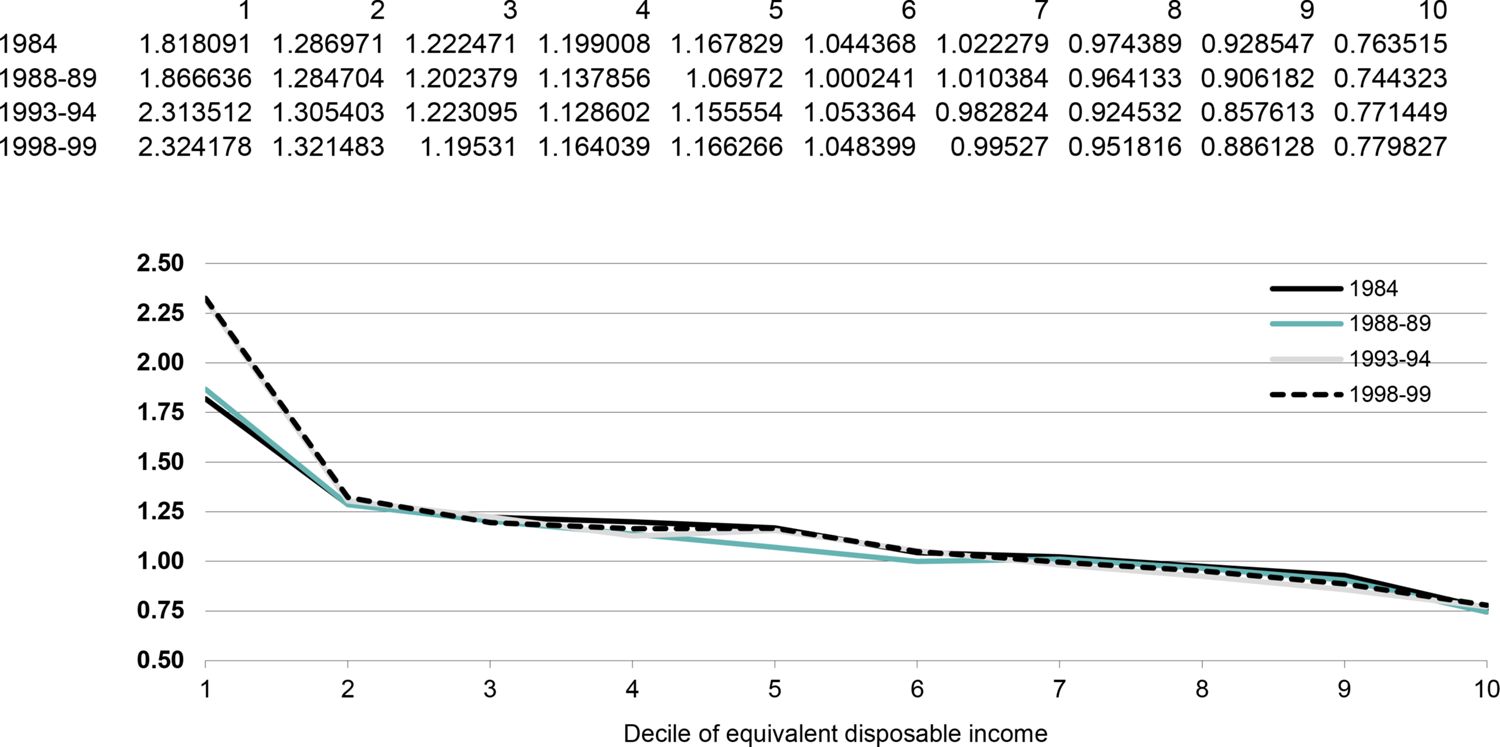
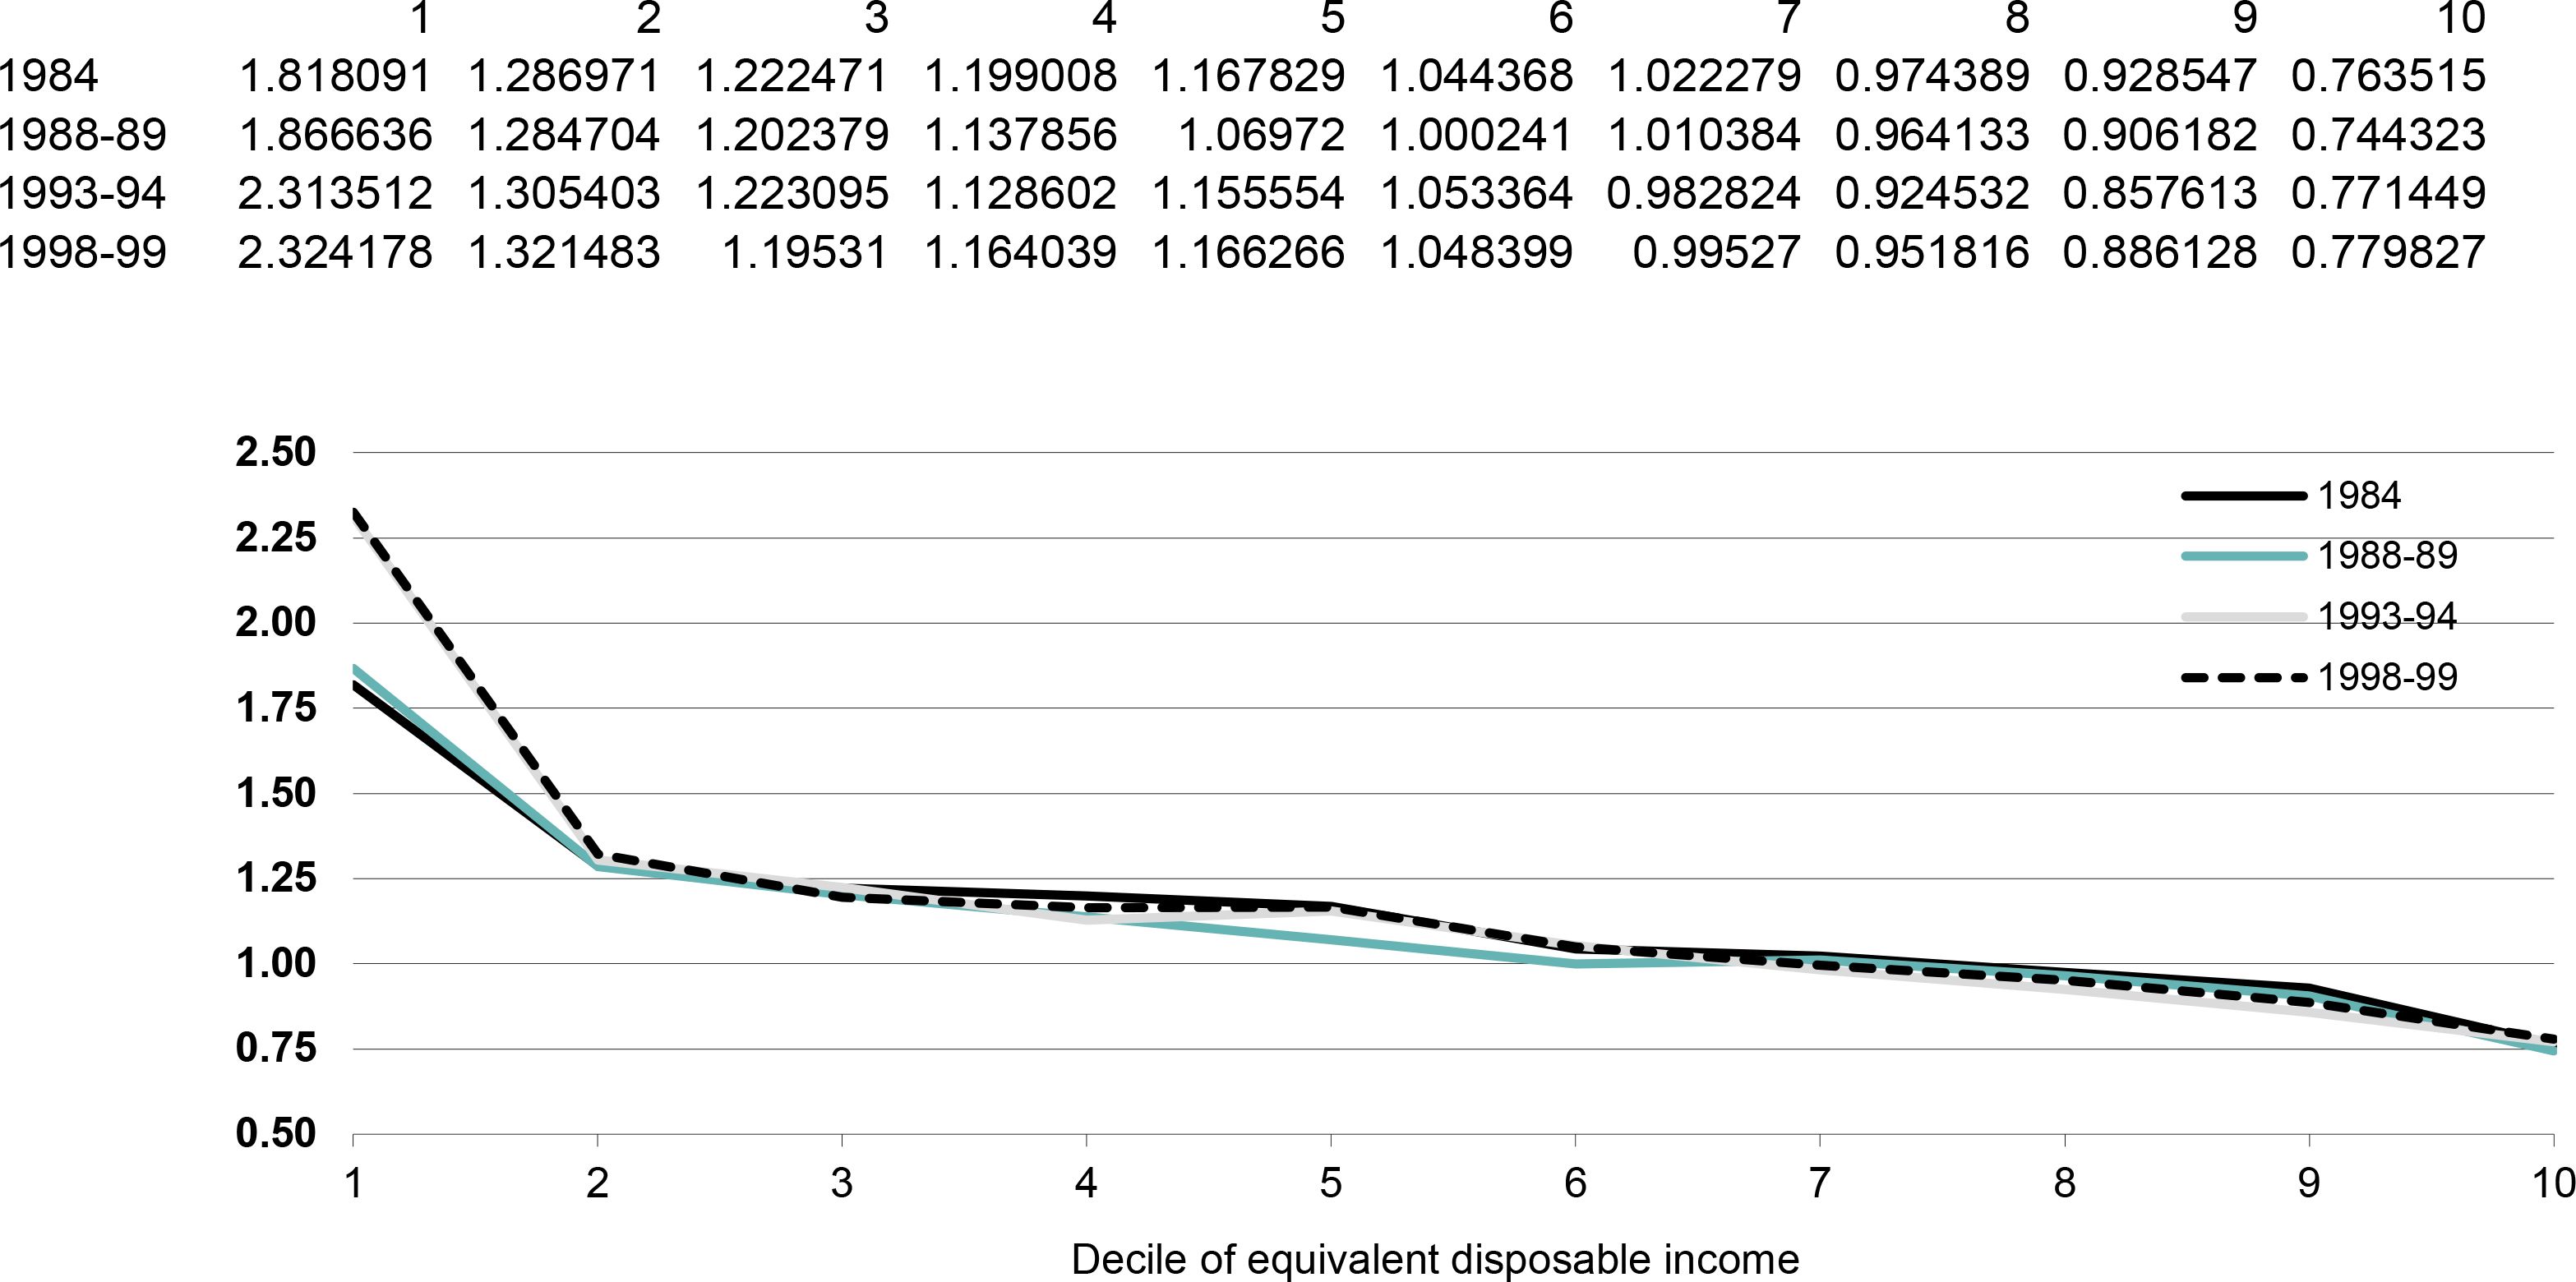
Ratio of equivalent current expenditure to equivalent disposable income, by decile of equivalent disposable income.. Note: Deciles are constructed by ranking all Australians by the equivalent disposable income of their household.Data source: ABS Household Expenditure Survey unit record files.
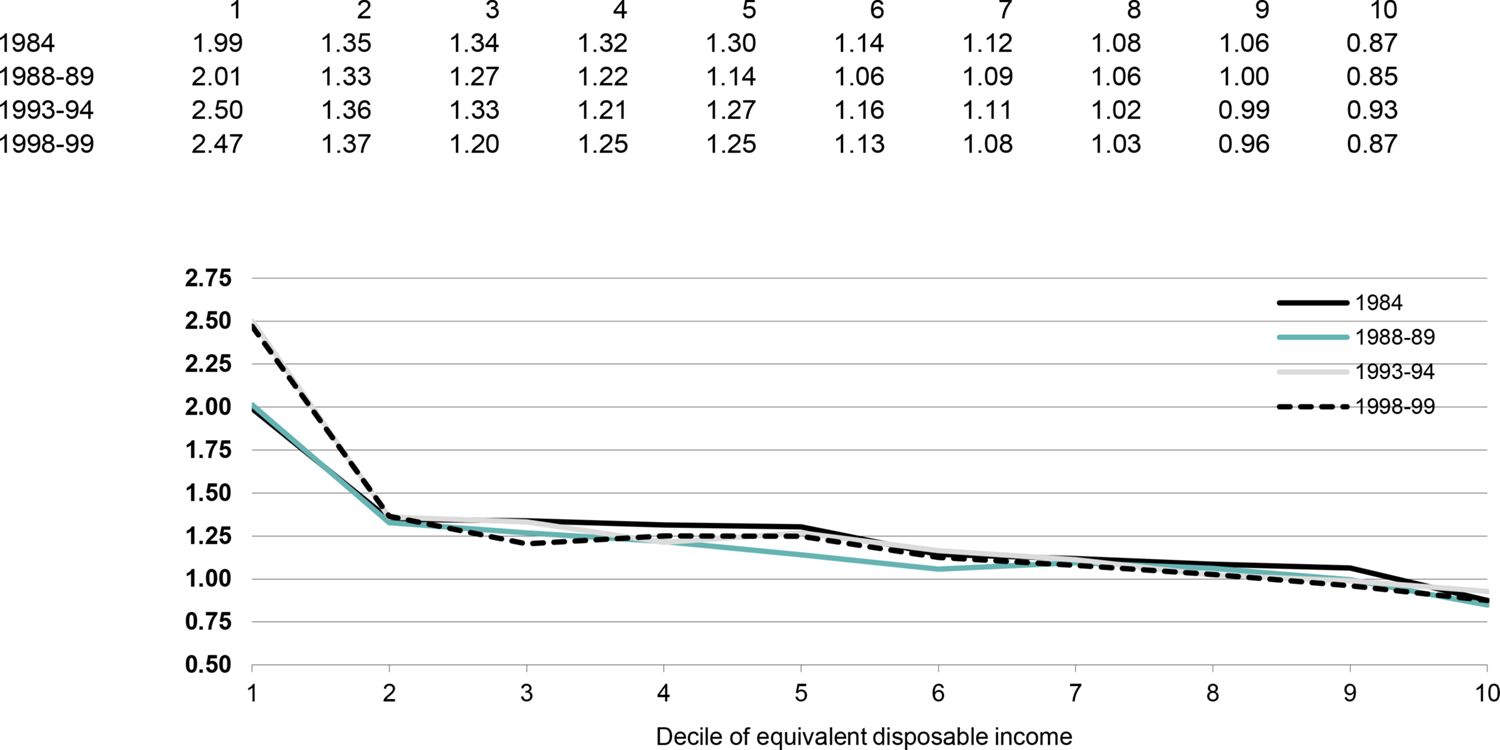
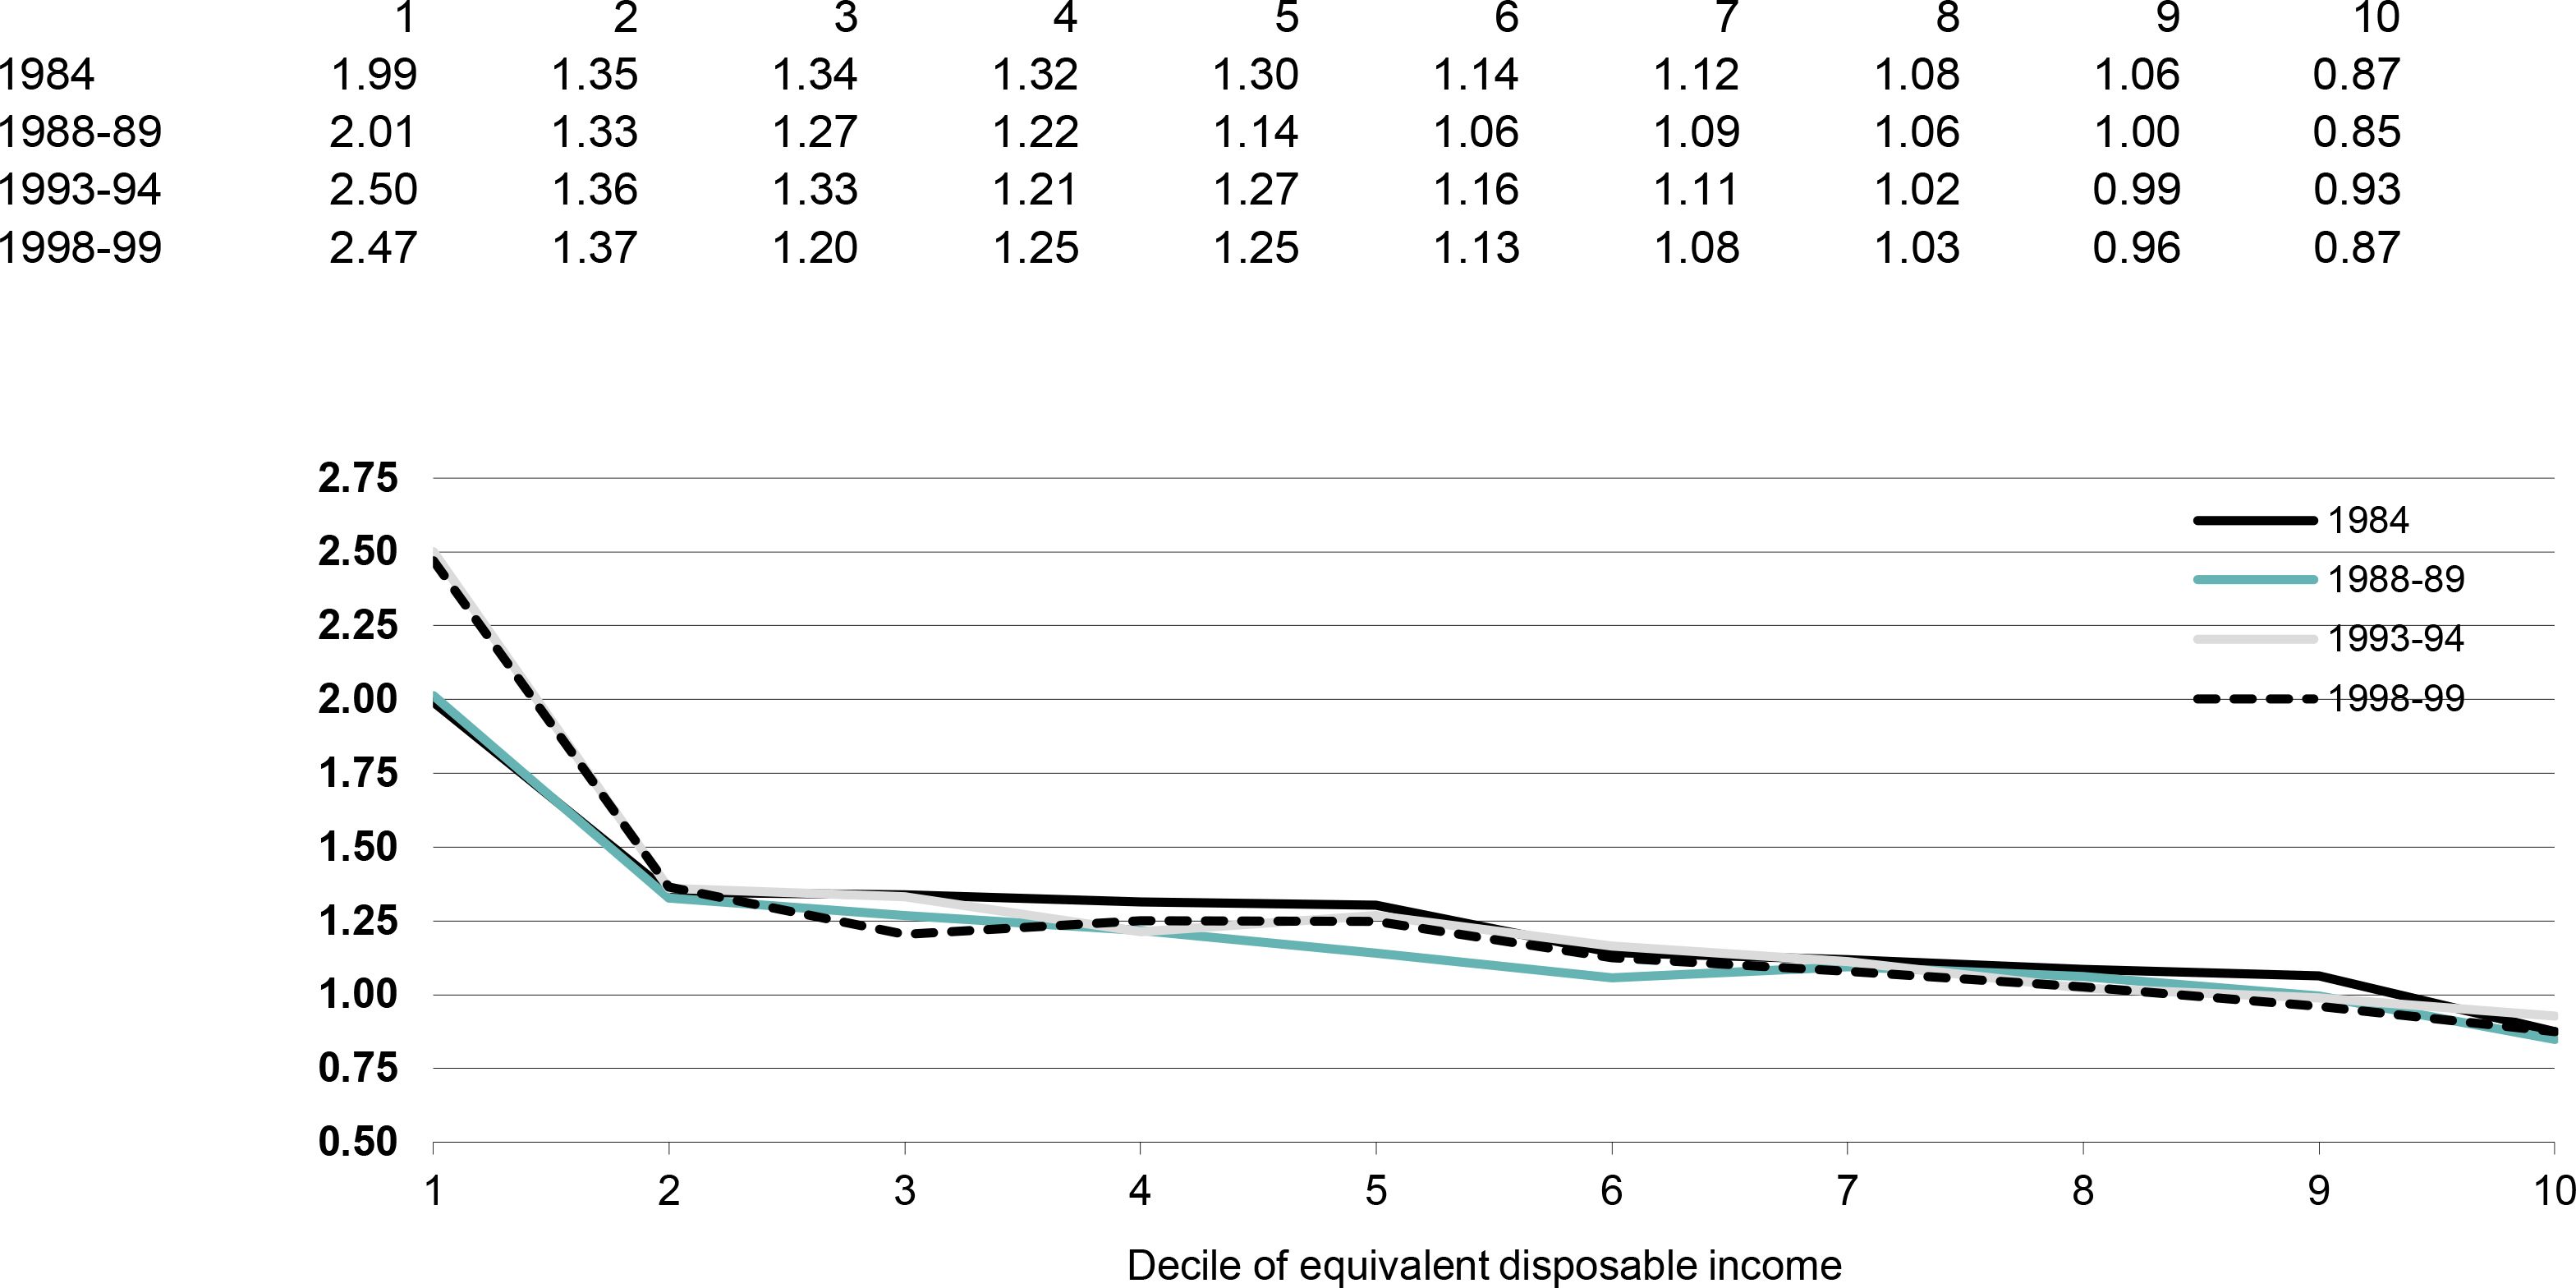
Ratio of equivalent total expenditure to equivalent disposable income, by decile of equivalent disposable income.. Note: Deciles are constructed by ranking all Australians by the equivalent disposable income of their household.Data source: ABS Household Expenditure Survey unit record files.
Tables
Indicators of income inequality from Household Expenditure Surveys
| 1984* | 1988-89 | 1993-94 | 1998-99 | Change 1988-89 to 1998-99 | |
|---|---|---|---|---|---|
| Income at points in the distribution | $ | $ | $ | $ | % |
| 95th percentile | 1 788 | 1 770 | 1 886 | 2 103 | 18.8 |
| 90th percentile | 1 511 | 1 533 | 1 593 | 1 775 | 15.8 |
| 75th percentile | 1 125 | 1 155 | 1 191 | 1 318 | 14.1 |
| Mean | 884 | 908 | 921 | 1 011 | 11.4 |
| Median | 771 | 804 | 801 | 890 | 10.7 |
| 25th percentile | 517 | 542 | 533 | 586 | 8.1 |
| 10th percentile | 382 | 393 | 406 | 410 | 4.2 |
| 5th percentile | 339 | 343 | 335 | 327 | -4.6 |
| Percentile income ratios | |||||
| 95:10 (very top:bottom) | 4.63 | 4.50 | 4.64 | 5.13 | 14.1 |
| 90:10 (top:bottom) | 4.01 | 3.90 | 3.92 | 4.33 | 11.2 |
| 90:50 (top:middle) | 1.99 | 1.91 | 1.99 | 2.00 | 4.6 |
| 50:10 (middle:bottom) | 2.02 | 2.04 | 1.97 | 2.17 | 6.2 |
| Decile shares of income | % | % | % | % | |
| Bottom 10% | 3.4 | 3.2 | 3.1 | 2.7 | -14.7 |
| Middle 20% | 17.6 | 17.8 | 17.4 | 17.6 | -1.2 |
| Top 10% | 22.4 | 22.2 | 22.6 | 22.5 | 1.3 |
| Unemployment rate | 9.0 | 6.4 | 10.2 | 7.4 | 15.6 |
-
Note: The income measure is the international equivalent weekly disposable household income of individuals. All incomes have been adjusted for inflation to March 2001 dollars. The 95:10 ratio is the ratio of the income of the 95th percentile of the income distribution to the income of the 10th percentile of the income distribution.
-
Source: ABS Household Expenditure Survey unit record files.
-
*
The 1984 figures are not fully comparable and should be interpreted with caution because the method for imputing income tax differs in that year. See appendix A for details.
Indicators of income inequality from income surveys
| 1990 | 1994-95 | 1995-96 | 1997-98 | Change 1990 to 1997-98 | |
|---|---|---|---|---|---|
| Income at points in the distribution | $ | $ | $ | $ | % |
| 95th percentile | 1 967 | 2 021 | 1 959 | 2 121 | 7.9 |
| 90th percentile | 1 709 | 1 722 | 1 672 | 1 843 | 7.8 |
| 75th percentile | 1 326 | 1 314 | 1 310 | 1 390 | 4.9 |
| Mean | 1 025 | 1 019 | 998 | 1 073 | 4.7 |
| Median | 944 | 925 | 912 | 956 | 1.3 |
| 25th percentile | 624 | 597 | 589 | 625 | 0.1 |
| 10th percentile | 443 | 424 | 417 | 449 | 1.5 |
| 5th percentile | 364 | 354 | 348 | 376 | 3.2 |
| Ratios | |||||
| 95:10 (very top:bottom) | 4.44 | 4.77 | 4.69 | 4.72 | 6.3 |
| 90:10 (top:bottom) | 3.86 | 4.06 | 4.01 | 4.10 | 6.3 |
| 90:50 (top:middle) | 1.81 | 1.86 | 1.83 | 1.93 | 6.4 |
| 50:10 (middle:bottom) | 2.13 | 2.18 | 2.18 | 2.13 | -0.1 |
| Decile shares | % | % | % | % | |
| Bottom 10% | 3.1 | 3.0 | 3.1 | 3.0 | -3.1 |
| Middle 20% | 18.3 | 18.2 | 18.2 | 17.8 | -2.7 |
| Top 10% | 20.9 | 22.0 | 21.4 | 22.0 | 5.6 |
-
Note: The Lorenz curves cross between 1994-95 and 1997-98. Consequently, no conclusion can be drawn about the change in inequality during this period. All incomes have been adjusted for inflation to March 2001 dollars. The income measure is the international equivalent weekly disposable household income of individuals.
-
Source: ABS Household Expenditure Survey and income survey unit record files.
Gini coefficients and shares for expenditure and income
| 1984 | 1988-89 | 1993-94 | 1998-99 | Change 1984 to 1998-99 | |
|---|---|---|---|---|---|
| Gini coefficients* | % | ||||
| Equivalent disposable income | 0.298 | 0.295 | 0.306 | 0.311 | 4.4 |
| Equivalent current expenditure | 0.298 | 0.301 | 0.297 | 0.302 | 1.3 |
| Equivalent total expenditure | 0.334 | 0.360 | 0.362 | 0.351 | 5.1 |
| Equivalent non-durable expenditure† | na | 0.275 | 0.271 | 0.277 | 0.7 |
| Share of bottom quintile | % | % | % | % | |
| Disposable income | 8.2 | 8.1 | 8.0 | 7.4 | -10.3 |
| Current expenditure | 8.3 | 7.9 | 8.3 | 8.2 | -0.9 |
| Total expenditure | 6.8 | 5.1 | 5.7 | 6.0 | -12.6 |
| Share of middle quintile | % | % | % | % | |
| Disposable income | 17.6 | 17.8 | 17.4 | 17.6 | -0.3 |
| Current expenditure | 17.4 | 17.6 | 17.4 | 17.4 | -0.4 |
| Total expenditure | 17.1 | 17.5 | 16.9 | 17.1 | -0.5 |
| Share of top quintile | % | % | % | % | |
| Disposable income | 37.8 | 37.4 | 38.2 | 38.2 | 1.1 |
| Current expenditure | 38.1 | 38.0 | 38.0 | 38.3 | 0.5 |
| Total expenditure | 40.3 | 41.2 | 42.0 | 41.2 | 2.3 |
-
Note: The income and expenditure measures are the international equivalent disposable household income and expenditure of individuals.
-
Source: ABS Household Expenditure Survey unit record files.
-
*
The Lorenz curves cross in the following cases: for disposable income between 1993-94 and 1998-99; for current expenditure for all cases except between 1984 and 1998-99; and for total expenditure between 1988-89 and 1993-94, between 1988-89 and 1998-99 and between 1993-94 and 1998-99. Consequently, no conclusion can be drawn about the change in inequality during these periods.
-
†
Durable items are defined in appendix B. Non-durables items are all other items. Note that the Lorenz curves for non-durable expenditure have not been checked to determine whether they cross.
Proportion of people in deciles of current and current non-durable expenditure, 1998-99
| Decile of equivalent current non-durable expenditure* | ||||||||||
|---|---|---|---|---|---|---|---|---|---|---|
| 1 | 2 | 3 | 4 | 5 | 6 | 7 | 8 | 9 | 10 | |
| Decile of equivalent current expenditure | % | % | % | % | % | % | % | % | % | % |
| 1 | 8.57 | 1.30 | 0.04 | 0.03 | 0.01 | 0.02 | 0.00 | 0.00 | 0.01 | 0.01 |
| 2 | 0.70 | 6.03 | 3.11 | 0.11 | 0.02 | 0.01 | 0.03 | 0.00 | 0.00 | 0.00 |
| 3 | 0.16 | 1.48 | 4.40 | 3.92 | 0.02 | 0.00 | 0.01 | 0.00 | 0.00 | 0.00 |
| 4 | 0.18 | 0.58 | 0.97 | 3.44 | 4.65 | 0.16 | 0.00 | 0.01 | 0.00 | 0.00 |
| 5 | 0.07 | 0.18 | 0.63 | 1.14 | 3.06 | 4.57 | 0.34 | 0.01 | 0.00 | 0.00 |
| 6 | 0.11 | 0.18 | 0.39 | 0.72 | 0.94 | 2.91 | 4.47 | 0.29 | 0.00 | 0.00 |
| 7 | 0.09 | 0.10 | 0.27 | 0.30 | 0.70 | 1.09 | 2.68 | 4.55 | 0.20 | 0.00 |
| 8 | 0.06 | 0.07 | 0.11 | 0.15 | 0.39 | 0.70 | 1.54 | 2.85 | 4.10 | 0.01 |
| 9 | 0.02 | 0.10 | 0.03 | 0.10 | 0.13 | 0.39 | 0.77 | 1.68 | 4.12 | 2.65 |
| 10 | 0.00 | 0.01 | 0.04 | 0.05 | 0.10 | 0.14 | 0.18 | 0.59 | 1.56 | 7.36 |
-
Note: Expenditure measures are the international equivalent disposable household expenditure of individuals.
-
Source: 1998-99 ABS Household Expenditure Survey unit record file.
-
*
Durable items are defined in appendix B. Non-durable items are all other current expenditure items.
Sensitivity to unit of analysis: household and income unit Income survey data
| 1982* | 1990 | 1994-95 | 1995-96 | 1996-97* | 1997-98 | ||
|---|---|---|---|---|---|---|---|
| International | Household | 0.285 | 0.284 | 0.299 | 0.293 | 0.292 | 0.302 |
| Income unit | 0.312 | 0.314 | 0.322 | 0.322 | 0.315 | 0.327 | |
| OECD | Household | 0.271 | 0.274 | 0.288 | 0.283 | 0.278 | 0.289 |
| Income unit | 0.311 | 0.311 | 0.319 | 0.319 | 0.312 | 0.325 |
-
Note: Negative incomes have been set to zero.
-
Source: Income Distribution Survey and Survey of Income and Housing Costs unit record files.
-
*
Data from 1982 and 1996-97 have not been included in the body of this paper due to concerns about their quality. These data have been reported here for transparency but should be interpreted with caution.
Sensitivity to data source: HES and SIHC
| HES 1988-89 | IDS 1990 | HES 1993-94 | SIHC 1994-95 | SIHC 1997-98 | HES 1998-99 | |
|---|---|---|---|---|---|---|
| International equivalent | 0.295 | 0.284 | 0.306 | 0.299 | 0.302 | 0.311 |
-
Note: Results for the income and expenditure surveys have been calculated at the household-level and negative incomes were reset to zero in all cases.
-
Source: Income Distribution Survey, Survey of Income and Housing Costs and Household Expenditure Survey unit record files.
Average number of people and children per household, SIHC and HES
| SIHC 1994-95 | SIHC 1995-96 | SIHC 1996-97 | SIHC 1997-98 | HES 1993-94 | HES 1998-99 | |
|---|---|---|---|---|---|---|
| Persons | 2.84 | 2.83 | 2.88 | 2.86 | 2.63 | 2.60 |
| Dependent children (<18 years) | 0.59 | 0.59 | 0.59 | 0.59 | 0.69 | 0.66 |
-
Note: To avoid concerns about the quality of data on the number of dependent children in the 1993-94 HES, the standard ABS definition of dependent children was restricted to those aged 0–17 years inclusive.
-
Source: Survey of Income and Housing Costs and Household Expenditure Survey unit record files.
Sensitivity to equivalence scale: SIHC income-unit-level results
| 1982* | 1990 | 1994-95 | 1995-96 | 1996-97* | 1997-98 | |
|---|---|---|---|---|---|---|
| International | 0.312 | 0.314 | 0.322 | 0.322 | 0.315 | 0.327 |
| OECD | 0.311 | 0.311 | 0.319 | 0.319 | 0.312 | 0.325 |
| Simplified Henderson | 0.292 | 0.285 | 0.296 | 0.294 | 0.287 | 0.301 |
-
Note: Negative incomes have been set to zero. Source: Income Distribution Survey and Survey of Income and Housing Costs unit record files.
-
Source: Income Distribution Survey and Survey of Income and Housing Costs unit record files.
-
*
Data from 1982 and 1996-97 have not been included in the body of this paper due to concerns about data quality. Results from these data have been reported here for transparency but should be interpreted with caution.
Sensitivity to equivalence scale: HES household-level results
| 1984 | 1988-89 | 1993-94 | 1998-99 | |
|---|---|---|---|---|
| International | 0.298 | 0.295 | 0.306 | 0.311 |
| OECD* | 0.290 | 0.286 | 0.298 | 0.303 |
-
Note: Negative incomes have been set to zero.
-
Source: Household Expenditure Survey unit record files.
-
*
The OECD scale has been applied to ABS dependent children aged 0–17 years inclusive. This deviation from the ABS definition was adopted to avoid concerns about the quality of data on the number of dependent children in the 1993-94 HES.
Sensitivity to resetting negative incomes: SIHC household-level results
| 1994-95 | 1995-96 | 1996-97* | 1997-98 | ||
|---|---|---|---|---|---|
| International | Set to zero | 0.299 | 0.293 | 0.292 | 0.302 |
| Not set to zero | 0.306 | 0.299 | 0.297 | 0.306 | |
| OECD | Set to zero | 0.288 | 0.283 | 0.278 | 0.289 |
| Not set to zero | 0.295 | 0.289 | 0.282 | 0.293 |
-
Source: Survey of Income and Housing Costs Survey unit record files.
-
*
Data from 1996-97 have not been included in the body of this paper due to concerns about data quality. Results from this year have been reported here for transparency but should be interpreted with caution.
Data and code availability
Please contact the authors for information on data and code availability.