Women and Superannuation in the 21st Century: Poverty or Plenty?
- NATSEM, University of Canberra, Australia. This article was originally presented to the SPRC National Social Policy Conference at the University of New South Wales, 4-6 July 2001, and published by NATSEM as a technical paper.
Cite this article
as: S. Kelly, R. Percival, A. Harding; 2023; Women and Superannuation in the 21st Century: Poverty or Plenty?; International Journal of Microsimulation; 16(2); 54-72.
doi: 10.34196/ijm.00283
Figures
Figure 1

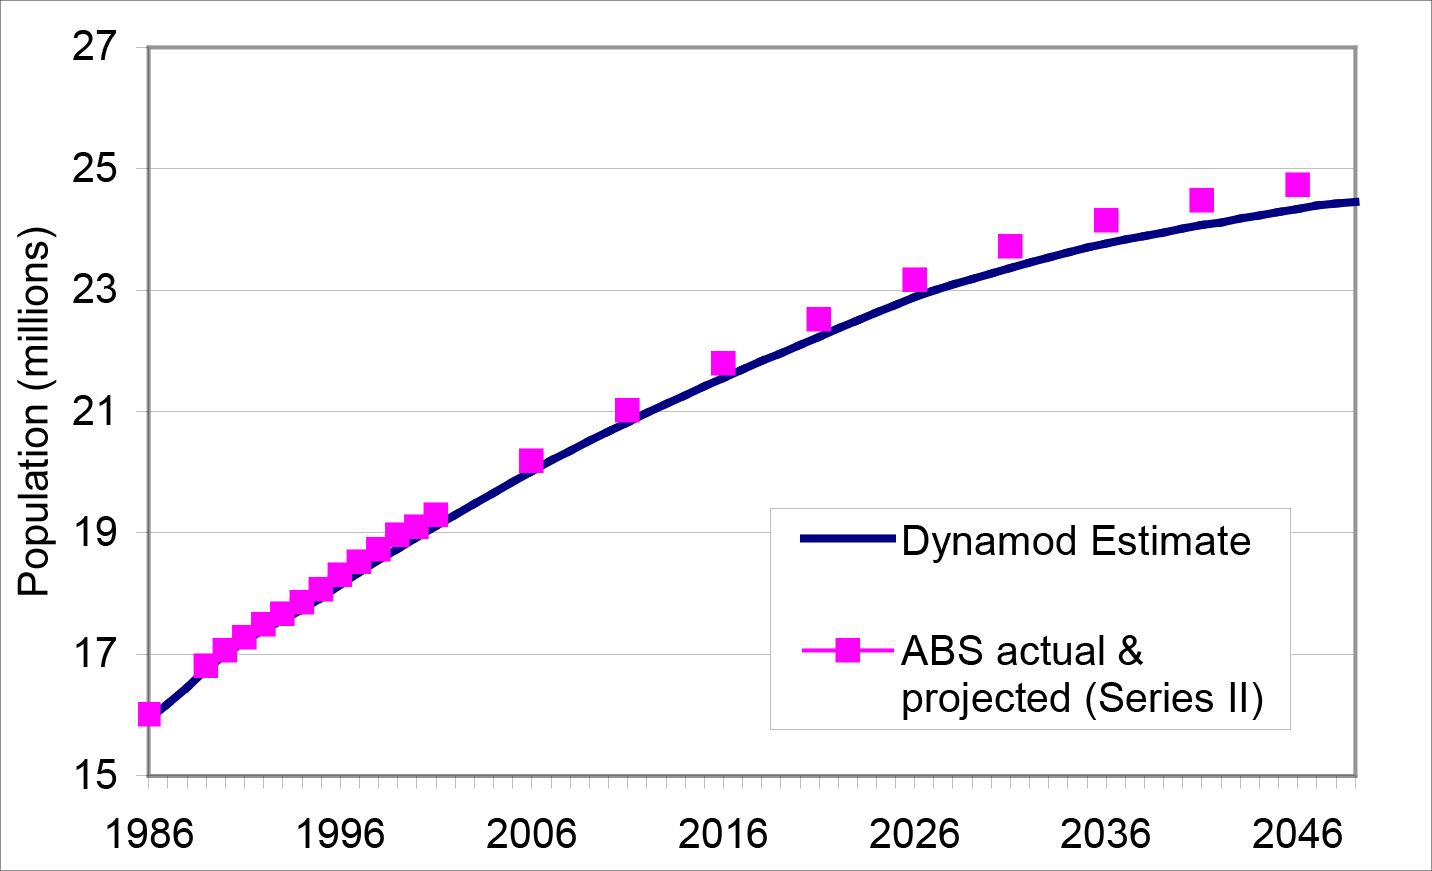
Australian Population – 1986-2050. Source: ABS 3222.0 Population Projections.
Figure 2

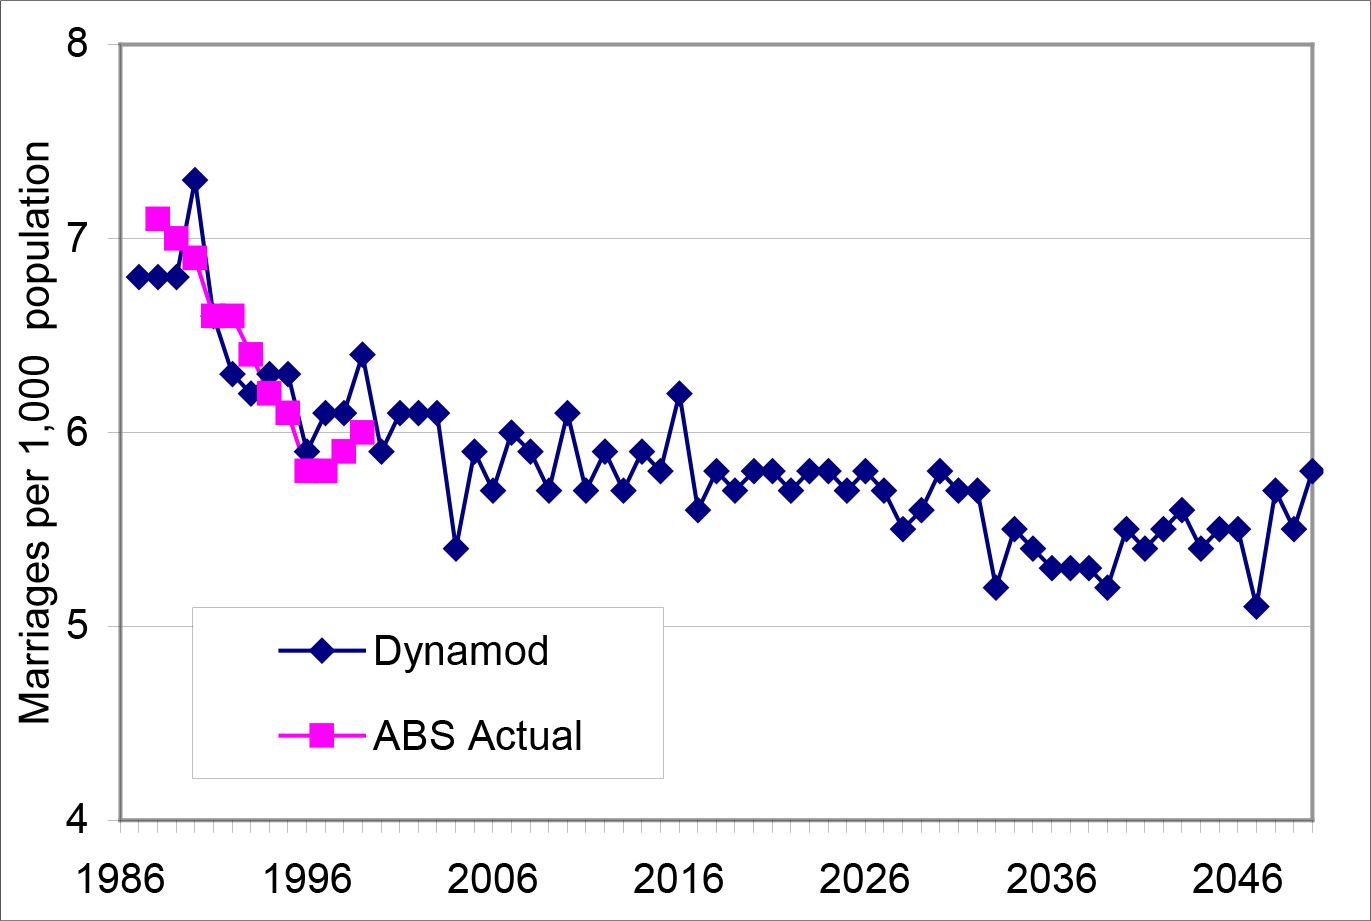
Australian Marriage Rate – 1986-2050. Source: ABS 3310.0 Marriages and Divorces 1999.
Figure 3
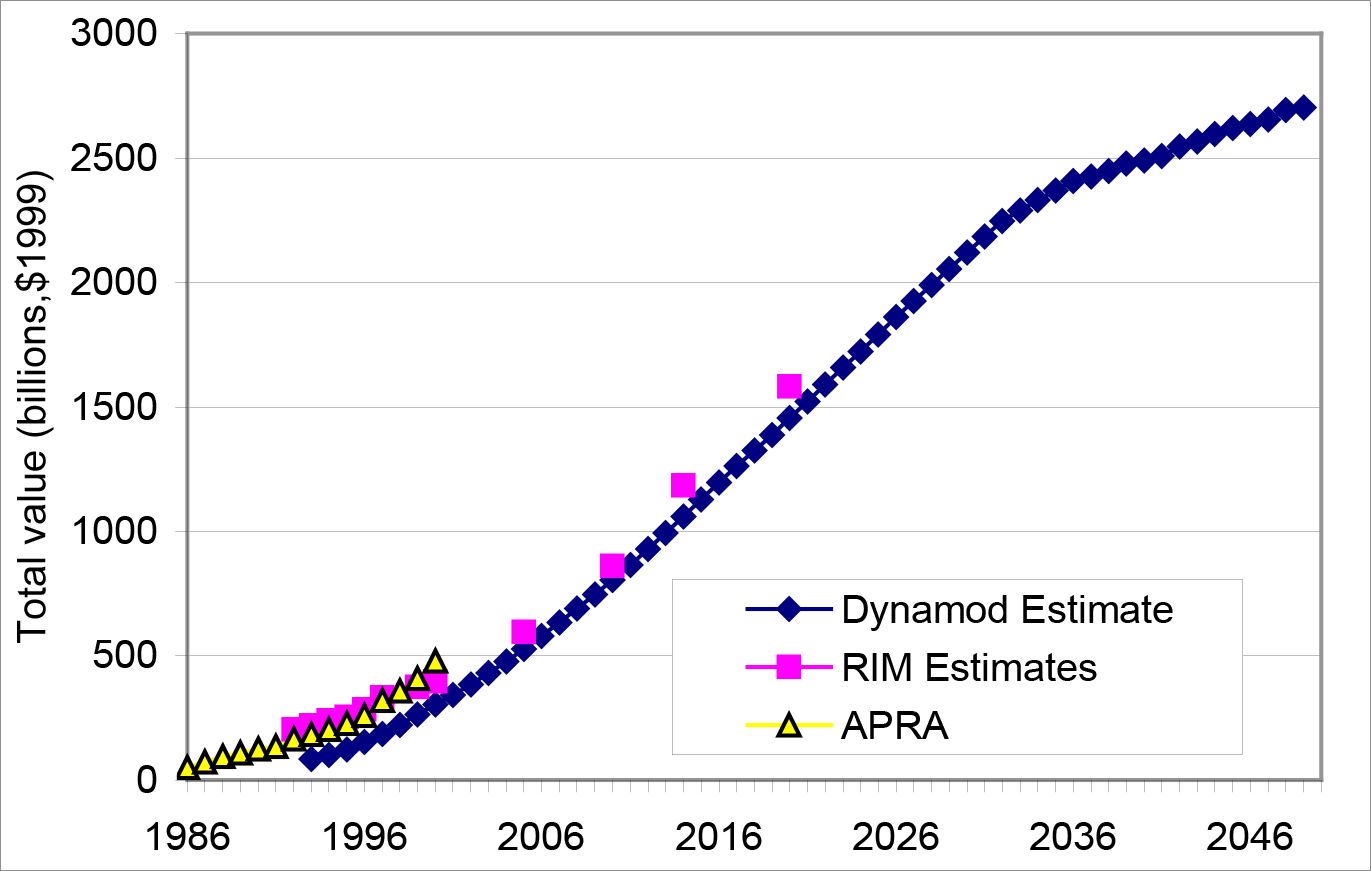
Aggregate Superannuation Assets – 1986-2050. Source: RIM estimates : Rothman, RIM Conf Paper 98/2.APRA estimates: Superannuation Trends June Qtr 2000.
Figure 4

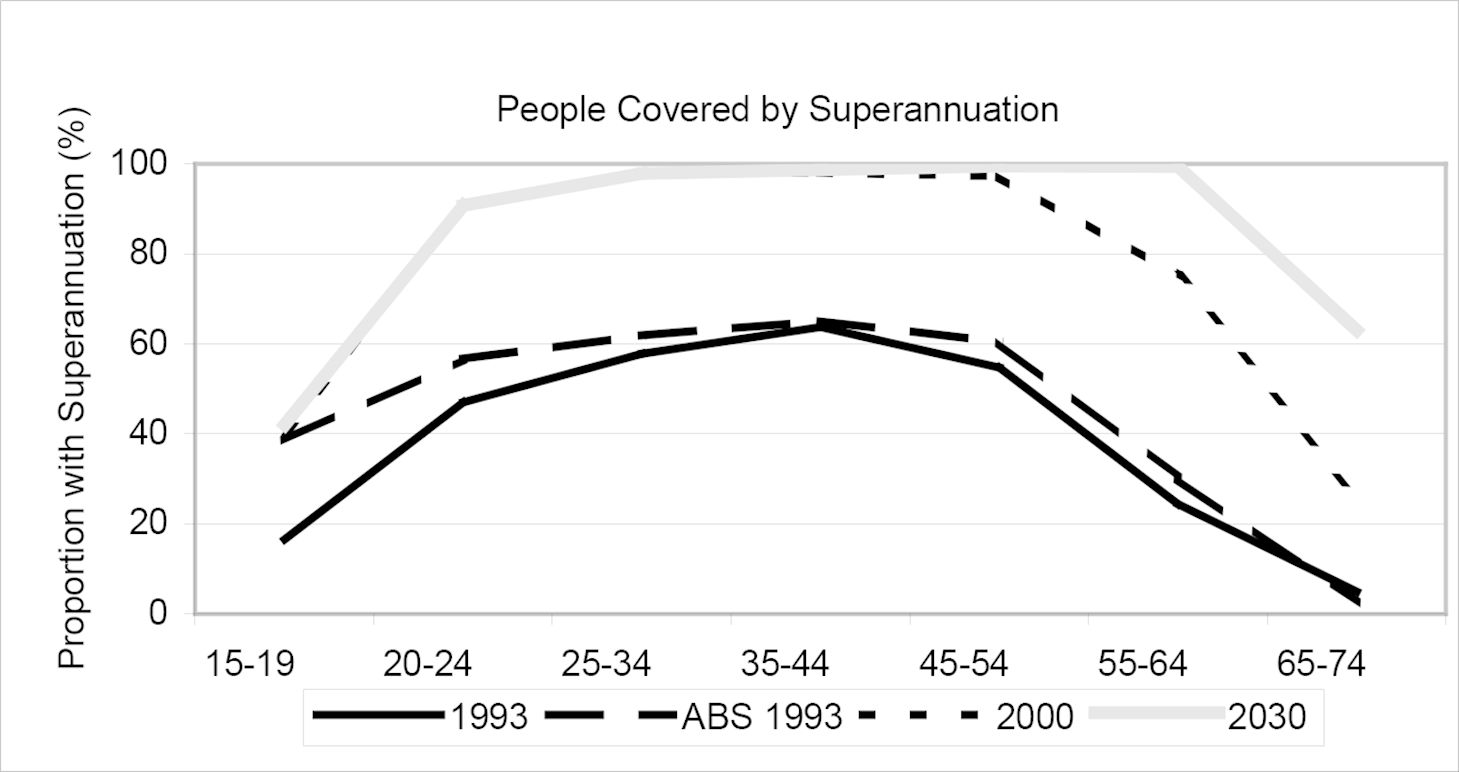
Superannuation Coverage, selected years 1993 -2030. Source: ABS 1993 - 6319.0 Superannuation Australia,1995.Other values – DYNAMOD calculations.
Figure 5
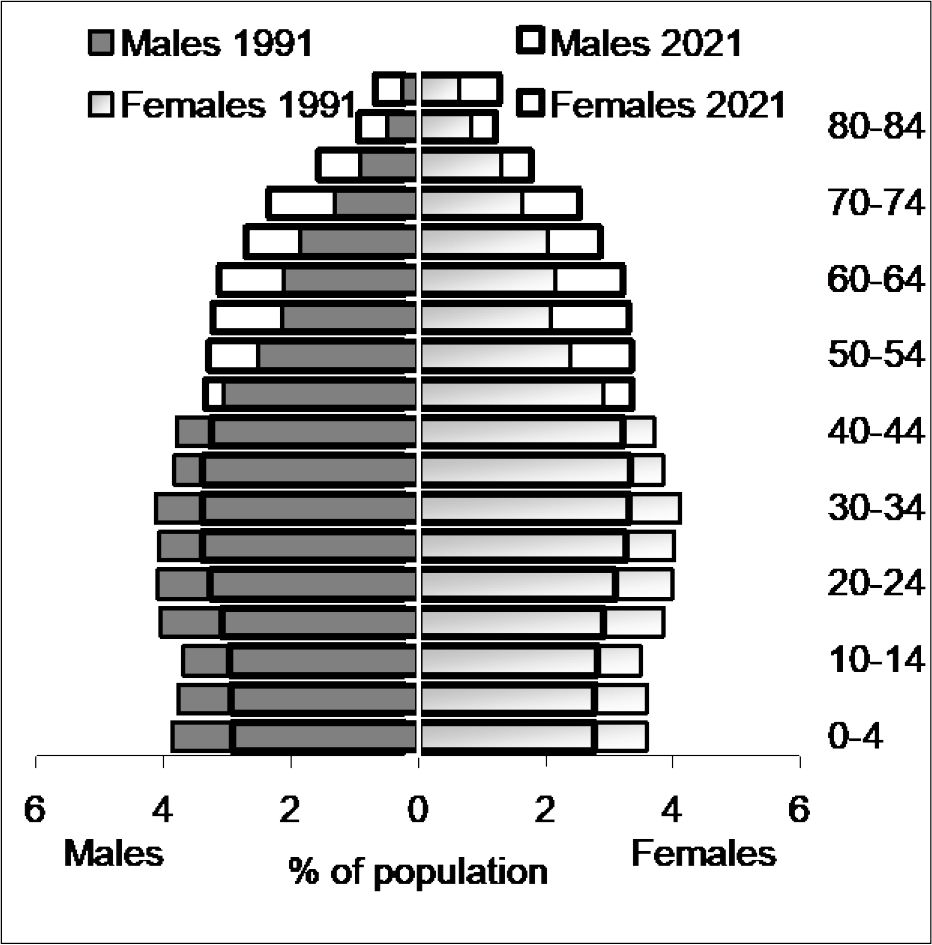
Australian Population in June 1991 and June 2021. Source: ABS 3222.0 Population Projections.
Figure 6
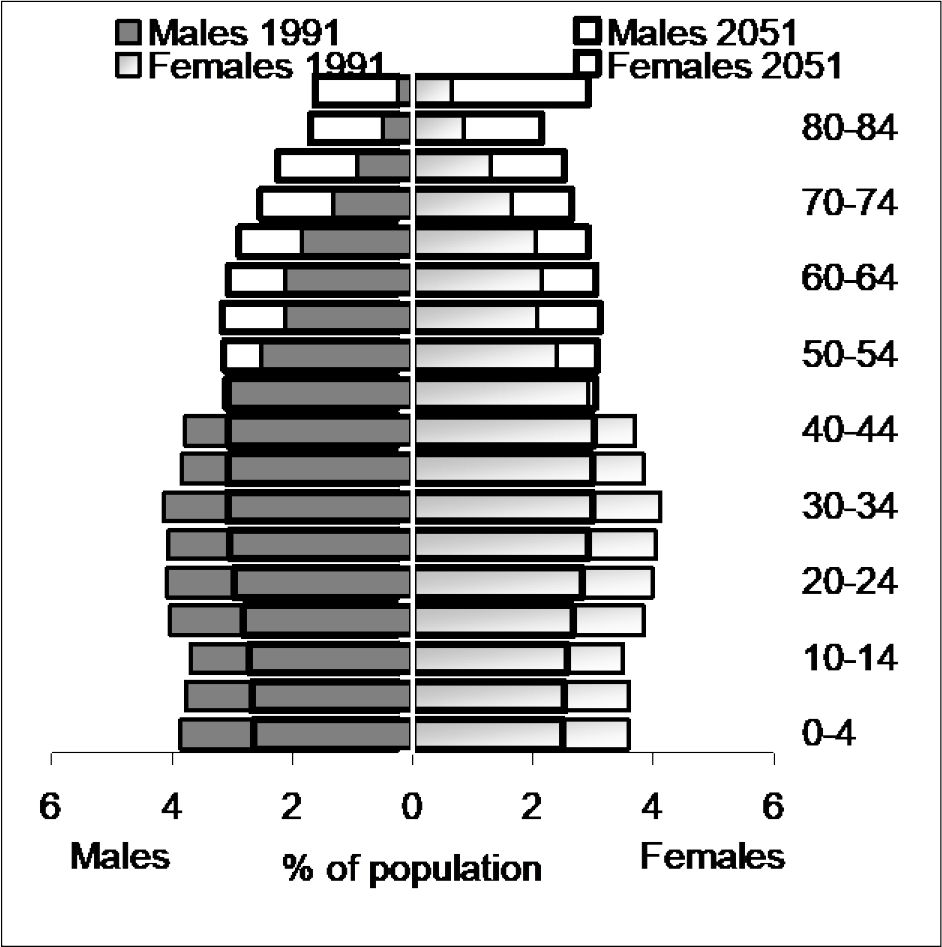
Australian Population in June 1991 and June 2051. Source: ABS 3222.0 Population Projections.
Figure 7
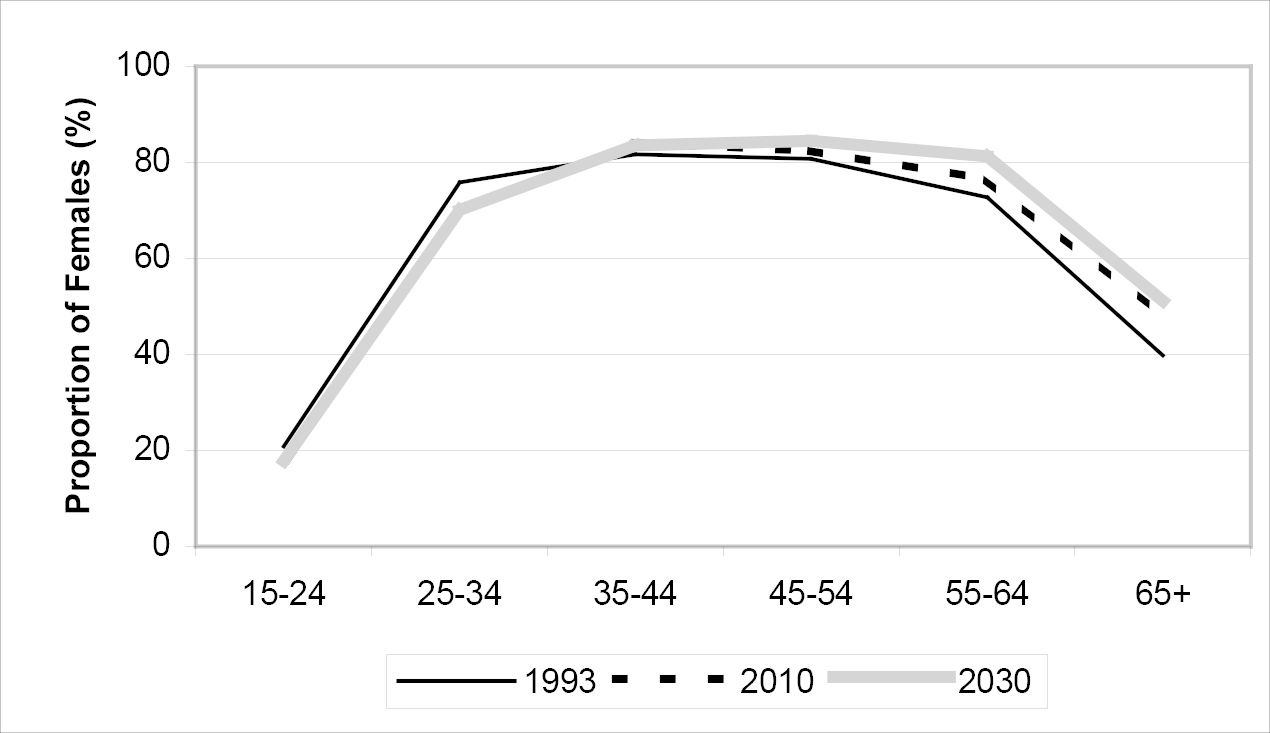

Estimated Proportion of Females Married by Age Group, Selected years 1993-2030. Source: DYNAMOD
Figure 8
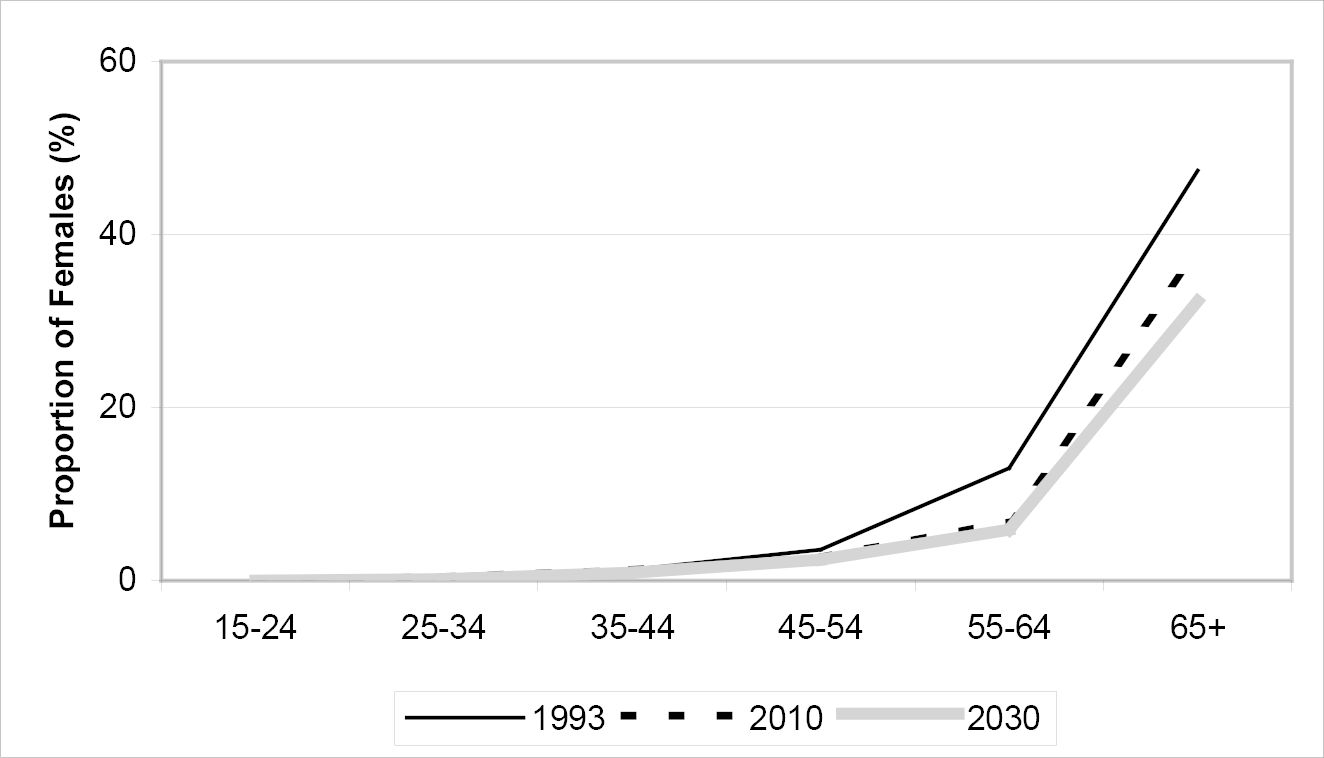

Estimated Proportion of Females Widowed by Age Group, Selected years 1993-2030. Source: DYNAMOD
Figure 9
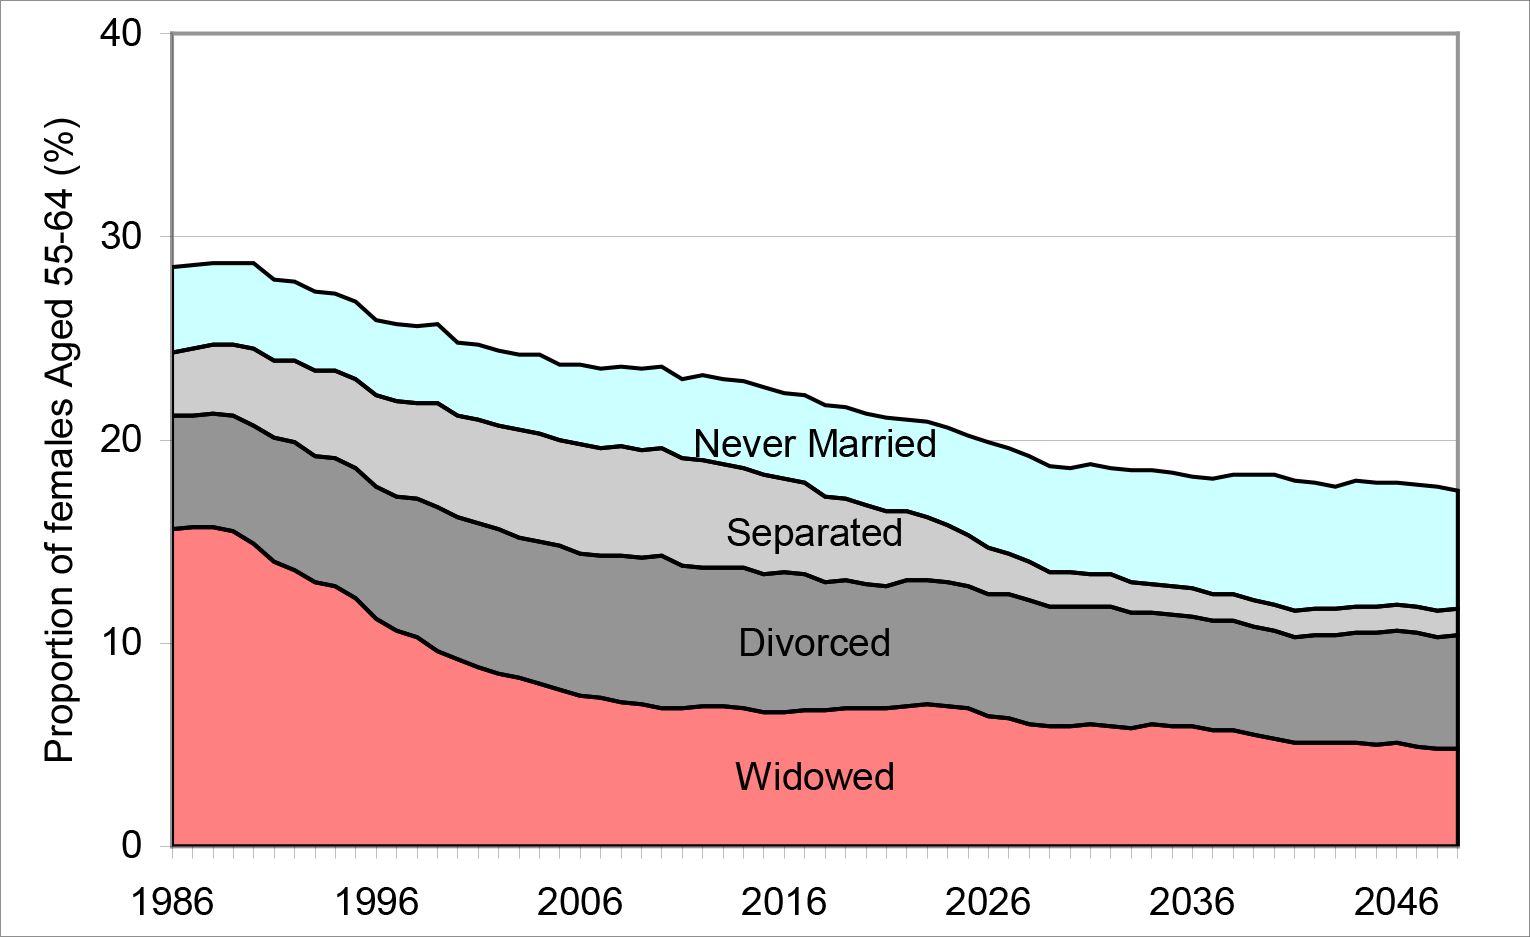

Estimated Marital Status of Women aged 55-64, 1986-2030. Source: DYNAMOD.Note: ‘Married’ women are the residual group on this chart – i.e. if the proportion in the four other marital states identified totals 25%, then 75% of women at the age are estimated to be married (de jure or de facto).
Figure 10
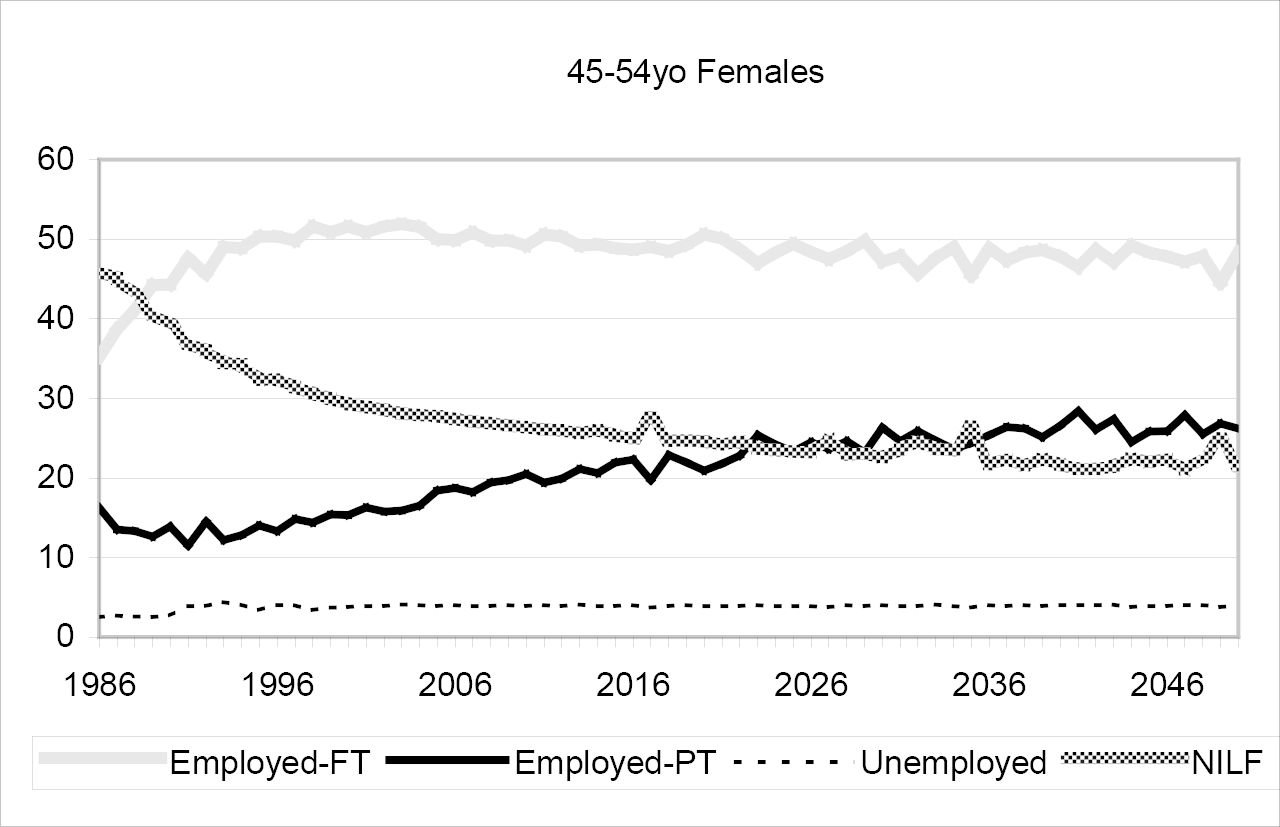

Estimated Labour Force Status of Females Aged 45-54, 1986 -2050. Source: DYNAMOD.
Figure 11
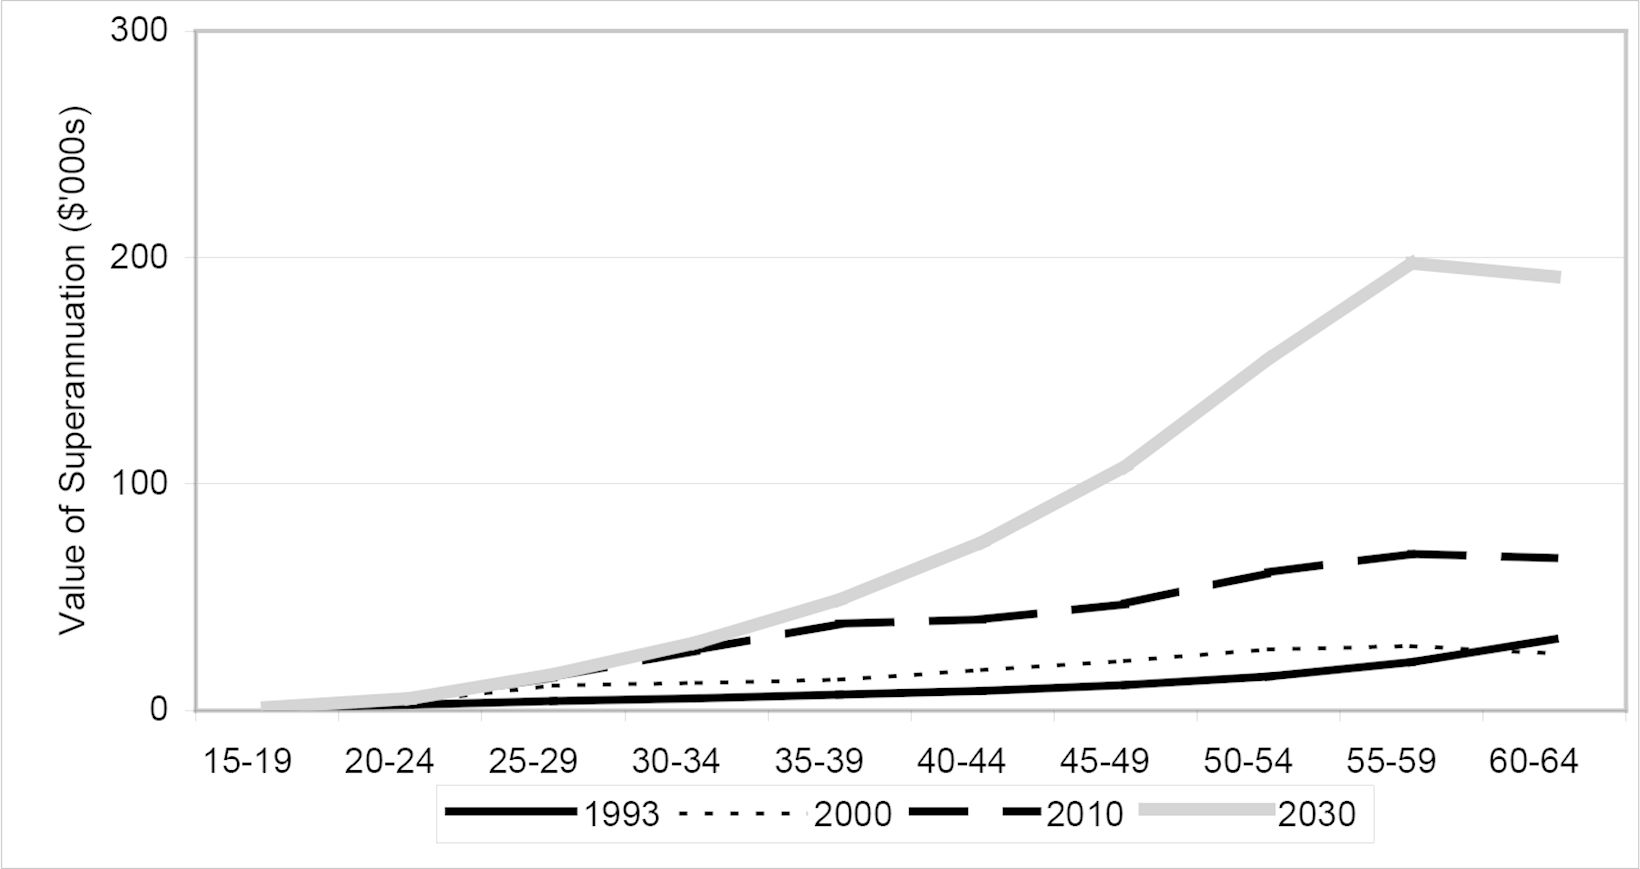

Estimated Accumulated Superannuation by Age Group - Females, selected years 1993-2030. Source: DYNAMOD.
Figure A1
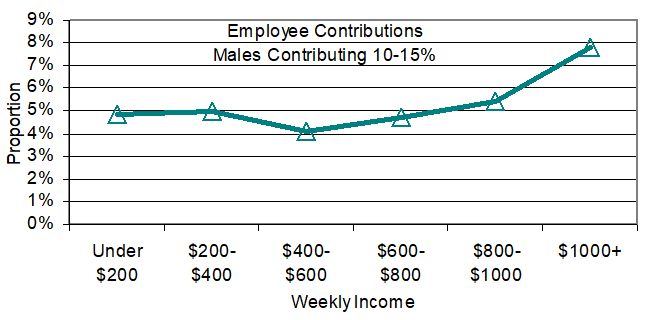

Male Employees Contributing 10-15% to a Superannuation Fund. Source: Calculated from ABS Cat 6319.0 Superannuation Australia Nov 95.
Tables
Table 1
Average Superannuation Assets July 1993 and 2030 (in 1999 dollars)
| RIM | DYNAMOD | DYNAMOD | DYNAMOD | |||||
|---|---|---|---|---|---|---|---|---|
| 1993 | 1993 | 2030 | % change 1993-2030 | |||||
| Age Group | Males | Females | Males | Females | Males | Females | Males | Females |
| ($) | ($) | ($) | ($) | ($) | ($) | (%) | (%) | |
| 15-19 | 2,237 | 1,488 | 2,237 | 1,488 | 2,046 | 1,422 | -9% | -4% |
| 20-24 | 3,911 | 2,767 | 3,911 | 2,767 | 8,030 | 5,319 | 105% | 92% |
| 25-29 | 7,798 | 4,739 | 7,798 | 4,739 | 25,220 | 15,987 | 223% | 237% |
| 30-34 | 12,930 | 6,093 | 12,930 | 6,093 | 52,149 | 30,064 | 303% | 393% |
| 35-39 | 19,588 | 7,792 | 19,588 | 7,792 | 91,403 | 48,877 | 367% | 527% |
| 40-44 | 26,606 | 9,761 | 26,606 | 9,761 | 139,752 | 74,269 | 425% | 661% |
| 45-49 | 35,646 | 12,709 | 35,646 | 12,709 | 201,778 | 109,832 | 466% | 764% |
| 50-54 | 44,712 | 16,905 | 44,712 | 16,905 | 281,115 | 155,452 | 529% | 820% |
| 55-59 | 55,688 | 23,993 | 55,688 | 23,993 | 352,794 | 196,930 | 534% | 721% |
| 60-64 | 71,731 | 35,194 | 71,731 | 35,194 | 389,926 | 193,374 | 444% | 449% |
| 65 & over | 75,424 | 25,976 | 75,424 | 25,976 | 397,204 | 194,837 | 427% | 650% |
| All Ages | 21,957 | 7,993 | 21,419 | 9,647 | 128,235 | 89,591 | 499% | 829% |
-
Source: RIM Conference paper 94/2 (Brown, 1994) and DYNAMOD, 2001.
Table 2
Superannuation Balances for Females with Superannuation Aged 55-64, selected years 2000-2030
| Percentile | 2000 ($) | 2010 ($) | 2020 ($) | 2030 ($) |
|---|---|---|---|---|
| 90% | 47,042 | 103,110 | 179,705 | 290,632 |
| Median | 29,459 | 61,674 | 109,600 | 183,638 |
| 10% | 3,850 | 27,226 | 55,032 | 93,414 |
-
Source: DYNAMOD.
Table A1
Types of Superannuation Schemes
| Fund Type | Members (000’s) | Members (%) | Assets ($ billion) | Assets (%) |
|---|---|---|---|---|
| Accumulation | 18,885 | 87% | 257 | 60% |
| Defined Benefit | 499 | 2% | 24 | 6% |
| Hybrid | 2,344 | 11% | 146 | 34% |
| TOTAL | 21,726 | 100% | 427 | 100% |
-
Source: APRA Superannuation Trends – June Qtr 2000.
Table A2
Superannuation Employer Obligations
| From | Percent of Salary |
|---|---|
| July 1996 | 6% |
| July 1998 | 7% |
| July 2000 | 8% |
| July 2002 | 9% |
Table A3
Employed People Making own Contributions to Superannuation Schemes
| Age | Male | Female |
|---|---|---|
| Under 18 | 2.4% | 4.8% |
| 18 – 24 | 16.1% | 19.3% |
| 25 – 34 | 27.5% | 39.8% |
| 35 – 44 | 32.4% | 46.9% |
| 45 – 54 | 32.5% | 46.4% |
| 55 – 59 | 24.8% | 35.6% |
| 60 – 64 | 10.4% | 20.7% |
| 65+ | 0.6% | 1.4% |
-
Source: Calculated from RIM Conference Paper 98/1.
Table A4
Employee Contributions to Superannuation Schemes
| Average Weekly Earnings | Employee Contribution | ||||||||
|---|---|---|---|---|---|---|---|---|---|
| Zero | < 3% | 3-4% | 4-5% | 5-6% | 6-10% | 10-15% | 15+% | Total | |
| MALES (000’s) 45-76 years | |||||||||
| Under $200 | 16.3 | 0.3 | 0.4 | 0.0 | 0.6 | 0.6 | 1.1 | 3.6 | 23.9 |
| 200-400 | 47.8 | 4.2 | 3.7 | 1.6 | 2.0 | 4.5 | 3.6 | 5.2 | 75.9 |
| 400-600 | 124.4 | 20.9 | 18.4 | 24.3 | 30.2 | 35.2 | 11.2 | 7.8 | 284.8 |
| 600-800 | 78.5 | 16.1 | 16.1 | 21.3 | 29.2 | 36.7 | 10.0 | 4.9 | 224.4 |
| 800-1000 | 35.5 | 12.0 | 9.3 | 19.0 | 24.7 | 28.7 | 7.5 | 1.7 | 147.7 |
| 1000+ | 49.3 | 14.8 | 9.4 | 22.1 | 29.5 | 33.3 | 14.3 | 10.4 | 195.0 |
| Not reported | 17.0 | 0.3 | 0.3 | 0.4 | 1.9 | 1.3 | 1.3 | 0.0 | 37.4 |
| Total | 368.8 | 68.6 | 57.6 | 88.7 | 118.1 | 140.3 | 49.0 | 33.6 | 989.1 |
| FEMALES (000’s) 45-76 years | |||||||||
| Average Weekly Earnings | Zero | < 3% | 3-4% | 4-5% | 5-6% | 6-10% | 10-15% | 15+% | Total |
| Under $200 | 56.7 | 0.9 | 0.4 | 0.9 | 1.8 | 2.4 | 3.6 | 5.8 | 73.5 |
| 200-400 | 133.9 | 11.0 | 8.4 | 6.5 | 10.1 | 14.5 | 7.2 | 6.3 | 203.9 |
| 400-600 | 114.7 | 15.5 | 11.1 | 16.9 | 22.4 | 32.5 | 9.2 | 4.6 | 237.8 |
| 600-800 | 40.6 | 7.0 | 8.0 | 11.7 | 13.6 | 18.7 | 5.3 | 2.1 | 114.7 |
| 800-1000 | 8.7 | 4.2 | 2.1 | 6.7 | 6.0 | 14.0 | 2.4 | 0.8 | 48.4 |
| 1000+ | 6.0 | 2.0 | 0.0 | 1.9 | 3.9 | 2.5 | 1.7 | 1.5 | 21.9 |
| Not reported | 7.9 | 0.0 | 0.3 | 0.2 | 0.2 | 1.2 | 0.1 | 0.2 | 17.0 |
| Total | 368.5 | 40.6 | 30.3 | 44.8 | 58.0 | 85.8 | 29.5 | 21.3 | 717.2 |
-
Source: ABS Cat 6319.0 Superannuation Australia November 1995 Table 13.
Data and code availability
Please contact the authors for information on data and code availability.
Download links
A two-part list of links to download the article, or parts of the article, in various formats.