The limits of Policymaking - An analysis of the consequences of boundedly rational government using the Swedish Micro-to-Macro model (MOSES)
- Industrial Institute for Economic and Social Research (IUI), Sweden
- Middle East Technical University, Turkey
Cite this article
as: G. Eliasson, E. Taymaz; 2024; The limits of Policymaking - An analysis of the consequences of boundedly rational government using the Swedish Micro-to-Macro model (MOSES); International Journal of Microsimulation; 17(2); 182-201.
doi: 10.34196/ijm.00295
- Article
- Figures and data
- Jump to
Figures
Figure 1

Annual change in manufacturing wages.
Figure 2
Labour productivity.
Figure 3

Unemployment rate.
Figure 4

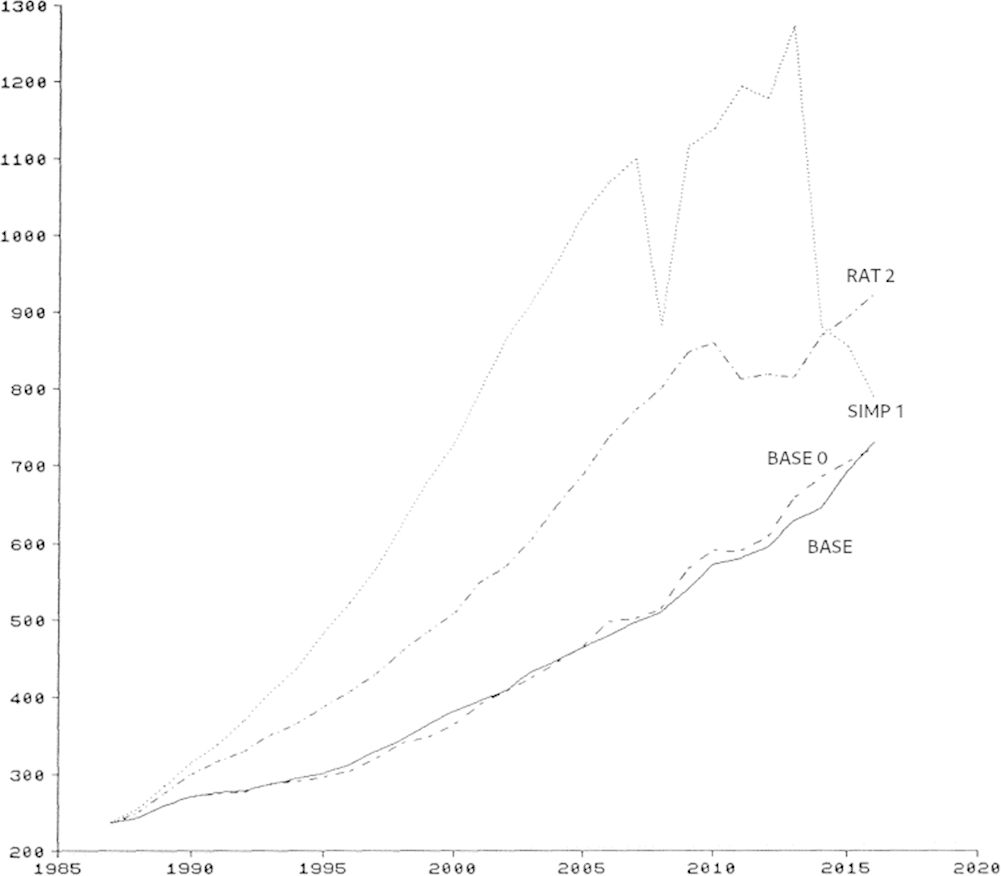
Manufacturing output.
Figure 5
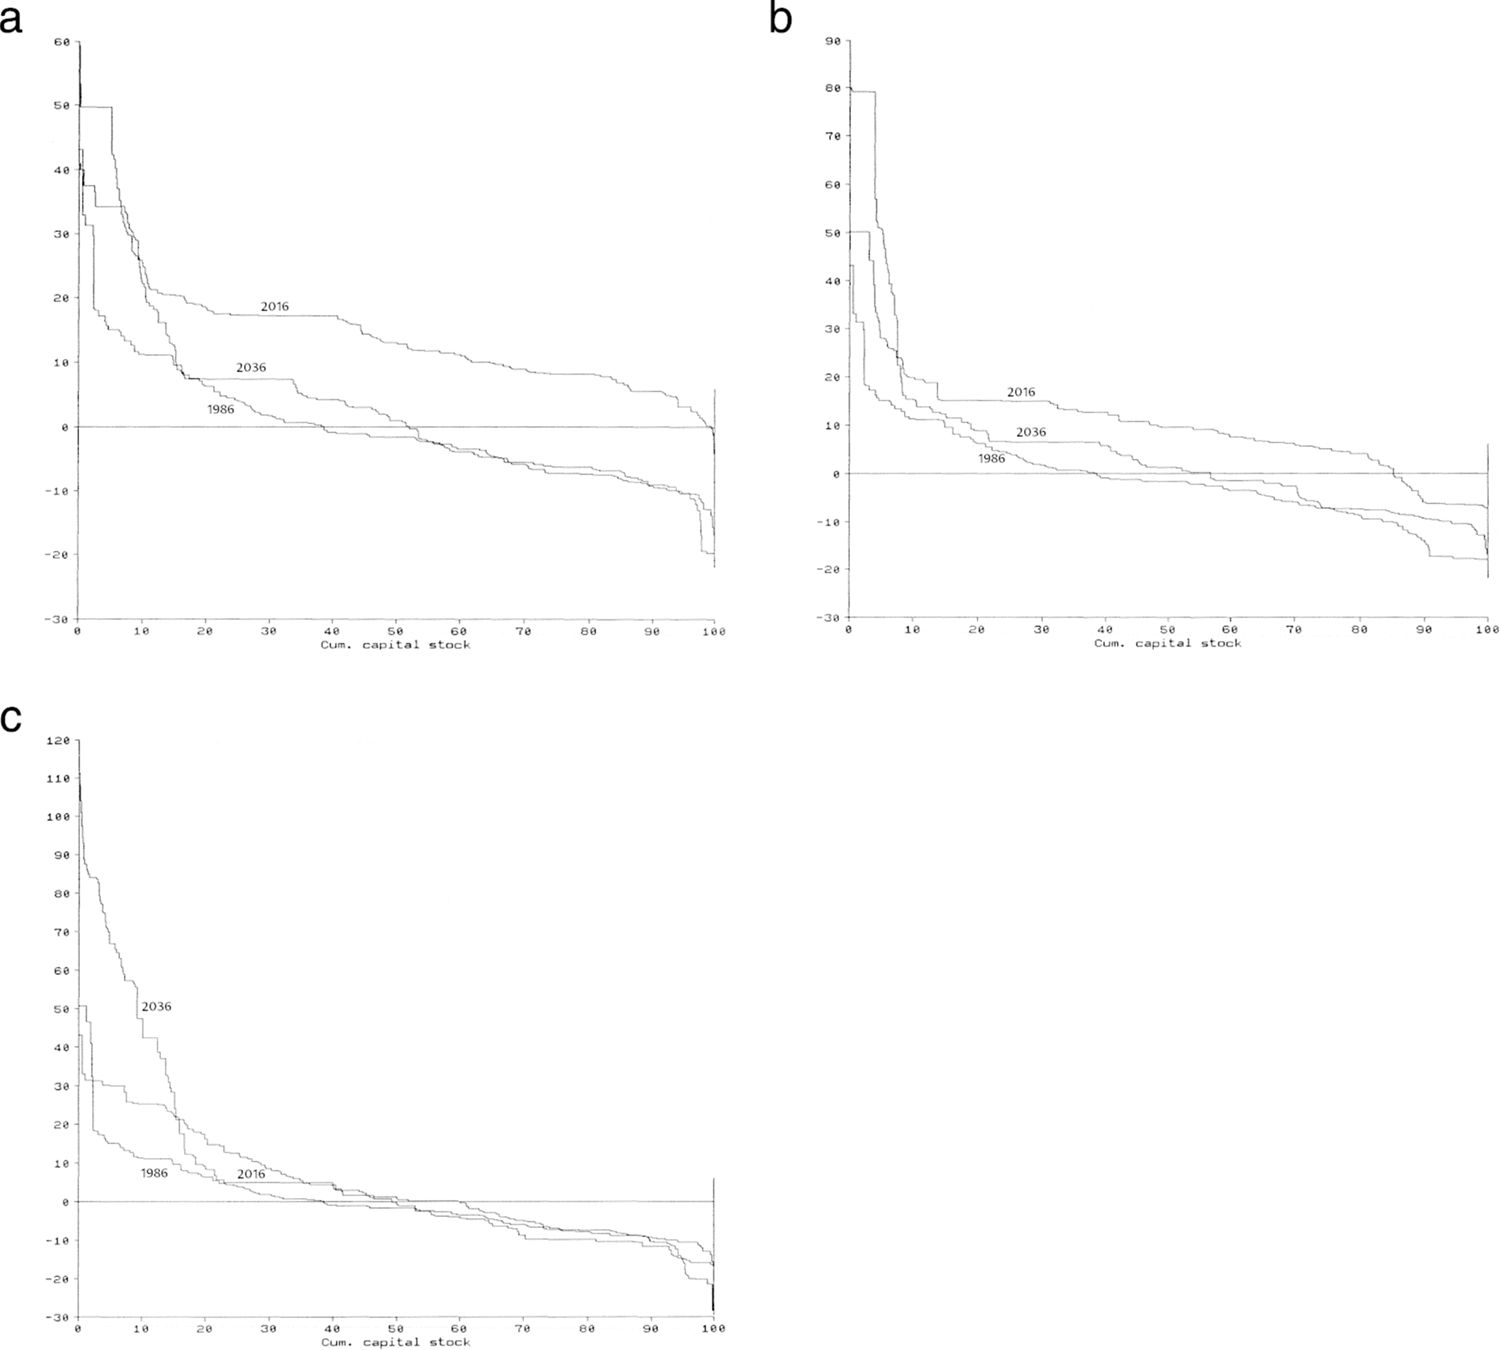
(a) Rate of return distribution, ZEROBASE. (b) Rate of return distribution, BASE. (c) Rate of return distribution, SIMP 2.
Figure 6

Interest rate.
Figure 7

Public deficit/income ratio.
Tables
Table 1
Experimental results (Years 1-15).
| ZEROBASE | EQBASE | BASE | SIMP1 | SIMP2 | KEY2 | RAT2 | |
|---|---|---|---|---|---|---|---|
| QTOP* | 150281 | 152394 | 153153 | 156675 | 134675 | 146823 | 141347 |
| TEC* | 11662 | 11625 | 11917 | 11981 | 11536 | 11902 | 12052 |
| Labor prod.* | 389439 | 385954 | 394917 | 797181 | 520333 | 659736 | 547376 |
| Average annual growth rates | |||||||
| GNP | 3.77 | 4.06 | 4.11 | 5.37 | 4.41 | 5.04 | 4.57 |
| 0.74 | 0.69 | 0.75 | 0.72 | 0.58 | 0.83 | 0.67 | |
| Output | 5.04 | 5.03 | 5.37 | 4.70 | 4.76 | 5.12 | 5.27 |
| 1.34 | 1.54 | 1.40 | 2.12 | 1.57 | 1.80 | 1.66 | |
| Sales | 11.23 | 11.26 | 11.57 | 10.96 | 11.00 | 11.36 | 11.49 |
| 1.15 | 1.40 | 1.42 | 1.87 | 1.51 | 1.68 | 1.65 | |
| Prices | 5.87 | 5.88 | 5.88 | 5.87 | 5.91 | 5.87 | 5.91 |
| 0.53 | 0.53 | 0.52 | 0.54 | 0.55 | 0.54 | 0.54 | |
| Wages | 6.57 | 7.85 | 7.93 | 14.04 | 10.28 | 12.46 | 10.56 |
| 0.35 | 1.01 | 1.36 | 2.26 | 0.99 | 2.10 | 0.95 | |
| Profit margin | 45.06 | 42.70 | 43.09 | 37.20 | 39.66 | 37.38 | 39.52 |
| 6.16 | 3.79 | 3.75 | 1.72 | 2.06 | 1.37 | 2.44 | |
| Unemployment rate | 8.04 | 5.19 | 5.28 | 1.06 | 2.24 | 1.85 | 2.14 |
| 0.95 | 1.92 | 2.07 | 0.19 | 0.27 | 0.90 | 0.32 | |
| Exchange rate* | 1.59 | 1.72 | 1.71 | 2.03 | 2.03 | 2.03 | 2.03 |
| Interest rate | 12.63 | 12.68 | 12.59 | 10.28 | 12.05 | 10.83 | 11.89 |
| 0.87 | 0.57 | 0.56 | 1.26 | 0.69 | 1.74 | 0.95 | |
| Public deficit/income | -28.33 | -29.96 | -29.77 | -42.48 | -36.71 | -40.56 | -36.62 |
| 6.18 | 3.93 | 4.24 | 4.34 | 0.84 | 1.90 | 0.80 | |
| Gov. share in GNP | 35.33 | 36.29 | 36.22 | 44.75 | 40.99 | 44.00 | 41.02 |
| 0.57 | 0.39 | 0.38 | 5.08 | 2.71 | 3.75 | 2.52 | |
| Trade def./GNP ratio | 4.31 | 5.19 | 5.12 | 15.00 | 10.63 | 14.43 | 10.85 |
| 2.23 | 1.27 | 1.38 | 6.02 | 2.62 | 4.57 | 2.63 | |
-
Note: The standard deviation of a variable over the period is shown in the second row.
-
*
denotes the value at the end of the period.
Table 2
Experiment results (Years 16-30).
| ZEROBASE | EQBASE | BASE | SIMP1 | SIMP2 | KEY2 | RAT2 | |
|---|---|---|---|---|---|---|---|
| QTOP* | 454640 | 391980 | 408493 | 41397 | 159049 | 53993 | 222153 |
| TEC* | 17992 | 19155 | 18840 | 22463 | 16143 | 19934 | 17895 |
| Labor prod.* | 722351 | 719729 | 729879 | 788204 | 825031 | 1011372 | 922739 |
| Average growth rates | |||||||
| GNP | 3.77 | 4.06 | 4.11 | 5.37 | 4.41 | 5.04 | 4.57 |
| 0.74 | 0.69 | 0.75 | 0.72 | 0.58 | 0.83 | 0.67 | |
| Output | 3.11 | 3.29 | 2.83 | .. | 1.80 | 2.80 | 1.16 |
| 3.09 | 2.28 | 2.40 | .. | 1.36 | ... | 2.33 | |
| Sales | 9.36 | 9.66 | 9.21 | 7.23 | 8.52 | 11.99 | 7.79 |
| 2.25 | 2.05 | 2.07 | 23.12 | 1.79 | 16.26 | 2.13 | |
| Prices | 5.87 | 5.99 | 6.01 | 8.00 | 6.54 | 6.81 | 6.49 |
| 0.62 | 0.57 | 0.58 | 3.59 | 0.86 | 2.60 | 0.95 | |
| Wages | 5.14 | 7.25 | 7.71 | 11.75 | 9.34 | 9.63 | 8.93 |
| 0.58 | 0.82 | 0.64 | 1.45 | 0.20 | 1.23 | 1.01 | |
| Profit margin | 70.69 | 57.07 | 56.54 | 8.48 | 50.29 | 31.01 | 54.28 |
| 6.58 | 5.60 | 4.76 | 67.57 | 4.09 | 49.60 | 4.30 | |
| Unemployment rate | 13.46 | 4.60 | 4.13 | 0.98 | 2.08 | 1.91 | 2.02 |
| 1.31 | 0.70 | 0.54 | 0.43 | 0.20 | 1.07 | 0.24 | |
| Exchange rate* | 1.17 | 2.06 | 2.20 | 3.73 | 3.73 | 3.72 | 3.72 |
| Interest rate | 8.59 | 12.68 | 13.37 | 22.33 | 21.60 | 23.33 | 21.95 |
| 2.52 | 0.40 | 0.93 | 3.72 | 4.18 | 2.79 | 3.94 | |
| Public deficit/ | -2.21 | -19.19 | -21.92 | -60.50 | -41.86 | -55.78 | -43.86 |
| income | 7.15 | 3.06 | 0.97 | 5.18 | 2.21 | 5.30 | 2.21 |
| Gov. share in GNP | 35.28 | 39.09 | 39.91 | 66.01 | 52.41 | 58.90 | 51.69 |
| 0.68 | 1.07 | 1.65 | 13.85 | 4.07 | 4.92 | 3.57 | |
| Trade deficit/ | -4.03 | 2.43 | 3.32 | 47.05 | 23.94 | 32.74 | 21.43 |
| GNP ratio | 2.29 | 0.87 | 1.04 | 28.93 | 6.05 | 7.62 | 4.77 |
| Public emp* | 44.75 | 54.52 | 56.61 | 98.24 | 78.06 | 92.61 | 80.82 |
| Private emp.* | 41.01 | 39.45 | 38.44 | 1.01 | 20.33 | 5.69 | 17.75 |
| N new firms* | 72 | 54 | 57 | 24 | 52 | 37 | 51 |
| N nullified firms* | 42 | 50 | 52 | 176 | 69 | 154 | 80 |
-
Note: The standard deviation of a variable over the period is shown in the second row.
-
Labor force at the end of simulation is about 2530000.
-
*
denotes the value at the end of the period.
Download links
A two-part list of links to download the article, or parts of the article, in various formats.