Endogenous Economic Growth Through Selection
- Royal Technical Institute and Industrial Institute for Economic and Social Research, Sweden
Cite this article
as: G. Eliasson; 2024; Endogenous Economic Growth Through Selection; International Journal of Microsimulation; 17(2); 202-212.
doi: 10.34196/ijm.00296
- Article
- Figures and data
- Jump to
Figures
Figure 1

Difference between manufacturing output in base run and Experiments I and II (Expressed as Percentage of Manufacturing Output in Base Run).
Figure 2

Difference in GNP between base run and Experiments I and II (Expressed as Percentage of GNP in base run).
Figure 3

Difference in unemployment rate between base run and Experiments I and II (Expressed as Percentage of unemployment rate in base run).
Figure 4

Difference in rate of return between base run and Experiments I and II (Expressed as Percentage of rate of return in base run).
Figure 5
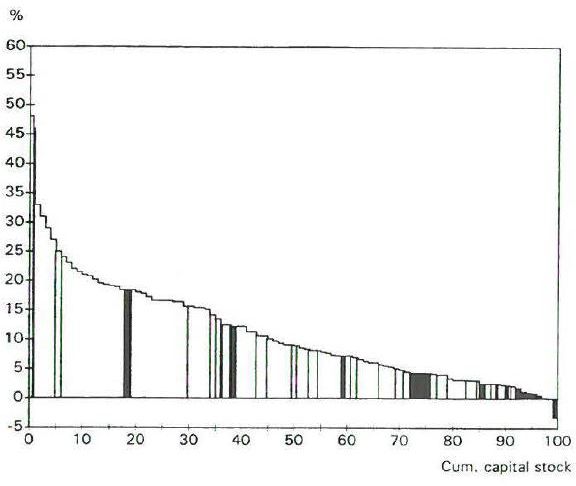
Rate and return distribution after 50 years in Experiment I.
Figure 6
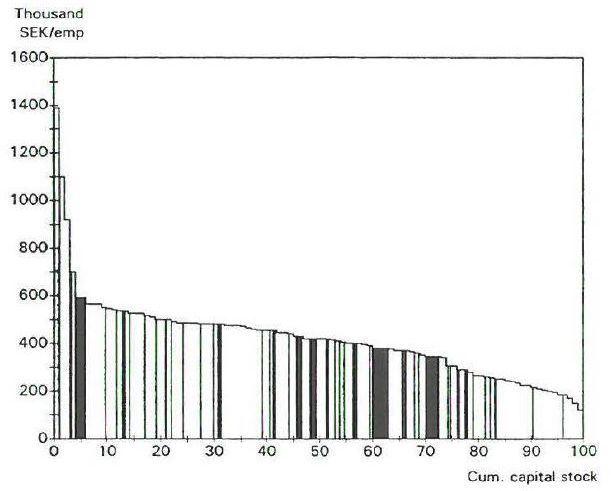
Labor productivity (Salter) distributions on 50 year Horizon in Experiment I.
Figure 7

Rate of return distributions in entry, base and no exit Experiments after 50 years.
Tables
Table 1
| The Four Fundamental Investment/Growth Mechanisms | |
|---|---|
| (1) | entry, of new innovative establishments |
| (2) | reorganization of existing firms |
| (3) | efficient management of existing firms (rationalization) |
| (4) | bankruptcy, exit or creative destruction |
-
Source: Eliasson (1995), “The Economics of Technical Change: The Macroeconomic Consequences of Business Competence in an Experimentally Organized Economy”, Revue D’èconomie Industrielle,Numèro Exceptionel, :53-82
Table 2
Number of Initial, Entering and Exiting Firms in Simulations.
| Initial Year | New entries during | Exits during simulation | |
|---|---|---|---|
| 50 year simulation | |||
| Base run | 250 | 0 | 119 |
| Experiment I (entry) | 250 | 257 | 125 |
| Experiment II (low exit) | 250 | 0 | 87 |
Download links
A two-part list of links to download the article, or parts of the article, in various formats.