
This article contains 1 figure and 1 table.
Figures
Tables
| Attribute | Levels |
|---|---|
| Payment size |
|
| Income tax |
|
| Other funding |
|
| Poverty |
|
| Inequality |
|
| Life expectancy |
|
| Anxiety and depression |
|
| Conditionality |
|
| Means testing |
|
| Universality |
|
Research articles · Aug 20, 2025
Department of Social Work, Education and Community Wellbeing, Northumbria University, Newcastle upon Tyne, United Kingdom; Landman Economics, Colchester, United Kingdom; Institut Jean Nicod, École normale supérieure, Paris, France
Cite as: G. Stark, E. Johnson, H. Reed, D. Nettle, M. Johnson; 2025; The Public Policy Preference Calculator (TriplePC): Developing a comprehensive welfare policy microsimulation; International Journal of Microsimulation; 18(2); 79–93. doi: 10.34196/ijm.00323
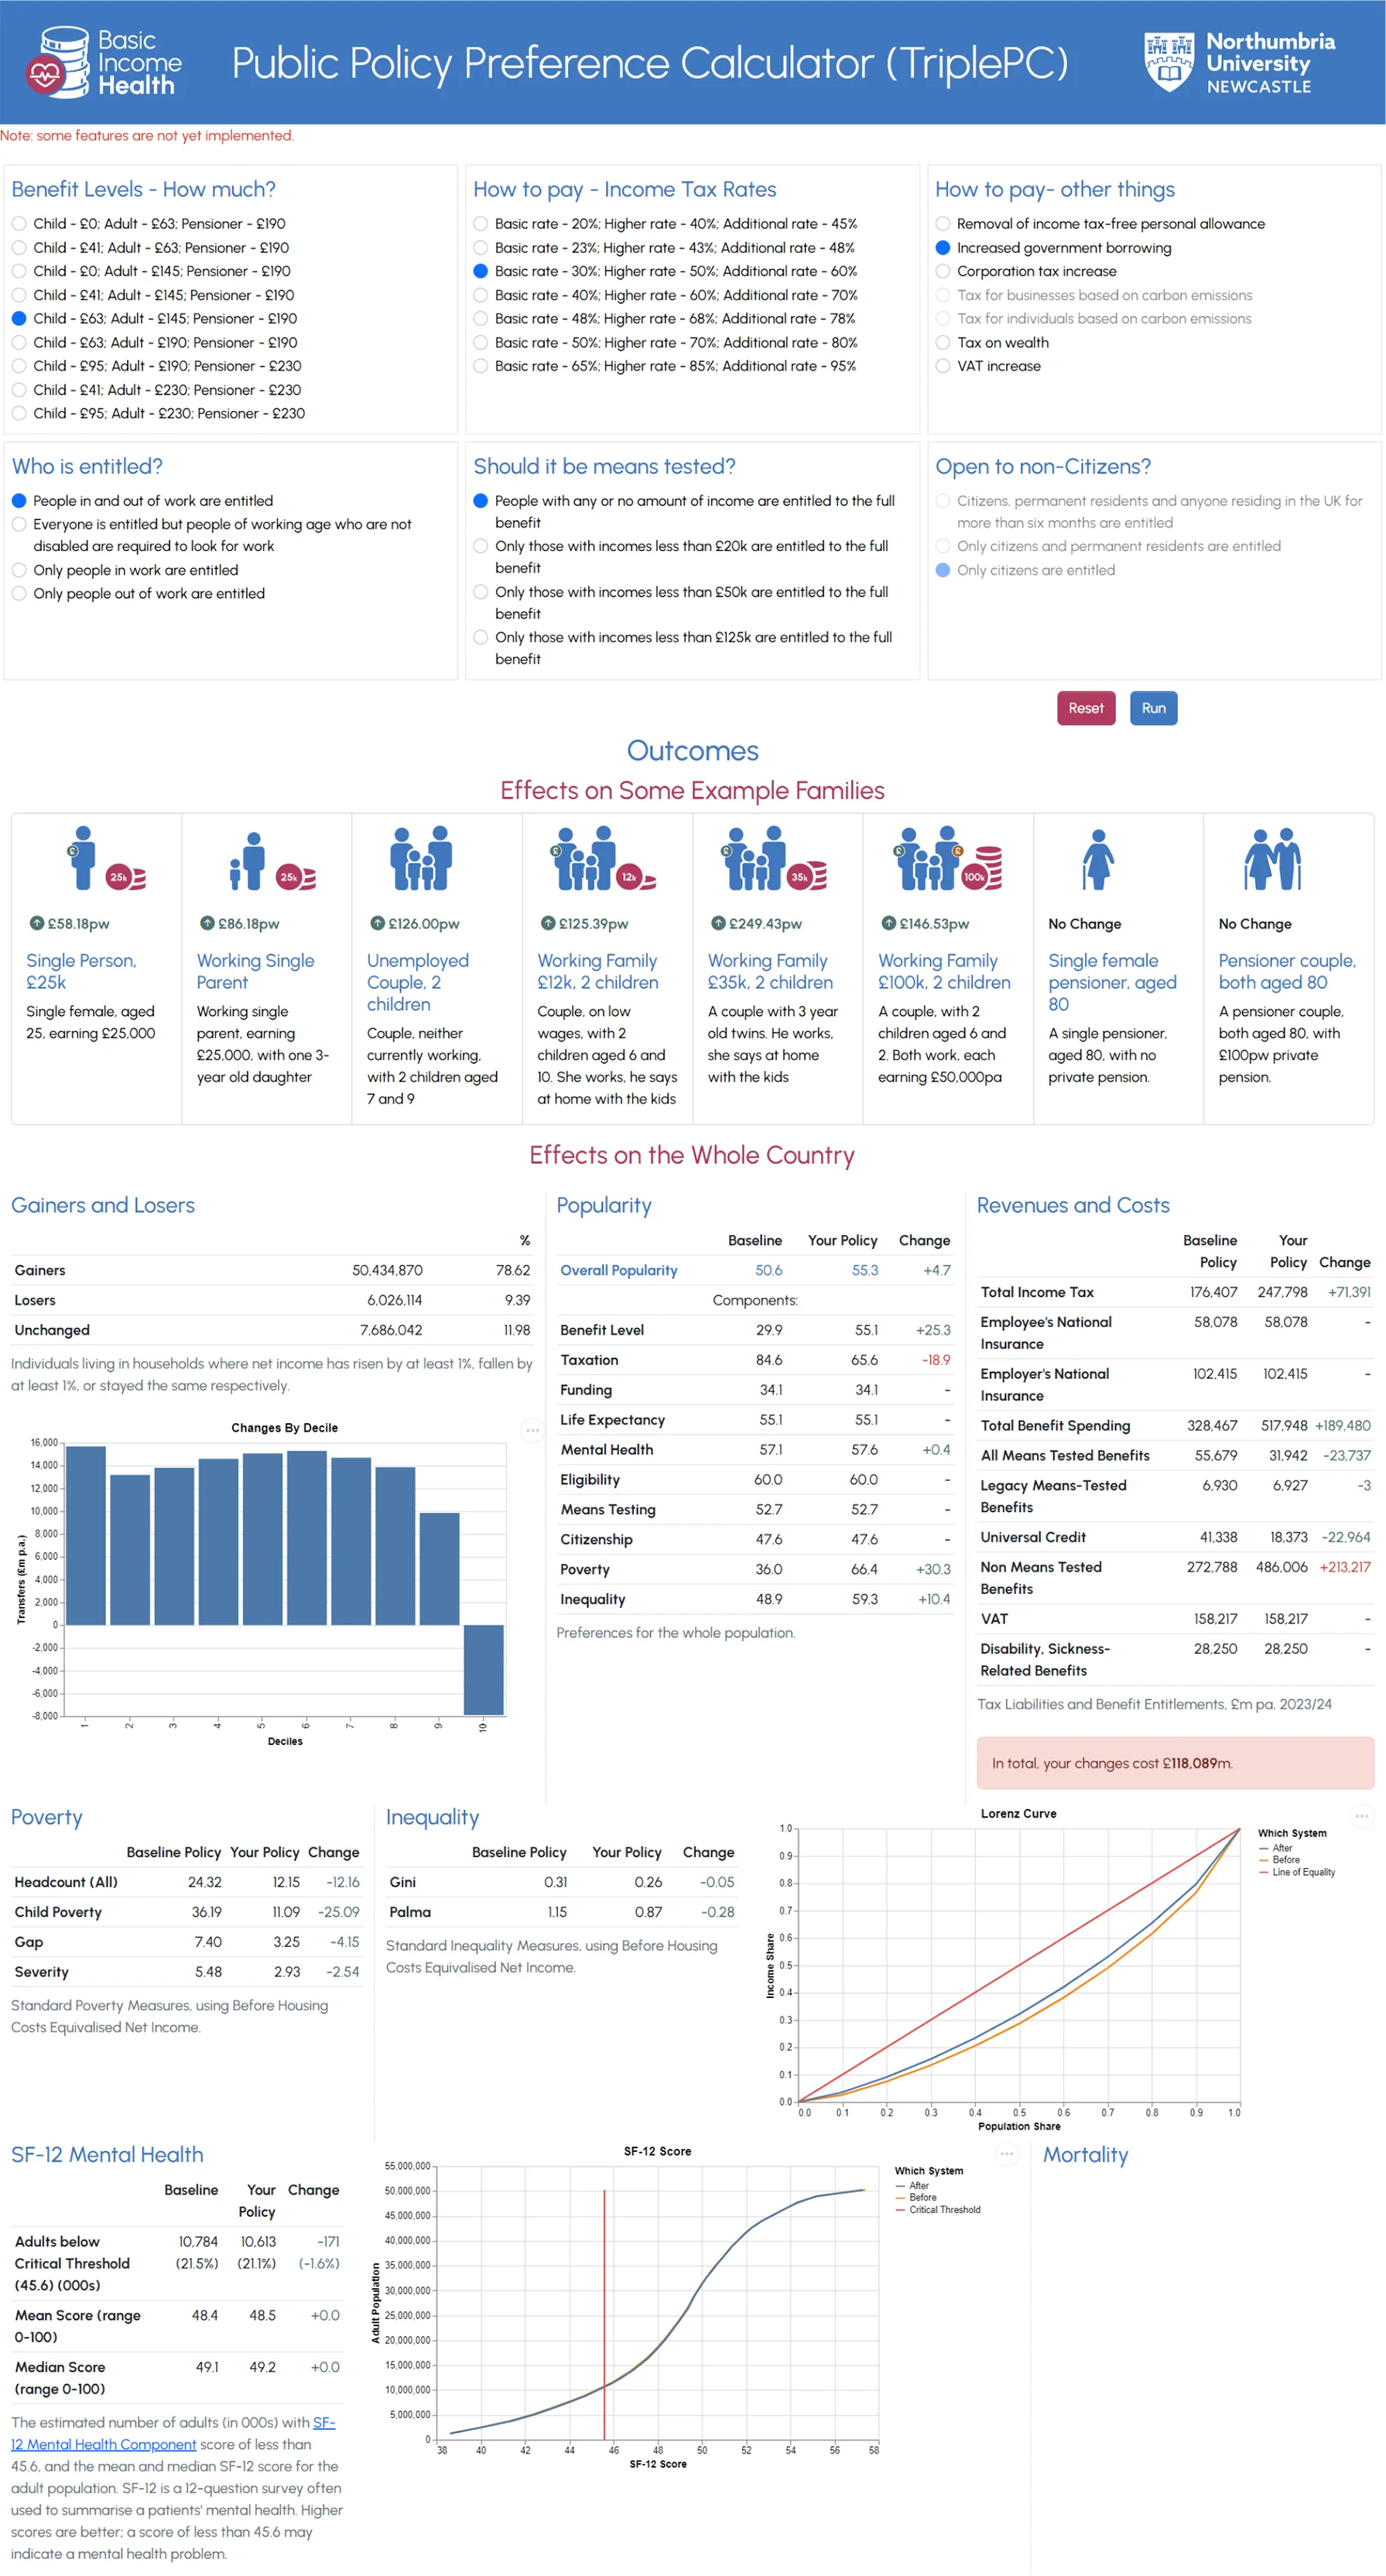
Welfare policies have often been assessed on their financial impacts, for example, their effects on net household incomes and marginal and average tax rates. However, welfare policies can also have a substantial effect on population health and wellbeing. In addition, politicians must consider the electoral implications of policies that would affect large sections of the population. In this article we describe a new microsimulation model with a public-facing user interface, the Public Policy Preference Calculator (TriplePC), which enables automated assessment of economic and health impacts as well as public preferences for particular, customisable welfare policies. The TriplePC uses data from, and regressions based on, major UK sources such as the Family Resources Survey, Understanding Society: The UK Household Longitudinal Study (UKHLS) and the Wealth and Assets Survey, alongside our own conjoint experimental surveys on public preferences. While the design of the conjoint survey necessitated relatively strong assumptions in some areas, the TriplePC’s ability to simultaneously model the financial, health and political implications of a policy is, we believe, unique. TriplePC was developed over approximately four months as part of a project on income and health funded by National Institute for Health and Care Research. We view TriplePC as a highly promising prototype rather than the finished article; in this paper we will describe it ‘warts and all’, highlighting areas of particular uncertainty and the lessons learned we hope to apply to future, fuller developed versions.
This article contains 1 figure and 1 table.
| Attribute | Levels |
|---|---|
| Payment size |
|
| Income tax |
|
| Other funding |
|
| Poverty |
|
| Inequality |
|
| Life expectancy |
|
| Anxiety and depression |
|
| Conditionality |
|
| Means testing |
|
| Universality |
|