The financial implications of working longer: An application of a micro-economic model of retirement in Belgium
- Federal Planning Bureau, Belgium
- Centre for Sociological Research (CESO), Katholieke Universiteit Leuven, Belgium
Cite this article
as: G. J. M. Dekkers; 2007; The financial implications of working longer: An application of a micro-economic model of retirement in Belgium; International Journal of Microsimulation; 1(1); 10-25.
doi: 10.34196/ijm.00003
- Article
- Figures and data
- Jump to
Figures
Figure 1
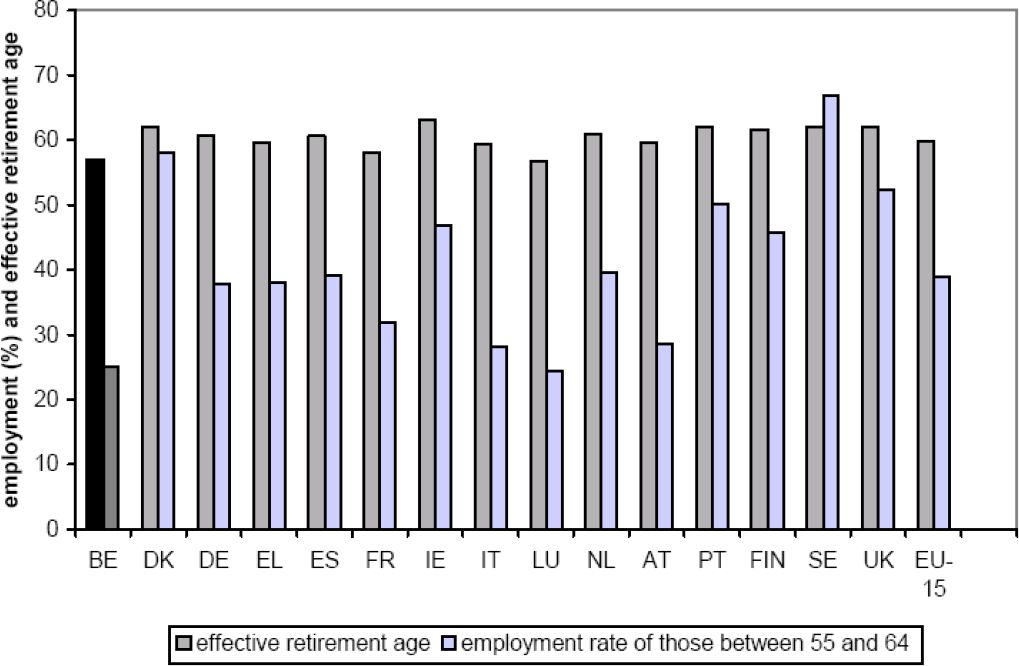
Activity rate of 55–65 year olds, and effective retirement age in Europe (European Community, 2003: 42–48).
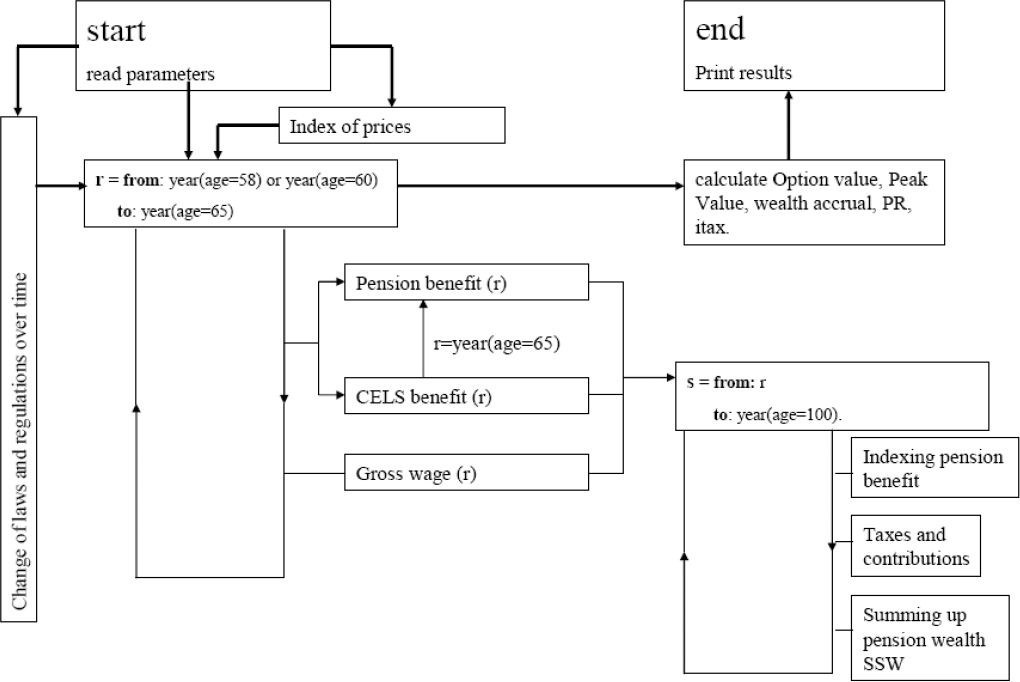
Figure 2

The structure of the micro-economic pension model.
Figure A1
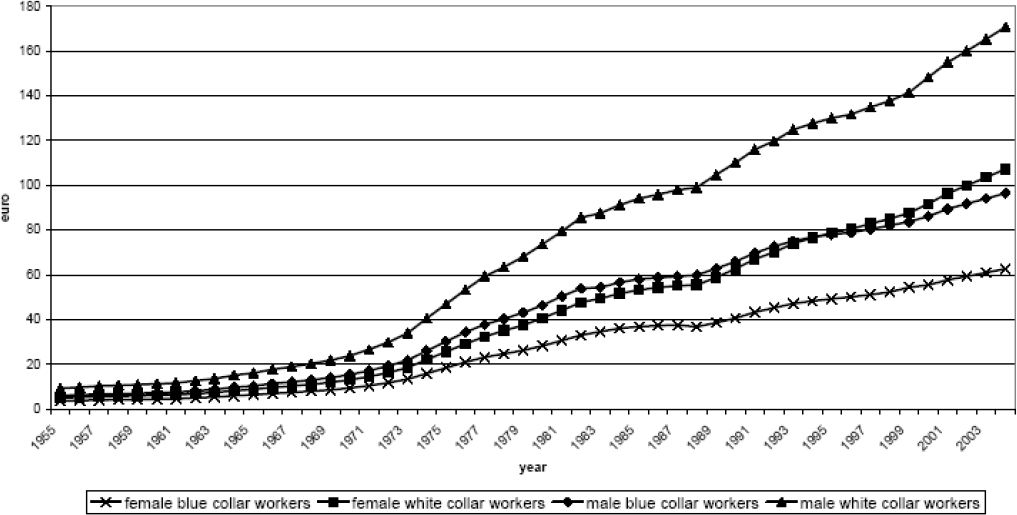
Wage per day for the categories of workers as a whole.
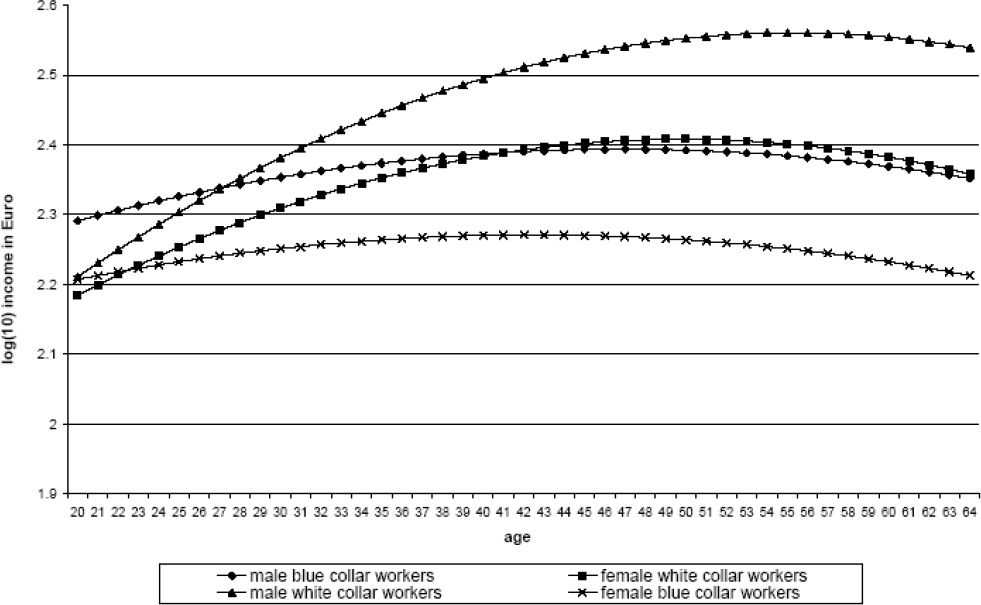
Figure A2

Logarithm of the gross wage per day as a function of age.
Tables
Table 1
Pension benefit for a single male white-collar worker.
| age | year | career length | gross wage | gross benefit | gross replacement rate | net replacement rate | net option value (€) | net peak value (€) | net ∆SSW | net PR | net itax |
|---|---|---|---|---|---|---|---|---|---|---|---|
| 60 | 2000 | 40 | 47,811 | 15,763 | 0.330 | 0.519 | 59,255 | −28,838 | . | . | . |
| 61 | 2001 | 41 | 49,534 | 16,600 | 0.335 | 0.522 | 42918 | −23,449 | −5,390 | 17,216 | 0.238 |
| 62 | 2002 | 42 | 50,758 | 17,512 | 0.345 | 0.529 | 27,929 | −16,110 | −7,339 | 14,984 | 0.329 |
| 63 | 2003 | 43 | 51,565 | 18,193 | 0.353 | 0.537 | 13,094 | −8,680 | −7,429 | 14,454 | 0.340 |
| 64 | 2004 | 44 | 52,512 | 18,856 | 0.359 | 0.543 | 0 | 0 | −8,680 | 12,591 | 0.408 |
Table 2
Pension benefit for a single female white-collar worker.
| age | year | career length | gross wage | gross benefit | gross replacement rate | net replacement rate | net option value (€) | net peak value (€) | net ∆SSW | net PR | net itax |
|---|---|---|---|---|---|---|---|---|---|---|---|
| 60 | 2000 | 40 | 26,260 | 11,402 | 0.434 | 0.683 | 31,744 | −23,272 | . | . | . |
| 61 | 2001 | 41 | 27,171 | 12,057 | 0.444 | 0.690 | 21,256 | −20,234 | −3,039 | 11000 | 0.216 |
| 62 | 2002 | 42 | 27,733 | 12,801 | 0.462 | 0.704 | 12,324 | −15,236 | −4,998 | 8,844 | 0.361 |
| 63 | 2003 | 43 | 28,193 | 13,029 | 0.462 | 0.702 | 6,461 | −7,280 | −7,956 | 5,712 | 0.582 |
| 64 | 2004 | 44 | 28,664 | 13,409 | 0.468 | 0.708 | 0 | 0 | −7,280 | 6,098 | 0.544 |
Table 3
Pension benefit for a single male blue-collar worker.
| age | year | career length | gross wage | gross benefit | gross replacement rate | net replacement rate | net option value (€) | net peak value (€) | net ∆SSW | net PR | net itax |
|---|---|---|---|---|---|---|---|---|---|---|---|
| 60 | 2000 | 40 | 22,541 | 10,833 | 0.481 | 0.734 | 23,179 | −24,162 | . | . | . |
| 61 | 2001 | 41 | 23,205 | 11,365 | 0.490 | 0.748 | 15,894 | −19,531 | −4,631 | 7,678 | 0.376 |
| 62 | 2002 | 42 | 23,489 | 11,963 | 0.509 | 0.768 | 10,245 | −13,093 | −6,438 | 5,536 | 0.538 |
| 63 | 2003 | 43 | 23,832 | 12,395 | 0.520 | 0.771 | 4,972 | −6,662 | −6,431 | 5,296 | 0.548 |
| 64 | 2004 | 44 | 24,128 | 12,840 | 0.532 | 0.790 | 0 | 0 | 662 | 4,690 | 0.587 |
Table 4
Pension benefit for a single female blue-collar worker.
| age | year | career length | gross wage | gross benefit | gross replacement rate | net replacement rate | net option value (€) | net peak value (€) | net ∆SSW | net PR | net itax |
|---|---|---|---|---|---|---|---|---|---|---|---|
| 60 | 2000 | 40 | 13,662 | 8,187 | 0.599 | 0.785 | 19,236 | −13,706 | . | . | . |
| 61 | 2001 | 41 | 14,056 | 8,856 | 0.630 | 0.828 | 9,189 | −15,512 | 1,806 | 10,302 | −0.213 |
| 62 | 2002 | 42 | 14,285 | 9,438 | 0.661 | 0.861 | 4,466 | −11,856 | −3,656 | 4,642 | 0.441 |
| 63 | 2003 | 43 | 14,475 | 9,438 | 0.652 | 0.831 | 6,707 | −1,405 | −10,451 | −2,299 | 1.282 |
| 64 | 2004 | 44 | 14,682 | 9,992 | 0.681 | 0.873 | 0 | 0 | −1,405 | 6,563 | 0.176 |
Table 5
CELS benefit for a single male white-collar worker.
| age | year | career length | gross wage | gross CELS benefit | gross future pension benefit | gross replacement rate | net replacement rate | net option value (€) | net peak value (€) | net ∆SSW | net PR | net itax |
|---|---|---|---|---|---|---|---|---|---|---|---|---|
| 58 | 1998 | 38 | 44,546 | 24,138 | 18,856 | 0.542 | 0.708 | 52,268 | −74,371 | . | . | . |
| 59 | 1999 | 39 | 45,680 | 24,704 | 18,856 | 0.541 | 0.704 | 46,317 | −59,835 | −14,536 | 6,366 | 0.696 |
| 60 | 2000 | 40 | 47,811 | 25,773 | 18,856 | 0.539 | 0.699 | 38,397 | −47,241 | −12,593 | 8,331 | 0.602 |
| 61 | 2001 | 41 | 49,534 | 26,646 | 18,856 | 0.538 | 0.696 | 28,432 | −35,566 | −11,676 | 9234 | 0.558 |
| 62 | 2002 | 42 | 50,758 | 27,317 | 18,856 | 0.538 | 0.694 | 19,486 | −22,632 | −12,933 | 7,715 | 0.626 |
| 63 | 2003 | 43 | 51,565 | 27,794 | 18,856 | 0.539 | 0.694 | 10,414 | −10,276 | −12,356 | 7,886 | 0.610 |
| 64 | 2004 | 44 | 52,512 | 28,527 | 18,856 | 0.543 | 0.698 | 0 | 0 | −10,276 | 9,400 | 0.522 |
Table 6
CELS benefit for a single female white-collar worker.
| age | year | career length | gross wage | gross CELS benefit | gross future pension benefit | gross replacement rate | net replacement rate | net option value (€) | net peak value (€) | net ∆SSW | net PR | net itax |
|---|---|---|---|---|---|---|---|---|---|---|---|---|
| 58 | 1998 | 38 | 24,864 | 14,296 | 13,348 | 0.575 | 0.807 | 26,046 | −53,426 | . | . | . |
| 59 | 1999 | 39 | 25,360 | 14,545 | 13,371 | 0.574 | 0.802 | 23,575 | −42,988 | −10,438 | 2,677 | 0.796 |
| 60 | 2000 | 40 | 26,260 | 14,998 | 13,401 | 0.571 | 0.797 | 19,485 | −34,200 | −8,787 | 4290 | 0.672 |
| 61 | 2001 | 41 | 27,171 | 15,464 | 13,411 | 0.569 | 0.792 | 14,065 | −36,355 | −7,946 | 5,163 | 0.606 |
| 62 | 2002 | 42 | 27,733 | 15,804 | 13,413 | 0.570 | 0.791 | 9,698 | −16,871 | −9,384 | 3,541 | 0.726 |
| 63 | 2003 | 43 | 28,193 | 16,108 | 13,413 | 0.571 | 0.792 | 4,787 | −8,420 | −8,451 | 4,312 | 0.662 |
| 64 | 2004 | 44 | 28,664 | 16,603 | 13,405 | 0.579 | 0.800 | 0 | 0 | −8,420 | 4,072 | 0.674 |
Table 7
CELS benefit for a single male blue-collar worker.
| age | year | career length | gross wage | gross CELS benefit | gross future pension benefit | gross replacement rate | net replacement rate | net option value (€) | net peak value (€) | net ∆SSW | net PR | net itax |
|---|---|---|---|---|---|---|---|---|---|---|---|---|
| 58 | 1998 | 38 | 21,883 | 13,377 | 12,851 | 0.611 | 0.855 | 16,070 | −52,090 | . | . | . |
| 59 | 1999 | 39 | 22,113 | 13,445 | 12,852 | 0.608 | 0.851 | 14,868 | −41,673 | −10,417 | 1,297 | 0.889 |
| 60 | 2000 | 40 | 22,541 | 13,707 | 12,851 | 0.608 | 0.850 | 12,369 | −32,815 | −8,858 | 2,618 | 0.772 |
| 61 | 2001 | 41 | 23,205 | 13,971 | 12,852 | 0.602 | 0.843 | 8,913 | −24,901 | −7,914 | 3,472 | 0.695 |
| 62 | 2002 | 42 | 23,489 | 14,266 | 12,846 | 0.607 | 0.846 | 6,104 | −15,992 | −8,909 | 2,166 | 0.804 |
| 63 | 2003 | 43 | 23,832 | 14,613 | 12,844 | 0.613 | 0.848 | 3,054 | −7,985 | −8,007 | 2,841 | 0.738 |
| 64 | 2004 | 44 | 24,128 | 15,243 | 12,840 | 0.632 | 0.866 | 0 | 0 | −7,985 | 2,516 | 0.760 |
Table 8
CELS benefit for a single female blue-collar worker.
| age | year | career length | gross wage | gross CELS benefit | gross future pension benefit | gross replacement rate | net replacement rate | net option value (€) | net peak value (€) | net ∆SSW | net PR | net itax |
|---|---|---|---|---|---|---|---|---|---|---|---|---|
| 58 | 1998 | 38 | 13,155 | 9,624 | 9,992 | 0.732 | 0.938 | 0 | 0 | . | . | . |
| 59 | 1999 | 39 | 13,564 | 9,878 | 9,992 | 0.728 | 0.943 | 516 | 8,497 | −8,497 | −332 | 1.041 |
| 60 | 2000 | 40 | 13,662 | 9,966 | 9,992 | 0.729 | 0.941 | 971 | 17,026 | −8,529 | −562 | 1.071 |
| 61 | 2001 | 41 | 14,056 | 10,256 | 9,992 | 0.730 | 0.941 | 833 | 24,669 | −7,643 | 290 | 0.964 |
| 62 | 2002 | 42 | 14,285 | 10,474 | 9,992 | 0.733 | 0.934 | 2,199 | 34,208 | −9,539 | −1,791 | 1.231 |
| 63 | 2003 | 43 | 14,475 | 10,693 | 9,992 | 0.739 | 0.925 | 3,488 | 43,365 | −9,157 | −1,545 | 1.203 |
| 64 | 2004 | 44 | 14,682 | 10,843 | 9,992 | 0.739 | 0.925 | 2,414 | 50,034 | −6,669 | 771 | 0.896 |
Table 9
Simulation variants: average pension and CELS benefits over all choice years r
| Net benefits (after taxes and social contributions) |
Gross benefits (before taxes and social contributions) |
|||||||||
|---|---|---|---|---|---|---|---|---|---|---|
| white-collar | blue-collar | white-collar | blue-collar | |||||||
| male | female | male | Female | x̅ | male | female | male | female | x̅ | |
| Single (section 6.3.1) | ||||||||||
| Pension benefit | ||||||||||
| Rep. ratio | 0.530 | 0.698 | 0.762 | 0.835 | 0.706 | 0.344 | 0.454 | 0.506 | 0.645 | 0.487 |
| ∆SSW | −7,210 | −5,818 | −6,041 | −3,426 | −9,476 | −6,789 | −6,889 | −3,406 | ||
| PR | 14,811 | 7,913 | 5,800 | 4,802 | 36,598 | 18,799 | 14,457 | 9,760 | ||
| Itax | 0.329 | 0.426 | 0.512 | 0.422 | 0.422 | 0.207 | 0.268 | 0.324 | 0.263 | 0.265 |
| CELS benefit | ||||||||||
| Rep. ratio | 0.699 | 0.797 | 0.851 | 0.935 | 0.820 | 0.540 | 0.573 | 0.612 | 0.733 | 0.614 |
| ∆SSW | −12,395 | −8,904 | −8,682 | −8,339 | −21,530 | −13,110 | −12,259 | −9,060 | ||
| PR | 8,155 | 4,009 | 2,485 | −528 | 21,579 | 10,990 | 7,925 | 3,447 | ||
| Itax | 0.603 | 0.689 | 0.777 | 1.068 | 0.784 | 0.499 | 0.544 | 0.607 | 0.725 | 0.593 |
| With partner without income of his or her own (section 6.3.2) | ||||||||||
| Pension benefit | ||||||||||
| Rep. ratio | 0.645 | 0.731 | 0.775 | 0.900 | 0.763 | 0.430 | 0.567 | 0.633 | 0.805 | 0.609 |
| ∆SSW | 16,213 | −10,912 | −9,498 | −4,429 | −11,845 | −8,486 | −8,611 | −4,257 | ||
| PR | 9,534 | 6,036 | 5,301 | 5,318 | 34,229 | 17,102 | 12,735 | 8,909 | ||
| Itax | 0.650 | 0.677 | 0.663 | 0.476 | 0.617 | 0.258 | 0.335 | 0.406 | 0.329 | 0.332 |
| CELS benefit | ||||||||||
| Rep. ratio | 0.764 | 0.798 | 0.811 | 0.853 | 0.806 | 0.577 | 0.640 | 0.688 | 0.796 | 0.675 |
| ∆SSW | −19,372 | −14,634 | −13,257 | −10,021 | −23,646 | −15,059 | −14,190 | −10,118 | ||
| PR | 4,781 | 1,507 | 951 | −650 | 19,463 | 9,041 | 5,994 | 2,389 | ||
| Itax | 0.816 | 0.925 | 0.950 | 1.075 | 0.941 | 0.548 | 0.625 | 0.703 | 0.810 | 0.672 |
| Single, after a five-year shorter career (Section 6.3.3) | ||||||||||
| Pension benefit | ||||||||||
| Rep. ratio | 0.511 | 0.652 | 0.698 | 0.731 | 0.648 | 0.326 | 0.420 | 0.467 | 0.571 | 0.446 |
| ∆SSW | −6,766 | −4,787 | −5,453 | −1,969 | −8,490 | −4,977 | −6,037 | −1,690 | ||
| PR | 15,255 | 8,944 | 6,387 | 6,259 | 37,584 | 20,611 | 15,309 | 11,476 | ||
| Itax | 0.309 | 0.350 | 0.463 | 0.241 | 0.341 | 0.185 | 0.196 | 0.284 | 0.130 | 0.199 |
Table 10
The effect of technical variants on the cost of postponing retirement: simulation variants for single workers: Averages over all choice years r.
| Net benefits (after taxes and social contributions |
Gross benefits (before taxes and social contributions) |
|||||||||
|---|---|---|---|---|---|---|---|---|---|---|
| white-collar | blue-collar | white-collar | blue-collar | |||||||
| male | female | male | female | x̅ | male | female | male | female | x̅ | |
| Variant 1: Increase career length required for full pension entitlement (section 6.4.3.1) | ||||||||||
| Pension benefit | ||||||||||
| Rep. ratio | 0.523 | 0.690 | 0.746 | 0.818 | 0.694 | 0.337 | 0.447 | 0.497 | 0.633 | 0.478 |
| ∆SSW | −7,106 | −5,351 | −5,916 | −2,604 | −9,242 | −5,855 | −6,701 | −2,388 | ||
| PR | 14,915 | 8,381 | 5,925 | 5,624 | 36,832 | 19,732 | 14,646 | 10,778 | ||
| Itax | 0.324 | 0.391 | 0.502 | 0.319 | 0.384 | 0.202 | 0.230 | 0.316 | 0.183 | 0.233 |
| Variant 2: Abolish post-retirement tax exemption + increase minimum pension benefit (Section 6.4.3.2) | ||||||||||
| Pension benefit | ||||||||||
| Rep. ratio | 0.464 | 0.591 | 0.647 | 0.893 | 0.649 | 0.344 | 0.454 | 0.506 | 0.773 | 0.520 |
| ∆SSW | −6,136 | −4,842 | −5,056 | −3,537 | −9,476 | −6,789 | −6,889 | −4,087 | ||
| PR | 15,885 | 8,890 | 6,784 | 4,691 | 36,598 | 18,799 | 14,457 | 9,079 | ||
| Itax | 0.280 | 0.355 | 0.429 | 0.435 | 0.375 | 0.207 | 0.268 | 0.324 | 0.316 | 0.279 |
| CELS benefit | ||||||||||
| Rep. ratio | 0.646 | 0.689 | 0.729 | 0.835 | 0.714 | 0.540 | 0.573 | 0.612 | 0.733 | 0.614 |
| ∆SSW | −11,712 | −7,879 | −7,605 | −7,783 | −21,530 | −13,110 | −12,259 | −9,331 | ||
| PR | 8,838 | 5,034 | 3,562 | 28 | 21,579 | 10,990 | 7,925 | 3,176 | ||
| Itax | 0.569 | 0.610 | 0.680 | 0.996 | 0.784 | 0.499 | 0.544 | 0.607 | 0.747 | 0.599 |
| Variant 3: Equalise social contribution rate for CELS and pension beneficiaries(Section 6.4.3.3) | ||||||||||
| CELS benefit | ||||||||||
| Rep. ratio | 0.666 | 0.761 | 0.812 | 0.862 | 0.775 | 0.540 | 0.573 | 0.612 | 0.733 | 0.614 |
| ∆SSW | −11,847 | −8,522 | −8,310 | −7,833 | −21,530 | −13,110 | −12,259 | −9,060 | ||
| PR | 8,703 | 4,392 | 2,857 | −22 | 2,1579 | 10,990 | 7,925 | 3,447 | ||
| Itax | 0.576 | 0.660 | 0.744 | 1.00 | 0.746 | 0.499 | 0.544 | 0.607 | 0.725 | 0.593 |
Download links
A two-part list of links to download the article, or parts of the article, in various formats.