Simulating disease transmission dynamics at a multi-scale level
- University of Liverpool, United Kingdom
- World Health Organization, Switzerland
Cite this article
as: M. B. Hoshen, A. H. Burton, T. J. V. Bowcock; 2007; Simulating disease transmission dynamics at a multi-scale level; International Journal of Microsimulation; 1(1); 26-34.
doi: 10.34196/ijm.00004
- Article
- Figures and data
- Jump to
Figures
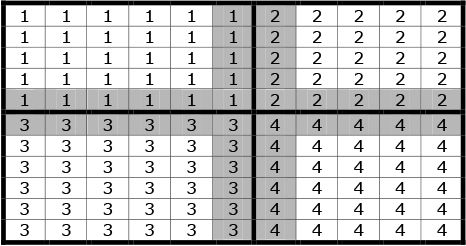
Figure 1

Example of the grid structure of regions, towns and overlaps.
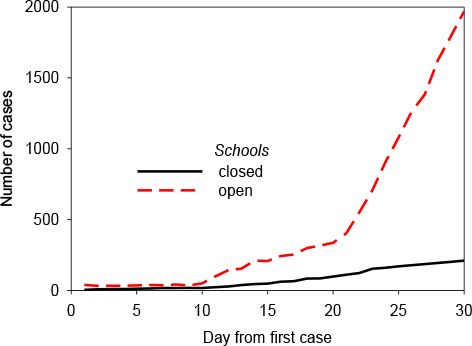
Figure 2

A typical time course for disease spread (origin = Midlands).
Figure 3
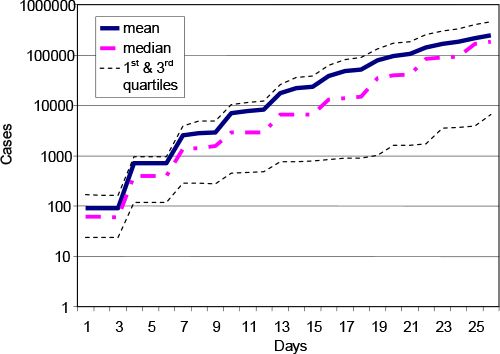
Time course for 20 runs, assuming 1% of adults commute daily and schools are kept open.
Figure 4
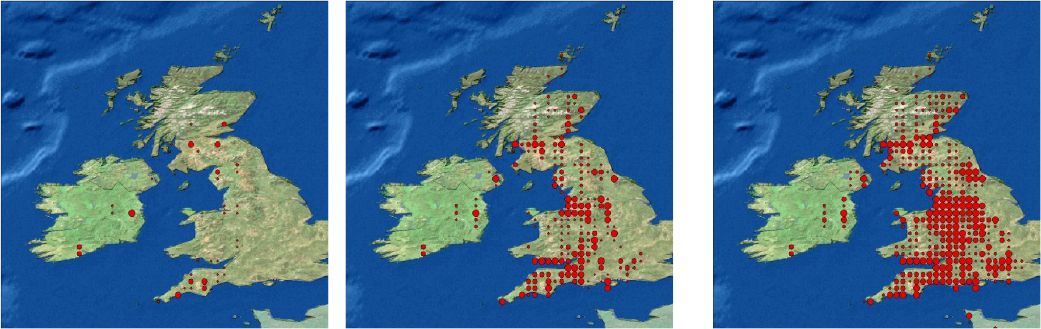
Spatial distribution of cases after 3, 19 and 25 days for a highly infectious disease, allowing for long distance transmission. The size of the dot represents the number of cases at the grid point.
Note: Disease outbreak was seeded randomly in three initial centres.
Figure 5

Changes in MPI usage efficiency in response to grid size and processor nodes.
Tables
Table 1
Alternative 24 × 24 grid configurations.
| Total regions (processors) |
Shape of region | Simulation Time (seconds) |
|
|---|---|---|---|
| Towns along X-length | Towns along Y-length | ||
| 1 | 24 | 24 | 921 |
| 2 | 12 | 24 | 878 |
| 2 | 24 | 12 | 835 |
| 3 | 24 | 8 | 815 |
| 4 | 24 | 6 | 826 |
| 4 | 12 | 12 | 791 |
| 4 | 6 | 24 | 722 |
| 6 | 24 | 4 | 595 |
| 8 | 24 | 3 | 460 |
| 12 | 24 | 2 | 356 |
| 24 | 8 | 3 | 444 |
| 24 | 6 | 4 | 427 |
| 24 | 12 | 2 | 359 |
| 24 | 24 | 1 | 281 |
| 24 | 1 | 24 | 211 |
| 36 | 8 | 2 | 345 |
| 36 | 4 | 4 | 328 |
| 36 | 2 | 8 | 296 |
Table 2
Alternative 36 × 36 grid configurations.
| Total regions (processors) |
Shape of region | |
|---|---|---|
| Towns along X-length | Towns along Y-length | |
| 4 | 18 | 18 |
| 9 | 12 | 12 |
| 36 | 1 | 36 |
| 36 | 3 | 12 |
| 36 | 2 | 18 |
| 27 | 4 | 12 |
| 18 | 6 | 12 |
| 12 | 9 | 12 |
Download links
A two-part list of links to download the article, or parts of the article, in various formats.