Econometric flexibility in microsimulation: An age-centred regression approach
- University of Maryland, United States
- Investment Company Institute, United States
- Public Policy Institute, AARP, United States
- Article
- Figures and data
- Jump to
Figures

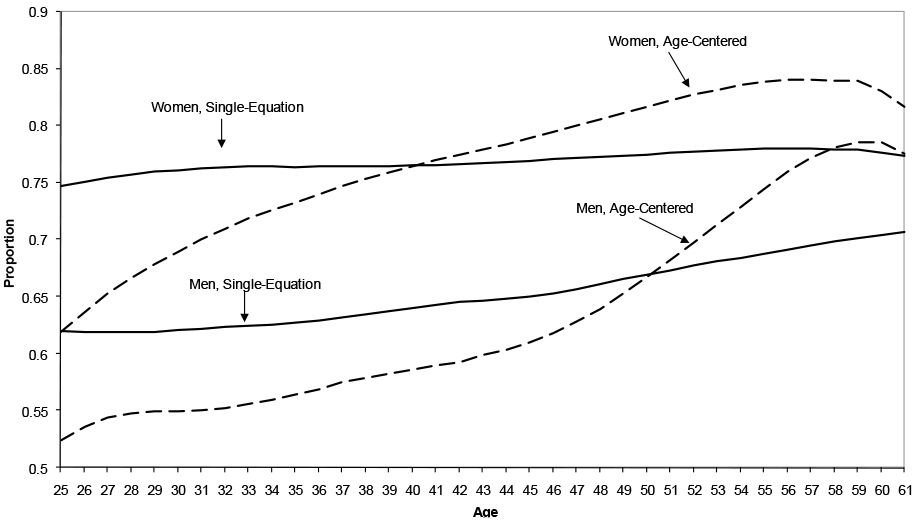
Marginal effect of lagged LFP on labour force participation comparing single-equation and age-centred regressions men and women, ages 25–61.
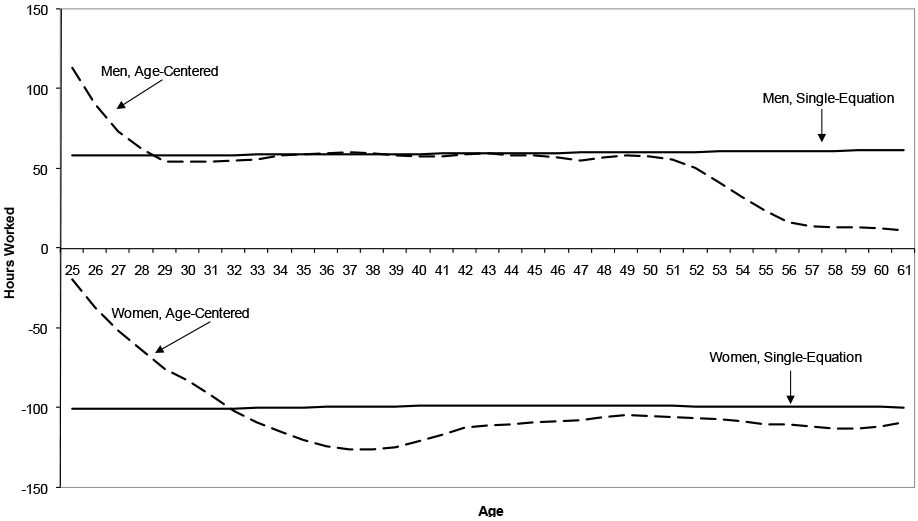
Marginal effect of being married on part-time hours worked comparing single-equation and age-centred regressions men and women, ages 25–61.
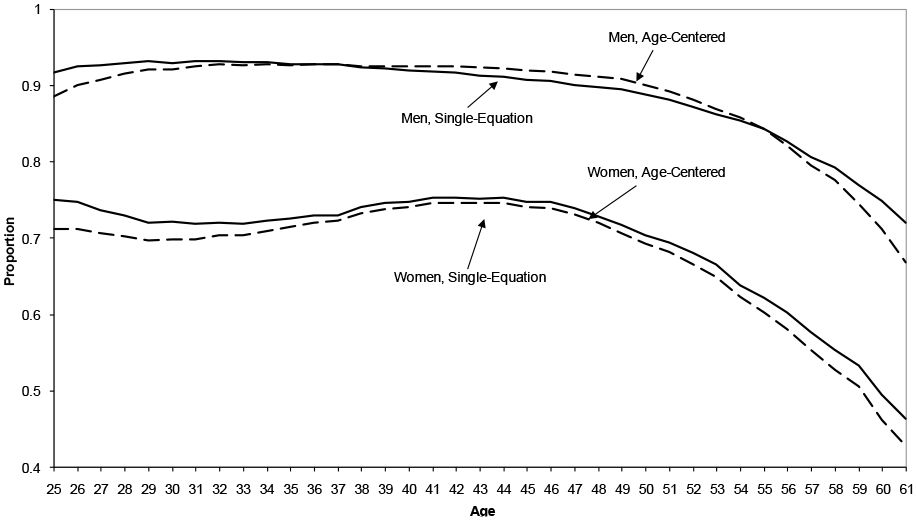
Mean predicted labour force participation comparing single-equation and age-centred regressions men and women, ages 25–61.
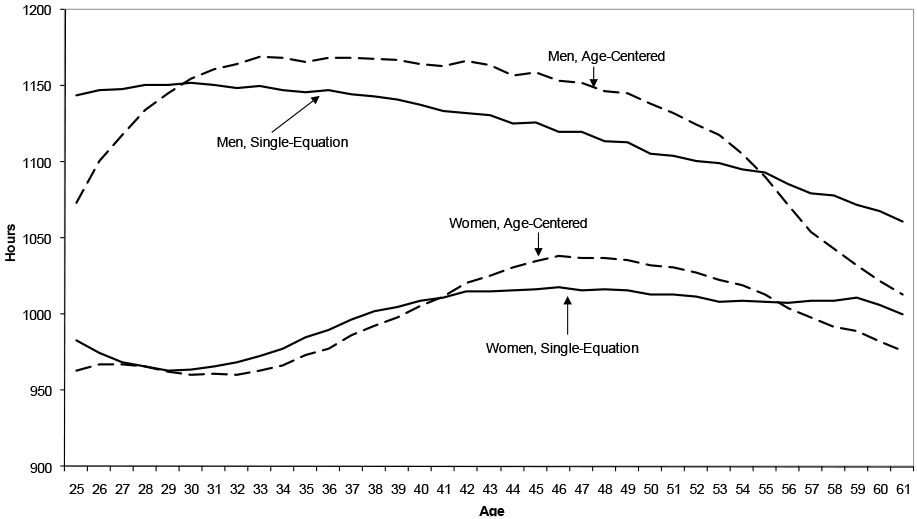
Mean expected part-time hours comparing single-equation and age-centred regressions men and women, ages 25–61.
Tables
Regression results using single equation with linear age term, men and women.
| Men | Women | |||||
|---|---|---|---|---|---|---|
| Covariate | Pr(LFP = 1) | Pr(FT = 1) | PT Hours | Pr(LFP = 1) | Pr(FT = 1) | PT Hours |
| Lagged Labour Force Participation | 4.082 | 4.361 | ||||
| (0.012)** | (0.008)** | |||||
| Married | 0.166 | 0.822 | 0.236 | −0.525 | −0.708 | −0.371 |
| (0.012)** | (0.009)** | (0.015)** | (0.009)** | (0.006)** | (0.010)** | |
| Age of Person | −0.021 | −0.002 | −0.011 | −0.004 | 0.012 | 0.013 |
| (0.001)** | (0.001)** | (0.001)** | (0.001)** | (0.000)** | (0.001)** | |
| Receiving Social Security Income | −2.081 | −2.243 | −1.218 | −1.085 | −1.110 | −0.606 |
| (0.026)** | (0.035)** | (0.042)** | (0.020)** | (0.022)** | (0.025)** | |
| High School Education | 0.111 | 0.552 | 0.111 | 0.398 | 0.299 | 0.101 |
| (0.015)** | (0.012)** | (0.019)** | (0.011)** | (0.009)** | (0.012)** | |
| Some College Education | −0.049 | 0.491 | −0.074 | 0.482 | 0.325 | 0.093 |
| (0.017)** | (0.013)** | (0.022)** | (0.013)** | (0.010)** | (0.014)** | |
| College Education | 0.241 | 0.646 | −0.116 | 0.637 | 0.490 | 0.071 |
| (0.016)** | (0.013)** | (0.021)** | (0.013)** | (0.010)** | (0.014)** | |
| Number of Children Under 6 Years | −0.481 | −0.516 | −0.299 | |||
| (0.008)** | (0.006)** | (0.007)** | ||||
| Birth Year: 1920–1929 | 0.208 | 0.129 | 0.074 | 0.175 | 0.078 | 0.055 |
| (0.042)** | (0.041)** | (0.066) | (0.032)** | (0.033)* | (0.045) | |
| Birth Year: 1930–1939 | 0.376 | 0.202 | 0.073 | 0.422 | 0.157 | 0.185 |
| (0.041)** | (0.041)** | (0.064) | (0.032)** | (0.033)** | (0.044)** | |
| Birth Year: 1940–1949 | 0.392 | 0.331 | 0.178 | 0.64 | 0.347 | 0.337 |
| (0.042)** | (0.042)** | (0.065)** | (0.032)** | (0.033)** | (0.044)** | |
| Birth Year: 1950–1959 | 0.341 | 0.293 | 0.151 | 0.831 | 0.543 | 0.547 |
| (0.043)** | (0.042)** | (0.068)* | (0.034)** | (0.033)** | (0.045)** | |
| Birth Year: 1960–1969 | 0.147 | 0.266 | 0.068 | 0.863 | 0.700 | 0.660 |
| (0.046)** | (0.044)** | (0.070) | (0.035)** | (0.034)** | (0.046)** | |
| Birth Year: 1970–1979 | −0.001 | 0.115 | 0.002 | 0.744 | 0.732 | 0.711 |
| (0.052) | (0.047)* | (0.074) | (0.040)** | (0.036)** | (0.049)** | |
| Constant | −0.443 | 1.125 | −2.169 | 0.152 | ||
| (0.063)** | (0.056)** | (0.048)** | (0.041)** | |||
| Observations | 1,034,541 | 9,44,231 | 86,049 | 1,113,085 | 7,82,972 | 2,54,685 |
-
Notes: (i) Models denoted by Pr(LFP = 1) – labour force participation; Pr(FT = 1) –full-time or part-time work; PT Hours –part-time hours for those working part-time. (ii) Robust standard errors italicised and in parentheses.
-
*
significant at 5%.
-
**
significant at 1%.
Regression results using age centring, men ages 30 and 55.
| Men, Age 30 | Men, Age 55 | |||||
|---|---|---|---|---|---|---|
| Covariate | Pr(LFP = 1) | Pr(FT = 1) | PT Hours | Pr(LFP = 1) | Pr(FT = 1) | PT Hours |
| Lagged Labour Force Participation | 3.451 | 4.594 | ||||
| (0.022)** | (0.025)** | |||||
| Married | −0.043 | 0.793 | 0.226 | 0.335 | 0.562 | 0.091 |
| (0.018)* | (0.014)** | (0.024)** | (0.028)** | (0.022)** | (0.036)* | |
| Age of Person | 0.046 | 0.064 | 0.028 | −0.123 | −0.089 | −0.062 |
| (0.004)** | (0.003)** | (0.005)** | (0.005)** | (0.004)** | (0.006)** | |
| Receiving Social Security Income | −1.687 | −1.905 | −1.211 | −2.293 | −2.555 | −1.248 |
| (0.052)** | (0.075)** | (0.090)** | (0.050)** | (0.067)** | (0.068)** | |
| High School Education | −0.088 | 0.617 | 0.230 | 0.152 | 0.360 | 0.012 |
| (0.026)** | (0.021)** | (0.034)** | (0.030)** | (0.024)** | (0.039) | |
| Some College Education | −0.364 | 0.475 | −0.060 | 0.123 | 0.371 | −0.078 |
| (0.028)** | (0.022)** | (0.036)** | (0.037)** | (0.029)** | (0.047) | |
| College Education | −0.043 | 0.536 | −0.248 | 0.464 | 0.580 | 0.047 |
| (0.028) | (0.022)** | (0.035) | (0.035) | (0.027)** | (0.046) | |
| Birth Year: 1920–1929 | −0.065 | −0.180 | −0.169 | |||
| (0.081) | (0.067)** | (0.103) | ||||
| Birth Year: 1930–1939 | −0.133 | −0.382 | −0.291 | |||
| (0.082) | (0.067)** | (0.104)** | ||||
| Birth Year: 1940–1949 | −0.277 | −0.388 | −0.295 | |||
| (0.082)** | (0.068)** | (0.105)** | ||||
| Birth Year: 1950–1959 | 0.011 | −0.124 | −0.008 | −0.365 | −0.289 | −0.232 |
| (0.030) | (0.025)** | (0.041) | (0.098)** | (0.080)** | (0.126) | |
| Birth Year: 1960–1969 | −0.025 | −0.058 | −0.044 | |||
| (0.030) | (0.025)* | (0.042) | ||||
| Birth Year: 1970–1979 | −0.001 | 0.009 | −0.035 | |||
| (0.034) | (0.028) | (0.047) | ||||
| Constant | −1.578 | −0.549 | 5.136 | 6.613 | ||
| (0.117)** | (0.094)** | (0.302)** | (0.239)** | |||
| Observations | 3,08,015 | 2,90,385 | 29,024 | 1,88,934 | 1,60,656 | 16,547 |
-
Notes: (i) Models denoted by Pr(LFP = 1) – labour force participation; Pr(FT = 1) –full-time or part-time work; PT Hours –part-time hours for those working part-time. (ii) Robust standard errors italicised and in parentheses.
-
*
significant at 5%.
-
**
significant at 1%.
Regression results using age centring, women ages 30 and 55.
| Women, Age 30 | Women, Age 55 | |||||
|---|---|---|---|---|---|---|
| Covariate | Pr(LFP = 1) | Pr(FT = 1) | PT Hours | Pr(LFP = 1) | Pr(FT = 1) | PT Hours |
| Lagged Labour Force Participation | 3.717 | 5.028 | ||||
| (0.013)** | (0.020)** | |||||
| Married | −0.534 | −0.547 | −0.306 | −0.535 | −0.780 | −0.413 |
| (0.015)** | (0.011)** | (0.016)** | (0.022)** | (0.016)** | (0.024)** | |
| Age of Person | 0.029 | 0.001 | 0.007 | −0.061 | −0.020 | −0.017 |
| (0.003)** | (0.002) | (0.003)* | (0.004)** | (0.003)** | (0.004)** | |
| Receiving Social Security Income | −0.882 | −0.794 | −0.515 | −1.110 | −1.368 | −0.718 |
| (0.044)** | (0.050)** | (0.054)** | (0.047)** | (0.050)** | (0.050)** | |
| High School Education | 0.436 | 0.398 | 0.107 | 0.373 | 0.272 | 0.076 |
| (0.019)** | (0.018)** | (0.023)** | (0.024)** | (0.019)** | (0.026)** | |
| Some College Education | 0.526 | 0.454 | 0.132 | 0.425 | 0.290 | 0.047 |
| (0.021)** | (0.019)** | (0.024)** | (0.031)** | (0.022)** | (0.032) | |
| College Education | 0.700 | 0.731 | 0.166 | 0.598 | 0.403 | 0.066 |
| (0.021)** | (0.019)** | (0.024)** | (0.033)** | (0.023)** | (0.034) | |
| Number of Children Under 6 Years | −0.435 | −0.584 | −0.309 | −0.209 | −0.201 | −0.201 |
| (0.008)** | (0.007)** | (0.009)** | (0.084) | (0.060)** | (0.085)* | |
| Birth Year: 1920–1929 | −0.054 | −0.094 | −0.034 | |||
| (0.062) | (0.054) | (0.074) | ||||
| Birth Year: 1930–1939 | 0.096 | −0.095 | 0.084 | |||
| (0.063) | (0.054) | (0.075) | ||||
| Birth Year: 1940–1949 | 0.220 | 0.135 | 0.220 | |||
| (0.063)** | (0.055)* | (0.075)** | ||||
| Birth Year: 1950–1959 | 0.299 | 0.255 | 0.293 | 0.342 | 0.244 | 0.351 |
| (0.020)** | (0.016)** | (0.022)** | (0.076)** | (0.062)** | (0.086)** | |
| Birth Year: 1960–1969 | 0.409 | 0.449 | 0.455 | |||
| (0.021)** | (0.017)** | (0.023)** | ||||
| Birth Year: 1970–1979 | 0.393 | 0.499 | 0.510 | |||
| (0.024)** | (0.019)** | (0.027)** | ||||
| Constant | −2.408 | 0.530 | 0.855 | 2.184 | ||
| (0.086)** | (0.067)** | (0.247)** | (0.178)** | |||
| Observations | 330,794 | 239,891 | 81,777 | 205,062 | 127,326 | 40,052 |
-
Notes: (i) Models denoted by Pr(LFP = 1) – labour force participation; Pr(FT = 1) –full-time or part-time work; PT Hours –part-time hours for those working part-time. (ii) Robust standard errors italicised and in parentheses.
-
*
significant at 5%.
-
**
significant at 1%.