Dynamic spatial microsimulation using the concept of GHOSTs
- University of Leeds, UK
Cite this article
as: D. Rossiter, D. Ballas, G. Clarke, D. Dorling; 2009; Dynamic spatial microsimulation using the concept of GHOSTs; International Journal of Microsimulation; 2(2); 15-26.
doi: 10.34196/ijm.00014
- Article
- Figures and data
- Jump to
Figures
Figure 1

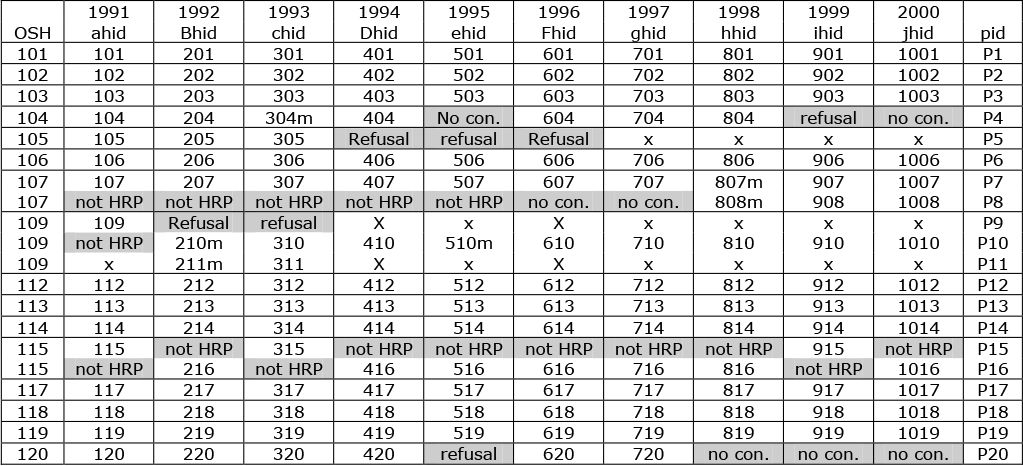
Individual interview histories for twenty Welsh members of the BHPS.
Notes: not HRP – not Household Reference Person; no con. – no contact; for guide to variable names see text.
Figure 2

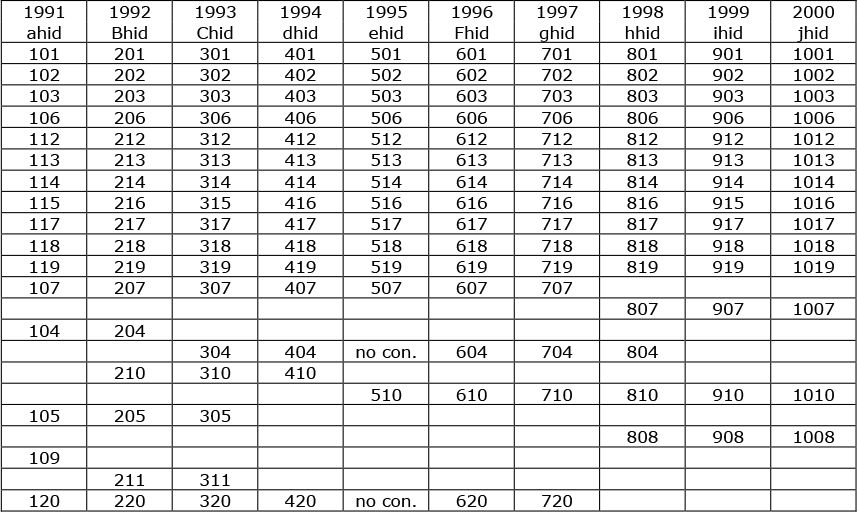
Individual household space histories derived from Figure 1.
Notes: no con. – no contact.
Figure 3

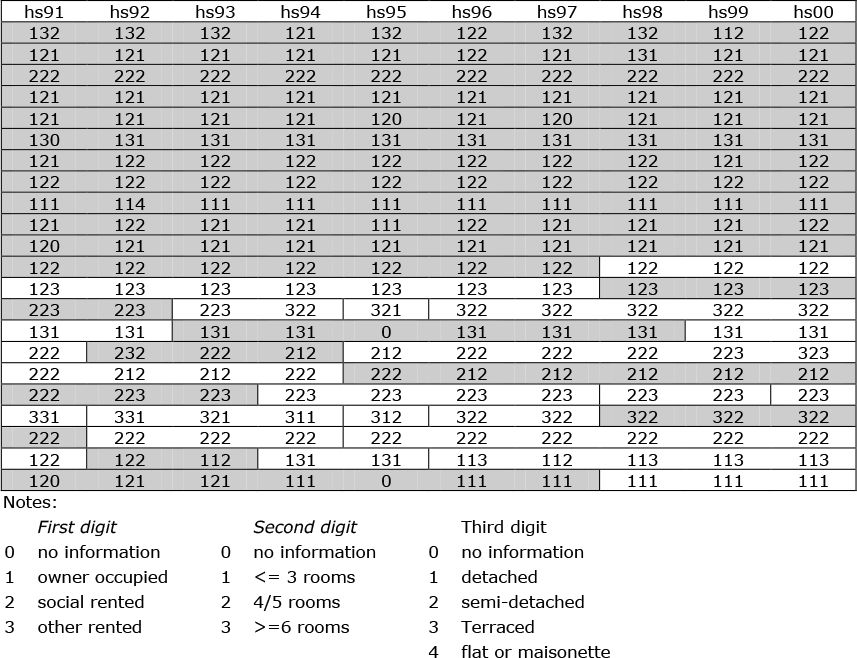
Generic household space histories derived from Figure 2.
Tables
Table 1
Parameter estimates for log (household income) and logit (PC ownership) together with example estimates for the period 1991–2020.
| INCOME | main effect | wave effect | Year 1991 | Income (£) 19,015 | PERSONAL COMPUTER OWNERSHIP | main effect | wave effect | Year 1991 | % with a PC 40 |
|---|---|---|---|---|---|---|---|---|---|
| intercept/wave | 9.10 | 0.014 | 1992 | 19,264 | intercept/wave | −1.51 | 0.125 | 1992 | 43 |
| London | 0.14 | 0.014 | 1993 | 19,516 | London | 0.24 | 0.021 | 1993 | 45 |
| SE | −0.04 | 0.018 | 1994 | 19,772 | SE | 0.07 | 0.006 | 1994 | 47 |
| SW | −0.19 | 0.022 | 1995 | 20,030 | SW | −0.10 | 0.013 | 1995 | 49 |
| Wales | 0.06 | −0.016 | 1996 | 20,292 | Wales | −0.16 | 0.022 | 1996 | 52 |
| E Anglia | −0.18 | 0.013 | 1997 | 20,558 | E Anglia | −0.24 | 0.014 | 1997 | 54 |
| E Midlands | −0.10 | 0.009 | 1998 | 20,827 | E Midlands | 0.16 | −0.032 | 1998 | 56 |
| W Midlands | −0.13 | 0.011 | 1999 | 21,099 | W Midlands | −0.23 | 0.010 | 1999 | 58 |
| NW | −0.07 | 0.020 | 2000 | 21,375 | NW | 0.10 | −0.016 | 2000 | 61 |
| Yorks & H | −0.11 | 0.012 | 2001 | 21,655 | Yorks & H | −0.11 | −0.007 | 2001 | 63 |
| North | −0.04 | 0.010 | 2002 | 21,939 | North | 0.18 | −0.032 | 2002 | 65 |
| Scotland | 0.00 | 0.000 | 2003 | 22,226 | Scotland | 0.09 | 0.001 | 2003 | 67 |
| No car | −0.76 | −0.002 | 2004 | 22,516 | No car | −0.41 | −0.037 | 2004 | 69 |
| One car | −0.36 | −0.001 | 2005 | 22,811 | One car | −0.04 | 0.006 | 2005 | 71 |
| Two+ cars | 0.00 | 0.000 | 2006 | 23,110 | Two+ cars | 0.45 | 0.031 | 2006 | 73 |
| Owned | 0.25 | 0.022 | 2007 | 23,412 | Owned | 0.20 | −0.001 | 2007 | 74 |
| Social rented | −0.03 | 0.030 | 2008 | 23,718 | Social rented | −0.28 | −0.024 | 2008 | 76 |
| Other rented | 0.00 | 0.000 | 2009 | 24,029 | Other rented | 0.08 | 0.025 | 2009 | 78 |
| High status | 0.63 | 0.007 | 2010 | 24,343 | High status | 0.48 | 0.024 | 2010 | 79 |
| Medium status | 0.40 | −0.001 | 2011 | 24,662 | Medium status | 0.31 | −0.015 | 2011 | 81 |
| Low status | 0.41 | 0.001 | 2012 | 24,984 | Low status | 0.10 | −0.013 | 2012 | 82 |
| Retired | −0.10 | 0.010 | 2013 | 25,311 | Retired | −0.95 | −0.008 | 2013 | 83 |
| Inactive | 0.00 | 0.000 | 2014 | 25,642 | Inactive | 0.06 | 0.012 | 2014 | 85 |
| Married | 0.39 | −0.005 | 2015 | 25,978 | Married | 0.18 | −0.011 | 2015 | 86 |
| Single parent | 0.13 | −0.004 | 2016 | 26,318 | Single parent | 0.16 | −0.006 | 2016 | 87 |
| Other | 0.00 | 0.000 | 2017 | 26,662 | Other | −0.34 | 0.017 | 2017 | 88 |
| No kids | 0.10 | −0.016 | 2018 | 27,011 | No kids | −0.71 | 0.036 | 2018 | 89 |
| One kid | 0.06 | −0.005 | 2019 | 27,364 | One kid | 0.17 | −0.001 | 2019 | 90 |
| Two+ kids | 0.00 | 0.000 | 2020 | 27,723 | Two+ kids | 0.54 | −0.035 | 2020 | 90 |
-
Notes: The estimated values are for a Welsh household with one car, living in an owner-occupied house, with a medium status head of household, married with two children.
Download links
A two-part list of links to download the article, or parts of the article, in various formats.